Frequency-dependent time delays for strong outbursts in four blazars from the Metsähovi and UMRAO monitoring databases
Abstract
The combined data of the University of Michigan Radio Astronomy Observatory and Metsähovi Radio Observatory provide us with radio light curves for Active Galactic Nuclei monitored by both observatories from 4.8 to 37 GHz covering time intervals up to 25 years. We consider here such composite light curves for four -ray blazars that have been nearly continuously monitored at both observatories: 0458–020, 0528+134, 1730–130 and 2230+114. We have decomposed the most prominent outbursts in the light curves of these four blazars into individual components using Gaussian model fitting, and estimated the epochs, amplitudes, and half-widths of these components as functions of frequency. We attempt to distinguish “core outbursts,” which show frequency-dependent time delays and are associated with brightening of the core, from “jet outbursts,” which appear nearly synchronously at all frequencies and are accompanied by the emergence of new jet components and their subsequent evolution. The outbursts in 0528+134 and 2230+114 display fine structure and consist of individual sub-outbursts. Available 43 GHz VLBA images allow us to identify only one pure core outburst (in 2230+114) and one pure jet outburst (0458–020). Most of the outbursts analyzed are mixed, in the sense that they display frequency-dependent time delays (i.e., they are optically thick) and are associated with the eventual emergence of new jet components. The maxima of the jet and mixed outbursts probably correspond to epochs when newly ejected components become fully optically thin. These epochs are also marked by a significant increase in the angular velocities of the ejected components. There is evidence that the outbursts in 2230+114 repeat every years, with the positions of individual sub-outbursts being preserved from one quasi-periodic eight-year cycle to another, even though their amplitudes vary by more than a factor of two. Preliminary estimates of the total durations of possible activity cycles based on an analysis of total flux-density variations and all available VLBI data are given for the remaining sources.
keywords:
galaxies:active, quasars:individual – 0458–020, quasars:individual – 0528+134, quasars:individual – 1730–130, quasars:individual – 2230+1141 Introduction
The term “blazar” is sometimes used to refer to the subset of core-dominated Active Galactic Nuclei (AGNs) that display high-amplitude variability over a wide range of wavebands, testifying that one of the relativistic jets in these objects is oriented close to the line of sight toward the Earth. The variability of blazars is a very complex phenomenon, and many different processes can take part, such as activity of the central engine, the propagation of primary perturbations down the jet, the evolution of the jet itself and various propagation effects (e.g. interaction with the surrounding medium) (Marscher 1996). During the last few years, important progress has been made in understanding many aspects of these phenomena through theoretical simulations (see Gomez et al. 2004 and references therein), investigations of total flux variability in the X-ray (Pian 2003), (Kranich 2003) and radio (Aller et al. 1999, Teräsranta, Wiren & Koivisto 2003) and various VLBI studies (e.g. Britzen et al. 1999a; Gomez et al. 2000; Lister & Homan 2005; Jorstad et al. 2005).
Nevertheless, our understanding of the global, long-term development of the activity remains very fragmentary. The detection of periodicity in the activity of the blazars OJ287 ( yr, Pursimo et al. 2000), 0059+581 ( yr, Pyatunina et al. 2003), 0202+149 ( yr, Pyatunina et al. 2000) and 0235+164 ( yr, Raiteri et al. 2001) looks promising in this regard, but all attempts to estimate exact periods for the activity have been unconvincing, even for the best sampled case of OJ287 (Kidger 2000), indicating that the phenomenon is probably not strictly periodic, but instead quasi-periodic. Indeed, even if the phenomena triggering a blazar’s activity were purely periodic in nature, the observed variability would likely be at best quasi-period, since it is the product of multiple complex processes associated with the generation and propagation of the radio emission. Numerical simulations of a binary black-hole model for OJ287 (Sundelius et al. 1997) show that the triggering of the activity itself can be a complex function of time (see below), making the observed variability even more complex. Nevertheless, analysis of such quasi-periodicity can be an important diagnostic tool for modelling the energy generation in AGNs and investigating binary black-hole systems. Below we propose an alternative approach to investigating the global evolution of blazars.
Physically, the activity of a source can be described using two independent time scales: , the characteristic time scale for the activity of the central engine, and , the time scale for evolution of the jet after it has been disturbed by a perturbation at it’s base. The time scale includes a whole sequence of events, from the initial appearance of the perturbation to the time when the propagating perturbation fades and merges into the quiescent jet emission. At present, it may be difficult to define this important time scale observationally. The time scale can be thought of as the duration of one complete “activity cycle,” which we propose to define as the characteristic time interval between two successive events marking onsets of phases of activity. With this definition, for example, a blazar that showed a pattern of being active for five years, then quiescent for ten years, then active five years, and so forth, would have yrs. If the time scale for activity exceeds the time scale for the jet’s evolution (), two subsequent activity cycles should be easily distinguishable; otherwise, manifestations of core activity and jet evolution associated with different cycles can be superimposed and complicate the observed picture. It should also be borne in mind that the observed may be affected by the source’s redshift, while the observed may be affected by both the redshift and the Doppler factor of the jet (for more detail, see the discussion in Lister 2001).
According to theoretical arguments (Marscher 1996; Gomez et al. 1997), a shock induced by a primary excitation at the base of the jet is initially manifest in radio light curves as an outburst that is delayed at lower frequences due to the combined effects of the frequency stratification of the emitting electrons, non-zero opacity and light-travel delays. Such time-delayed outbursts are associated observationally on milliarcsecond (mas) scales with brightening of the VLBI core, and can be considered “core” outbursts. The propagation of the shock downstream in the jet is revealed via the emergence of a new optically thin jet component (or components) in the VLBI image, sometimes accompanied by “jet” outbursts, which evolve nearly synchronously at all frequencies in the radio light curve. The integrated monitoring data support the division of observed outbursts into such core and jet outbursts, at least in some sources (0202+149, Pyatunina et al. 2000; 0420–014 Zhou et al. 2000; 0059+581, Pyatunina et al. 2003). Thus, in practice, it is reasonable to approximate the duration of an activity cycle as the time interval between two successive “core” outbursts. The questions of how this interval varies from source to source and how stable it is for a particular source may be keys for our understanding of the activity’s grand design.
The majority of blazars do not seem to display a well-defined activity cycle and associated time scale , due in part to incompleteness of their monitoring data over sufficiently long time scales (decades) and in part due to the complexity or nature of the underlying physical processes giving rise to the variability (see, e.g., Lister 2001). In addition, the clarity with which an activity cycle in a given source is manifest may be very different at different frequencies, especially if they are fairly widely spaced. Combined analyses of multi-epoch VLBI observations and multi-frequency light curves for those cases when a reasonably well-defined cycle can be identified across a range of frequencies show that the duration of the activity cycle can vary from source to source over a wide range: yr for 0059+581 (z=0.643, Pyatunina et al. 2003), yr for 0735+178 (z=0.424, Carswell et al. 1974; Agudo et al. 2002) and yr for 1308+326 (z=0.996, Hewitt et al. 2003; Pyatunina et al. 2004). As has been noted above, the question of the stability of the activity time scale, or of the quasi-periodicity of the activity, in a particular source is more complex, not only because the relevant time scales can be rather long, but also due to several other important factors. It has been suggested that a supermassive binary black hole in the nucleus of the AGN may be responsible for both the existence of quasi-periodicity (Lehto & Valtonen 1996; Valtaoja et al. 2000) and the activity itself (Sillanpää 1999), as well as for structural changes on parsec scales (Lobanov & Roland 2002). In this picture, activity can be triggered by the periodic tidal perturbation of the primary black hole’s accretion disk by the orbital motion of a secondary black hole or the secondary’s accretion disk. The eccentricity of the orbit (Lehto & Valtonen 1996; Sundelius et al. 1997) may divide the overall period in two unequal parts, while precession of the jet may change the viewing angle, resulting in modulation of the amplitudes of outbursts. Relativistic precession of the secondary’s orbit will complicate the observed variability even more.

In our approach, we carry out a joint analysis of the total-flux and spectral variability based on multi-frequency light curves, combined with the observed structural changes in VLBI images. This paper presents our results for a first small sample of four selected sources. The frequency-dependent time delays found here can also be used to test models of the nonthermal emission in blazars (Gomez et al. 1997; Lobanov 1998; Marscher 2001).
2 Description of the Data Used
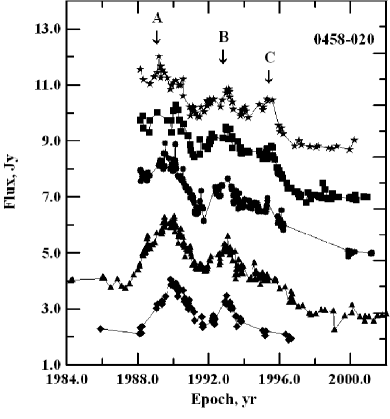
The combined data from the University of Michigan Radio Astronomy Observatory (UMRAO; Aller et al. 1985) and Metsähovi Radio Observatory (Teräsranta et al. 1998, 2004, 2005) provide us with radio light curves for AGN from 4.8 to 37 GHz covering time intervals up to years. A preliminary inspection of all available light curves shows that only about one-third display well separated, bright outbursts with definite frequency-dependent time delays that are suitable for analysis. As a first sample, we chose the four -ray blazars 0458–020, 0528+134, 1730–130 and 2230+114, for which multi-epoch VLBI data are also available (Jorstad et al. 2001). The multi-frequency light curves for these sources are shown in Figs. 2, 4, 7 and 9. In all figures except for Fig. 7 (right) and 12, filled symbols correspond to integrated measurements and hollow symbols to VLBI measurements; integrated measurements at 4.8 GHz are shown by diamonds, at 8 GHz by triangles, at 14.5 GHz by circles, at 22 GHz by squares, at 37 GHz by stars and at 90 GHz by pluses.
We separated the most prominent outbursts in the radio light curves into individual components using Gaussian model fitting. We chose to fit Gaussian components for the simple reason that most of the observed centimetre-wavelength outbursts are symmetrical and have shapes that are approximately Gaussian; in particular, the shapes of the centimetre-wavelength outbursts do not correspond well to the exponential profiles used, e.g., by Valtaoja et al. (1999) to fit millimetre flares. The highest of the five frequencies for which we obtained light-curve decompositions is 37 GHz, while the exponential behaviour pointed out by Valtaoja et al. (1999) is manifest at frequencies of 90 and 230 GHz.
Long-term trends in the total flux-density variations described using polynomial approximations for the deepest minima in the light curves were subtracted before the fitting. An example result of the long-term trend determination and Gaussian decomposition is shown in Fig. 1. This example illustrates the general criterion that the smallest number of Gaussians providing a complete description of the light curve was used. The number of Gaussians used depended on the time interval covered by the light curve and the characteristic time scale for the source variability.
The light curves of the sources considered here could all be decomposed into Gaussian components with goodness of fit satifying the test at a significance level of 0.01. The frequency-dependent time delays for individual components, , where is the highest frequency observed, were determined and approximated by exponential functions of frequency of the form (Gomez et al. 1997; Lobanov 1998). The results of these approximations are summarized in Table 6.
The individual parameters of the outbursts as derived from the Gaussian model fitting are given in Tables 1, 2, 3 and 5, whose columns present (1) the component notation, (2) the observing frequency, (3) the epoch of the maximum flux, (4) the maximum amplitude, (5) the full-width at half maximum of the Gaussian describing the outburst and (6) the time delay for the given frequency; when the formal errors on the epoch of maximum, Gaussian width and time delay were occasionally smaller than 0.01 yr, we set these errors equal to 0.01 yr, Essentially all the Gaussian components fit are included in these tables; the exception is that the Gaussians fit for the light curve of 1730-130 prior to were not included, since they all displayed very small frequency delays and small amplitudes compared to the powerful outburst of 1996.
3 0458-020,
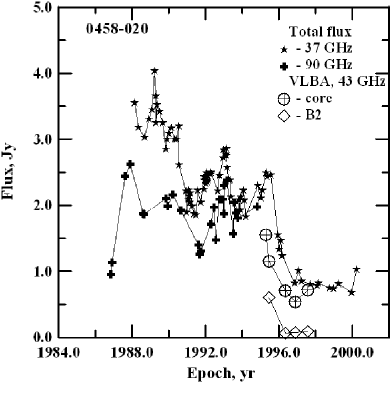
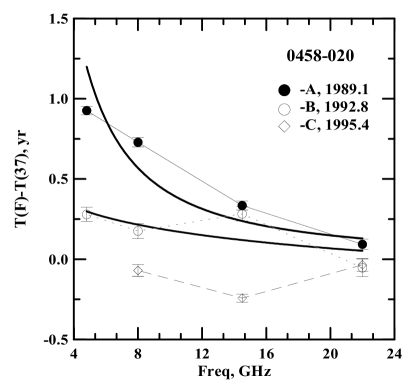
The radio light curve of this distant quasar displays three distinct outbursts with declining amplitudes at epochs 1989.1, 1992.8 and 1995.4 in the period 1984–2002, which we label A, B and C, respectively (Fig. 2, left). A comparison of the 37 GHz light curve and the combined 90 GHz light curve based on the data of Steppe et al. (1988, 1992, 1993) and Reuter et al. (1997) indicates that at least outburst A (1989.06) may have some fine structure that is unresolved in the available data (Fig. 2, right). The individual parameters of the outbursts as derived from the Gaussian model fitting are given in Table 1, and the time delays for these outbursts as functions of frequency are shown in Fig. 3. Only outburst A displays frequency-dependent time delays, and may be associated with a strong primary perturbation in the core. Outbursts B (1992.81) and C (1995.40) show no time delays, and can accordingly be considered jet outbursts. The evolution of the source’s structure at 43 GHz (Jorstad et al. 2001) shows the appearance of the new jet component B2 during 1995–1998. The variations of the 43 GHz flux densities of the core and B2 shown in Fig. 2 (right) are consistent with the classification of outburst C as a jet outburst.
| Comp. | Freq. | Amplitude | Time delay | ||
|---|---|---|---|---|---|
| GHz | yr | Jy | yr | yr | |
| A | 37 | 1989.060.02 | 2.5890.038 | 2.650.07 | 0 |
| 22 | 1989.160.02 | 3.2920.074 | 2.820.08 | 0.090.03 | |
| 14.5 | 1989.400.02 | 3.0660.013 | 3.650.03 | 0.340.03 | |
| 8 | 1989.790.02 | 2.4650.010 | 2.830.02 | 0.730.03 | |
| 4.8 | 1989.990.01 | 2.4900.007 | 3.020.01 | 0.930.03 | |
| B | 37 | 1992.810.04 | 1.7000.034 | 3.230.15 | 0 |
| 22 | 1992.760.03 | 2.3780.053 | 2.950.16 | -0.050.05 | |
| 14.5 | 1993.090.01 | 2.2250.018 | 1.540.02 | 0.280.05 | |
| 8 | 1992.990.01 | 1.8410.012 | 1.730.02 | 0.180.05 | |
| 4.8 | 1993.090.01 | 1.7800.013 | 1.570.01 | 0.280.04 | |
| C | 37 | 1995.410.02 | 1.2950.054 | 1.110.06 | 0 |
| 22 | 1995.370.04 | 1.2720.028 | 1.660.05 | -0.040.04 | |
| 14.5 | 1995.170.02 | 1.6390.012 | 1.940.02 | -0.240.02 | |
| 8 | 1995.340.03 | 1.1340.013 | 2.380.04 | -0.070.04 |
Unfortunately, we have no high-resolution VLBI images for the period prior to 1995, and our classification of outbursts A (a core outburst) and B (a jet outburst) cannot be confirmed by direct investigation of the structural evolution. The only candidate for a jet component that could be associated with outburst B is the component B1 detected in 43 GHz maps at epochs 1995.31 and 1995.47. The radial distance of this component from the core is about 0.8 mas. If the rates of angular separation from the core for components B1 and B2 are similar, the zero-separation time for component B1 is near 1990. Therefore, there is some possibility that the emergence and evolution of this component can be linked to outburst B.
We cannot identify the overall duration of the activity cycle in this source because the available monitoring data spanning 16 years include only one core outburst, and it is precisely the time interval between core outbursts that determines . The only thing we can do at this stage is to give a lower limit for the total duration of each activity cycle, yr, and to suggest that it appears that the activity cycles in 0458-020 include a core outburst (as in 1989.06) followed by at least two jet outbursts (as in 1992.81 and 1995.41).
It is interesting that a comparison of the 15 GHz maps from the MOJAVE database (Lister & Homan 2005) for epochs 15 March, 2001 and 1 March, 2003 shows an increase in the peak flux between these two epochs, from 0.76 to 1.045 Jy. This brightening of the core could be an indication of the beginning of a new activity cycle in this source. Support for the onset of a new activity cycle can also be found in the 43 GHz maps from the Radio Reference Frame Image Database (RRFID; http://rorf/usno.navy.mil/rrfid.shtml). The peak flux density in the 43 GHz map for 13 September, 2003 exceeds the peak flux density in the map for 26 December, 2002 by more than a factor of two ( Jy/beam as opposed to Jy/beam).
If our lower limit for the characteristic durations of activity cycles in 0458–020 is correct, the maximum of the previous cycle should have been sometime before 1973. Early monitoring data at 7.9 GHz (Dent and Kapitzky 1976) covering the time interval 1971–1974.5 display a moderate outburst with its maximum flux, Jy, occurring near 1973. Some indications of activity during the interval 1968–1979 can be found in the 5 GHz monitoring data of Wright (1984) as well. These data show that 0458–020 was variable during this period, with a mean flux of Jy and an rms dispersion of 14%. For comparison, the dispersion for the quasar 3C454.3, which displays a strong outburst during this period (UMRAO data), was estimated to be 34%. Thus, it seems probable that 0458–020 was active during this period, although the level of activity was probably not as strong as during the activity cycle observed in roughly 1986–2002.
4 0528+134,
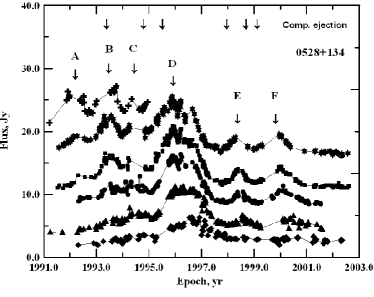
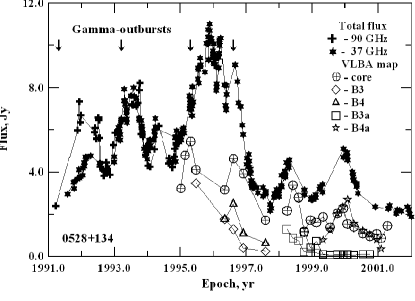
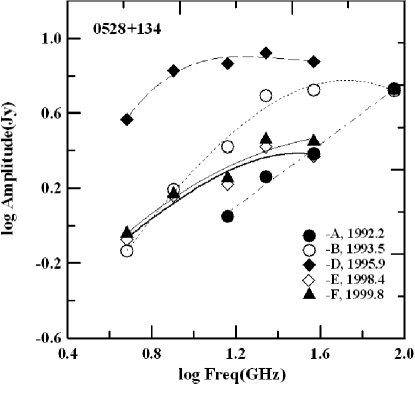
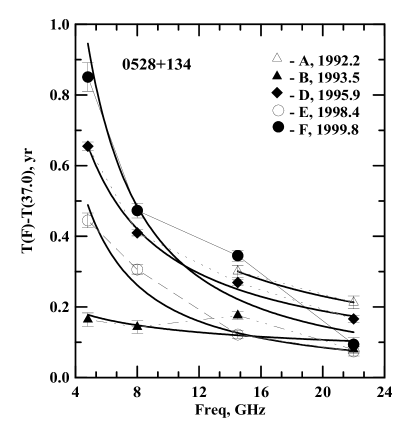
The radio light curve of this quasar did not display bright events until 1990, when a strong and complex outburst started. The outburst displays at least six narrow components (Fig. 4, left), whose parameters based on the Gaussian model fitting are given in Table 2. The 37 GHz light curve shows the possible existence of additional fine structure in outburst D that is unresolved by the Gaussian model fitting. As was shown by Zhang et al. (1994), the spectrum of 0528+134 changed dramatically at the end of the 1980s, when its turnover frequency moved from near 8 GHz to near 100 GHz. A comparison of the 37 GHz (Metsähovi) and 90 GHz light curves (see references above and Krichbaum et al. 1997) shows the spectral evolution during this period. The amplitudes of individual outbursts as functions of frequency in Fig. 5 show a shift of the turnover frequency in time, from above 90 GHz (A) to GHz (D). In addition, there is a sudden decrease in the amplitudes of outbursts E and F compared to the earlier outbursts. The quasar 0528+134 is one of the brightest -ray sources. The dates of four EGRET flares with fluxes photcmsec-1 detected during 1991–1997 (Mukherjee et al. 1999) are shown by the arrows in Fig. 4 (right). The brightest flare (March 23–29, 1993; ) coincides with outburst B, while the brightest radio outburst (D) seems to be associated with a moderate, prolonged -ray flare observed from April 4 to June 6, 1995 and a moderate flare detected in August 20–27, 1996. It is interesting that the brightest -ray flare coincides with the brightest 90 GHz outburst, B, but precedes the maximum of the brightest outburst at 37 GHz. The spectral evolution combined with the -ray emission suggest that probably not all the peaks observed in the 0528+134 light curves represent individual outbursts, but are instead made up of a series of finer sub-outbursts that combine to form what appears to be a single complex observed outburst. The parameters of the Gaussian components fit at 90 GHz are very uncertain due to the relatively poor sampling, and we adopt 37 GHz as a reference frequency for determining the time delays. The delay between 90 and 37 GHz averaged over sub-outbursts A, B and C is . The frequency-dependent time delays for the sub-outbursts are shown in Fig. 6. The time delays for the first sub-outburst, A (), are determined only at GHz, since these flares did not appear at the longer wavelengths. The time delays at cm wavelengths are very small, even for sub-outburst B (Fig. 6). Unfortunately, sub-outburst C () coincides with a gap in the Metsähovi data, and the time delays given in Table 2 should be considered tentative. The time delays of the later sub-outbursts D, E and F vary over approximately a factor of two, from 0.444 to 0.850 yr.
High-frequency (22–86 GHz) VLBI monitoring during 1992–1997 (Zhang et al. 1994; Pohl et al. 1995; Krichbaum et al. 1995, 1997) has revealed the appearance of five new jet components, which appear to be associated with sub-outbursts A (component N1, Krichbaum et al. 1995), B (component N2, Krichbaum et al. 1995), C (component N3, Krichbaum et al. 1997) and D (components N4 and N5, Krichbaum et al. 1997). The multi-epoch imaging at 43 GHz of Jorstad et al. (2001, 2005) confirms the emergence of jet components associated with sub-outbursts B (component B2), C (component B3) and D (component B4), and has also revealed two new jet components (B3a and B4a) associated with sub-outbursts E and F. Thus, in contrast to the situation with the outbursts in 0458–020, sub-outbursts A, B, C, D, E and F all show signatures of both “core” outbursts (frequency-dependent time delays) and “jet” outbursts (association with the appearance of new superluminal components). The time variations of the flux densities of the core and individual jet components according to the data Jorstad et al. (2001, 2005) are shown in Fig. 4 (right).
| Comp. | Freq. | Amplitude | Time delay | ||
|---|---|---|---|---|---|
| (GHz) | (yr) | (Jy) | (yr) | (yr) | |
| A | 90 | 1992.150.02 | 5.100.26 | 0.800.02 | -0.060.02 |
| 37 | 1992.210.01 | 2.4150.042 | 0.930.02 | 0 | |
| 22 | 1992.420.01 | 1.830.17 | 0.620.04 | 0.210.02 | |
| 14.5 | 1992.510.01 | 1.1240.043 | 0.630.06 | 0.300.02 | |
| B | 90 | 1993.510.01 | 5.120.11 | 0.900.01 | 0.030.02 |
| 37 | 1993.480.01 | 5.3100.050 | 0.970.01 | 0 | |
| 22 | 1993.560.01 | 4.9270.062 | 0.960.02 | 0.080.01 | |
| 14.5 | 1993.650.01 | 2.6340.025 | 1.250.04 | 0.180.01 | |
| 8 | 1993.620.02 | 1.5640.021 | 1.550.07 | 0.140.02 | |
| 4.8 | 1993.640.02 | 0.7360.012 | 0.800.02 | 0.160.02 | |
| C | 90 | 1994.450.02 | 4.030.68 | 0.400.03 | 0.010.18 |
| 37 | 1994.440.01 | 4.130.25 | 0.480.01 | 0 | |
| 22 | 1994.470.01 | 5.010.19 | 0.410.01 | 0.030.01 | |
| 14.5 | 1994.520.01 | 2.3110.031 | 0.640.01 | 0.080.01 | |
| 8 | 1994.520.01 | 1.9210.040 | 0.590.01 | 0.070.01 | |
| 4.8 | 1994.550.01 | 1.3290.023 | 0.690.01 | 0.110.01 | |
| D | 37 | 1995.920.01 | 7.4900.032 | 1.760.01 | 0 |
| 22 | 1996.090.01 | 8.3850.023 | 1.810.01 | 0.160.01 | |
| 14.5 | 1996.190.01 | 7.3270.021 | 1.560.01 | 0.270.01 | |
| 8 | 1996.330.01 | 6.7250.017 | 1.900.01 | 0.410.01 | |
| 4.8 | 1996.580.01 | 3.6940.013 | 1.970.01 | 0.650.01 | |
| E | 37 | 1998.370.01 | 2.3380.073 | 0.620.01 | 0 |
| 22 | 1998.440.01 | 2.6260.040 | 0.570.01 | 0.070.01 | |
| 14.5 | 1998.490.01 | 1.6610.025 | 0.440.01 | 0.120.01 | |
| 8 | 1998.670.01 | 1.4410.020 | 0.770.01 | 0.300.01 | |
| 4.8 | 1998.810.02 | 0.8440.024 | 0.960.04 | 0.440.02 | |
| F | 37 | 1999.820.01 | 2.8010.076 | 1.030.02 | 0 |
| 22 | 1999.910.01 | 2.8740.031 | 1.090.01 | 0.090.02 | |
| 14.5 | 2000.160.01 | 1.7880.012 | 0.930.01 | 0.340.02 | |
| 8 | 2000.290.02 | 1.4740.012 | 1.360.02 | 0.470.02 | |
| 4.8 | 2000.670.04 | 0.9050.011 | 2.040.04 | 0.850.04 |

As we noted above, this outburst is the brightest event in this object since 1976. However, low-amplitude flux-density variations were also observed at cm wavelengths during the period of low activity (1977–1991). Analysis of 8 GHz geodetic VLBI observations over nearly eight years from 1986.25 to 1994.07 made by Britzen et al. (1999b) has revealed, apart from the component N2 mentioned above (Krichbaum et al. 1997, component a in the notation of Britzen et al.), several superluminal jet components ejected prior to 1990. It is interesting that the position angles of the previously ejected components c (, ) and d (, ) differ significantly from the position angle of component a (, ) (Britzen et al 1999b). Thus, it seems that we can identify different light curves for 0528+134 for two different periods characterized by low (1977–1991) and high (1991–2004) activity. The difference between the observed levels of activity during these two periods could be due to variations of the jet’s orientation (Zhang et al. 1994) or some other reasons internal to the source. It is interesting that the fine structure of the 8 GHz outburst seems to be less prominent during the low-activity period. The low level of activity and absence of high-frequency monitoring data hinder the detection and comparison of fine structure of the outbursts observed in the period of high and low activity. We estimate the characteristic duration of one activity cycle in the source to be yr. Component b (Britzen et al. 1999b), which was ejected during the period of low activity () in , does not fit into the picture we have outlined. Further high-frequency single-dish and/or VLBI observations are necessary to test our proposed picture.
5 1730-130 (NRAO 530),
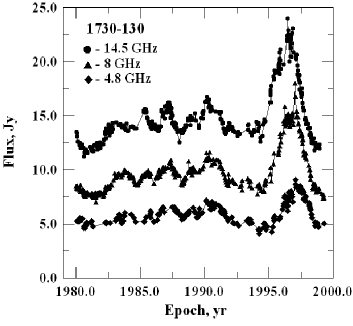
This quasar has displayed a single bright outburst in 35 years of cm-wavelength monitoring from 1967 to 2003 (Fig. 7, left), first detected as an extremely narrow and bright flare at 230 GHz (Bower et al. 1997). The combined 90 GHz and 230 GHz monitoring data (Steppe et al.1993; Reuter et al. 1997) reveal two fainter outbursts near 1993 and 1994.5, which probably precede the 230 GHz flare (Fig. 7, right) detected by Bower et al. (1997). All of the outbursts coincide with epochs when -ray flares with fluxes photcmsec-1 were detected, marked in the figure by arrows (Mukherjee et al. 1997). The brightest -ray flare () occurs slightly after the main 230 GHz outburst, but precedes the main maximum at mm wavelengths. Comparison of the 90 and 37 GHz light curves reveals some traces of fine structure, at least at high frequencies. The parameters of the outburst are given in Table 3, and the time delays as functions of frequency are shown in Fig. 8.
86 GHz VLBI maps obtained at epochs (Lobanov et al. 2000) and 1995.35 (Bower et al. 1997) show the core and two jet components that could have been ejected during the 1993 and 1994.5 outbursts, but we do not have enough information to be sure about this. 43 GHz VLBA imaging (Jorstad et al. 2001) shows faint traces of a component that was probably ejected prior to 1995 (B1, ) and a new component that was apparently ejected during the bright outburst (B2, ). The variations of the flux densities of the core and the new component B2 are shown in Fig. 7 (right). Thus, the outburst exhibits signs of both core and jet outbursts, like the outbursts observed in 0528+134.

| Comp. | Freq. | Amplitude | Time delay | ||
|---|---|---|---|---|---|
| (GHz) | (yr) | (Jy) | (yr) | (yr) | |
| A | 37 | 1996.260.01 | 12.220.22 | 2.000.03 | 0 |
| 22 | 1996.300.02 | 11.280.17 | 2.110.03 | 0.040.02 | |
| 14.5 | 1996.370.01 | 10.1390.031 | 2.090.01 | 0.110.01 | |
| 8 | 1996.780.01 | 7.0910.020 | 2.030.01 | 0.530.01 | |
| 4.8 | 1997.190.01 | 3.3790.017 | 2.020.02 | 0.930.02 |
If we consider the 1993 and 1994.5 outbursts to be precursors of the main outburst in 1996, the total duration of the activity cycle of the source may correspond to the time interval from 1992 until 2001, when the 22 and 37 GHz fluxes began to grow again: yr. In this case, the previous core outburst would have peaked in 1987, and the UMRAO monitoring data (Fig. 7, left) do show a modest outburst at that epoch that seems to peak earliest at 14.5 GHz and latest at 4.8 GHz (i.e., consistent with a core outburst). Some further support for this estimate for is provided in the MOJAVE (15 GHz, Lister & Homan 2005) and RRFID (24 and 43 GHz, Fey et al. 2004) databases. The 15 GHz VLBI maps show that both the total and peak flux densities grew by more than a factor of two between January 11, 2000 and October 9, 2002, testifying to the onset of a new outburst. The 15-GHz peak flux densities for October 9, 2002, February 11, 2004, March 23, 2005 and July 24, 2005 are 4.74, 3.33, 2.83 and 2.30 Jy/beam, respectively. This sequence can be supplemented with the peak flux densities in the 24 GHz VLBI images reduced to the beam size for the May 23, 2003 15-GHz observations: 3.7, 3.8 and 2.9 Jy/beam for May 16, 2002, August 26, 2002 and May 23, 2003. Overall, these data clearly indicate a strong outburst in the VLBI core that seems to have peaked in . The decrease in the peak flux densities at later epochs does not seem to be accompanied by the appearance of any new structure, although there are clear changes in the polarization of the core region between the first two 15-GHz epochs, overall suggesting that the 2002–2003 outburst may have been confined to the core. It is possible that the 1996 outburst and 2002–2003 outburst are associated with successive activity cycles in the source; if the 2002–2003 outburst is a “precursor” to a main core outburst occuring in 2005, this could be consistent with our estimated cycle duration yr (recall that the “precursor” outbursts for the major 1996 outburst occured in 1993–1994), but further information about the spectrum of the 2002–2003 outburst and further VLBI monitoring are needed to test this hypothesis.
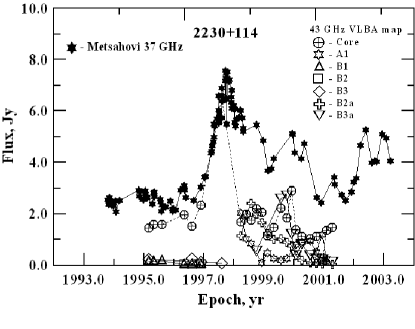
6 2230+114 (CTA 102),
| Freq | Cycle 1 | Cycle 2 | Cycle 3 | P(2-1) | P(3-2) | |||
|---|---|---|---|---|---|---|---|---|
| Comp. | Comp. | Comp. | ||||||
| 37 | A2 | 1989.57 | A3 | 1997.48 | 7.91 | |||
| 22 | A2 | 1989.67 | A3 | 1997.90 | 8.22 | |||
| 14.5 | A1 | 1981.36 | A2 | 1989.74 | A3 | 1998.00 | 8.39 | 8.25 |
| 8 | A1 | 1981.40 | A2 | 1989.95 | A3 | 1998.34 | 8.55 | 8.39 |
| 37 | B2 | 1990.50 | B3 | 1997.92 | 7.42 | |||
| 22 | B2 | 1990.54 | B3 | 1998.57 | 8.02 | |||
| 14.5 | B1 | 1982.71 | B2 | 1990.63 | B3 | 1998.62 | 7.92 | 7.98 |
| 8 | B1 | 1982.94 | B2 | 1990.84 | B3 | 1999.09 | 7.89 | 8.25 |
| 37 | C2 | 1991.38 | 3 | 1998.86 | 7.48 | |||
| 22 | C2 | 1991.38 | C3 | 1999.02 | 7.64 | |||
| 37 | D2 | 1992.10 | D3 | 2000.01 | 7.91 | |||
| 22 | D2 | 1992.09 | D3 | 1999.84 | 7.76 | |||
| 14.5 | C1+D1 | 1983.68 | C2+D2 | 1991.98 | C3+D3 | 1999.75 | 8.3 | 7.76 |
| 8 | C1+D1 | 1983.97 | C2+D2 | 1991.71 | C3+D3 | 2000.03 | 7.74 | 8.32 |
| 4.8 | C1+D1 | 1984.08 | C2+D2 | 1992.25 | 8.17 | |||
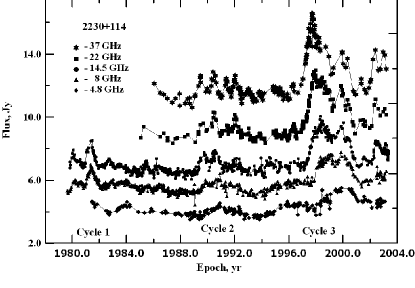
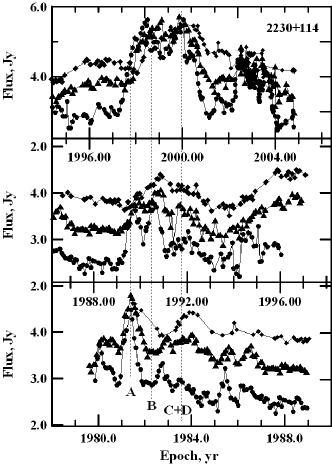
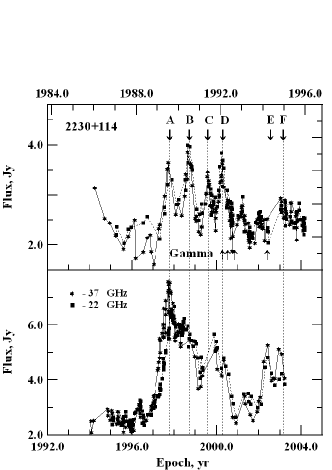
Radio light curves of this quasar display strong outbursts that repeat approximately every 8 years (Fig. 9). At mm wavelengths, the outbursts can be decomposed into the six narrow sub-outbursts A, B, C, D, E and F (Fig. 9, below right); only the two leading sub-outbursts A and B can be distinguished at cm wavelengths, while the other sub-outbursts merge into two broad features (C+D and E+F; Fig. 9, below left).
To test whether there is quasi-periodicity in the appearance of the outbursts, we subtracted the epochs for corresponding sub-outbursts in consecutive cycles at all available wavelengths (Table 4). The mean time intervals between the peaks of consecutive corresponding sub-outbursts are for the interval from cycle 2 to cycle 1 and for the interval from cycle 3 to cycle 2. Given the time delays between the various frequencies and the possible dependence of these time delays on the amplitudes of individual sub-outbursts (see below), the agreement between these two mean values is good. Therefore, we tentatively suggest that outbursts in this source repeat every years, preserving the relative positions in time of individual sub-outbursts within the outbursts, even when the amplitudes of the sub-outbursts change substantially.
In this case, we expect that the leading sub-outburst of the next outburst reached its maximum at 37 GHz near , and its maximum at GHz near . The MOJAVE VLBI images clearly indicate an outburst in the VLBI core starting sometime in the second half of 2004: the observed peak flux densities for successive epochs are 1.05 (April 10, 2004), 1.87 (February 5, 2005), 2.00 (September 19, 2005), 3.94 (December 22, 2005) and 4.40 Jy/beam (February 12, 2006). This may well represented the predicted leading sub-outburst of the next outburst cycle, but further VLBI and integrated monitoring data are needed to determine the epoch of the maximum flux and the spectrum of this outburst. The leading 8 GHz maximum of the outburst that took place prior to 1981 should have occured near 1973.5. However, 8 GHz monitoring data (Dent & Kapitzki 1976) show only slow flux variations with an amplitude of Jy during 1970.5–1974.5. If our hypothesis of quasi-periodicity in the activity of the source is correct, then the weak activity observed during the 1970s testifies that the activity as a whole is strongly modulated in amplitude by some geometric effect (e.g. variation of the viewing angle) or some intrinsic reason.
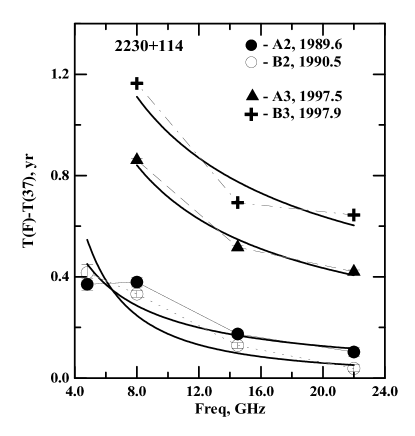
Owing to the merging of sub-outbursts C, D and E, F at cm wavelengths, time lags were determined only for the two main sub-outbursts A and B (Table 5, Fig. 9). 2230+114 is the only source for which we were able to analyze outbursts that may belong to different activity cycles. The time lags for the two periods of activity are correlated with the corresponding outburst amplitudes: sub-outbursts A and B of the brightest outburst, with its maximum near 1997.5, show greater time lags than sub-outbursts A and B of the more modest outburst with its maximum near 1989.6 (see below).
Four moderate -ray flares (photcmsec-1) detected during 1992–1994 coincide with sub-outbursts D2 and E2 (Fig. 9, below right). Unfortunately we have no high resolution VLBI data for epochs prior to 1995. Multi-epoch 43-GHz VLBA observations (Jorstad 2001, 2005) covering the time interval from 1995 to 2001 reveal three faint ( Jy) superluminal components, which could have been ejected during the final stage of cycle 2 (B1, ; B2, ; B3, ), as well as the two superluminal components B2a and B3a, which seem to be associated with sub-outbursts B3 and C3. The variations of the flux densities of the core and new-born jet components are shown in Fig. 11. The frequency-dependent-delay sub-outburst A can be classified as a “core” outburst, and is associated with brightening of the core. Sub-outburst B is a mixed outburst, which displays low-frequency delays but is also associated with the appearance of new superluminal components.
| Comp. | Freq. | Amplitude | Time delay | ||
|---|---|---|---|---|---|
| GHz | yr | Jy | yr | yr | |
| A2 | 37 | 1989.570.01 | 1.6490.050 | 0.740.03 | 0 |
| 22 | 1989.670.02 | 1.210.11 | 0.680.08 | 0.100.02 | |
| 14.5 | 1989.740.01 | 1.3280.026 | 0.700.03 | 0.170.01 | |
| 8 | 1989.950.02 | 0.7300.024 | 0.800.04 | 0.380.02 | |
| 4.8 | 1989.940.02 | 0.3180.040 | 0.400.19 | 0.370.02 | |
| A3 | 37 | 1997.480.01 | 3.6560.058 | 0.570.08 | 0 |
| 22 | 1997.900.01 | 3.8310.030 | 0.830.03 | 0.420.01 | |
| 14.5 | 1998.000.01 | 2.2840.024 | 0.900.02 | 0.520.01 | |
| 8 | 1998.340.01 | 1.4110.023 | 0.670.05 | 0.860.01 | |
| B2 | 37 | 1990.500.01 | 1.7360.050 | 0.550.02 | 0 |
| 22 | 1990.540.01 | 1.590.10 | 0.620.05 | 0.040.01 | |
| 14.5 | 1990.630.01 | 1.4180.027 | 0.660.02 | 0.130.01 | |
| 8 | 1990.840.01 | 0.9650.021 | 0.710.03 | 0.330.01 | |
| 4.8 | 1990.920.03 | 0.7020.014 | 1.340.08 | 0.420.03 | |
| B3 | 37 | 1997.920.01 | 3.6300.059 | 0.550.03 | 0 |
| 22 | 1998.570.01 | 2.830.11 | 0.480.06 | 0.640.01 | |
| 14.5 | 1998.620.01 | 2.1090.018 | 0.660.02 | 0.690.01 | |
| 8 | 1999.090.01 | 1.7660.026 | 0.690.02 | 1.160.01 |
7 Discussion
7.1 Types of outbursts
Analysis of the outbursts combined with the detailed structural evolution at 43 GHz shows that only one of the outbursts can be classified as a pure core (2230+114, A) and one as a pure jet (0458-020, C) outburst in terms of both their time delays and their association with core or jet brightening. Most outbursts are mixed, in the sense that they display both frequency-dependent time lags and a connection with the appearance of new jet components. Note that previous classifications of outbursts (Pyatunina et al. 2000; Zhou et al. 2000) were based on low frequency (5 and 8 GHz) VLBI observations. However, a jet component resolved at 43 GHz would be merged with the core at lower frequencies, so that an outburst classified as a core type at low frequency might be identified as a mixed type at high frequencies. This illustrates the importance of high frequency VLBI data for probing the early stages of activity within the jet.
It seems likely that the pure core and mixed core–jet outbursts represent fundamentally the same phenomenon: activity in the core that gives rise to the ejection of material along the jet. In this case, the brightness of the ejected material associated with the pure core outburst A in 2230+114 faded before becoming distinct from the observed core at 43 GHz. It is easy to understand the larger number of pure core outbursts at lower frequencies as well: with the lower resolution available, the ejected components are more likely to have faded beyond detection by the time they become distinct from the core. The relatively small number of pure jet outbursts then represent brightening of an optically thin region of the jet well after its ejection from the core, e.g., due to the formation of shocks.
7.2 Fine structure of outbursts
Some traces of fine structure can be found in all of the outbursts, at least at the highest frequencies. In some of the sources, the fine structure dominates, splitting outbursts into distinct sub-outbursts (0528+134, 2230+114), while in others (0458-020 and 1730-130), it degenerates into small fluctuations of the fluxes. Note that the appearance of fine structure in light curves is independent of resolution, but can be hidden due to high optical depth. Savolainen et al. (2002) suggested that outburst fine structure can be induced by shocks that grow and decay in the innermost few tenths of a milliarcsecond. According to theoretical simulations, shocks can be generated by several mechanisms: (a) multiple recollimation shocks, which are induced by the pressure mismatch between the jet and surrounding medium (Gomez et al. 1997, 2003); (b) interactions between helical instability modes that grow due to perturbations to the jet by jet–cloud collisions or precession, with elliptical (Lobanov, Hardee & Eilek 2003) or body waves (Hardee et al. 2001) growing into the jet; and (c) interactions of the jet with obstacles in its path. The preservation of the positions of individual sub-outbursts in outbursts belonging to different activity cycles in 2230+114 may provide important information for distinguishing between these mechanisms. However, it is necessary to carry out similar analyses for more sources, in order to investigate whether this property is common or peculiar to this source.
The presence of fine structure in the outbursts can significantly complicate the identification of a “starting point” of the activity. Strictly speaking, only information about flux variations at frequencies above GHz in combination with 43 GHz VLBI data can address this problem.
7.3 Time delay as a function of frequency
The parameters of the time-delay function for all events defined for at least four frequencies are given in Table 6. According to theoretical estimates (Gomez et al. 1993, 1997), the position of the core is expected to depend on the frequency as . The frequency-dependent shift of the core position in 3C345 estimated by Lobanov (1998) turned out to be close to the theorical expectation . If the flow velocity is independent of frequency, then the time delay is expected to behave similarly. The indices of the time-delay functions given in Table 6 vary from –0.6 (0528+134, B3) to –2.2 (1730–130) with the mean value . The time-delay functions for individual events (Figs. 3, 6, 8 and 10) show significant dispersions for the time delays at separate frequencies. If we restrict our consideration to the approximating functions with the smallest residuals (0528+134 – D, E; 2230+114 – A3, B3), the corresponding mean value is . Both the “pessimistic” and “optimistic” estimates for the mean time-lag index are consistent with the expected value of –0.8, taking into account the fairly large errors. The only exception might be the index for 1730–130.
| Source | Comp. | (37GHz) | |
|---|---|---|---|
| 0458-020 | A | 1989.1 | -1.46 |
| 0528+134 | D | 1995.9 | -0.87 |
| 0528+134 | E | 1998.4 | -1.22 |
| 0528+134 | F | 1999.8 | -1.31 |
| 1730-130 | A | 1996.3 | -2.16 |
| 2230+114 | A2 | 1989.6 | -0.89 |
| 2230+114 | B2 | 1990.5 | -1.55 |
| 2230+114 | A3 | 1997.5 | -0.72 |
| 2230+114 | B3 | 1997.9 | -0.60 |
The shift of the core position between two frequencies is expected to depend on the luminosity of the source (Lobanov 1998):
As above, we expect a similar dependence for the time lags. The relationship between the amplitudes of the outbursts in two subsequent activity cycles in 2230+114 and their time lags is in qualitative agreement with the expectation (Fig. 10; the outbursts in cycle 3 display both higher amplitudes and larger time delays). However, the time lags for individual sub-outbursts within a single outburst do not display a similar relation with the sub-outburst amplitudes (0528+134). The time lags for the individual sub-outbursts may depend on the dynamical evolution of the underlying perturbation, rather than on their amplitude.
7.4 Outbursts and structural evolution
As was already shown by Savolainen et al. (2002), the emergences of all bright components are correlated with local maxima of the light curves. A comparison of the 37 GHz light curves with the flux densities of the cores and new superluminal components as functions of time (Figs. 2, 4, 7, 11) augments the correlation. The flux densities of both the cores and new-born jet components reach their highest values near the maxima of the 37 GHz light curves, after which they fade.


Some well studied events (Fig.12) indicate that the times when the flux densities of new-born components reach their maxima nearly coincide with the times when they experience a sudden increase in their velocity of separation from the core. A similar increase in the velocity of the superluminal component C8∗ was observed near 1998 in the quasar 3C279 (Jorstad et al. 2005); note the close coincidence of this epoch with the maximum of the brightest outburst observed in 3C279 since 1965. This suggests that the flux density may reach its maximum when a shocked region that gives birth to a new jet component becomes optically thin and enters a free-expansion regime, as has been suggested by Gomez et al. (1997) (although changes in brightness occuring simultaneously with accelerations can also result from geometric effects, such as bending of the jet toward or away from the line of sight; see, e.g., Homan et al. 2003). Another intriguing phenomenon observed in 2230+114 is the interaction of the stationary component A1 with the moving component B3, when A1 is dragged downstream by B3, then returns upstream, increasing its flux density (Gomez et al. 2001).
7.5 Conclusions
Our main results can be summarized as follows.
(1) Frequency-dependent time delays for bright outbursts in four -ray quasars have been estimated and approximated using an exponential function of frequency, . The time delays in the sources range from yr to yr. The mean value of the index of the time-delay function is , and the maximum value in terms of its magnitude is , for the source 1730–130.
(2) The observed outbursts in 0528+134 and 2230+114 reveal fine structure and consist of narrow ( year) sub-outbursts. Some traces of unresolved fine structure are also seen in 0458–020 and 1730–130. The time delays and exponential-function indices vary from one sub-outburst to another.
(3) Due to the prominent fine structure observed in some outbursts, identification of the starting point of the activity requires information about the spectral evolution at frequencies higher than 40 GHz or the structural evolution at mm wavelengths.
(4) Lower limits for the durations of the activity cycles, or activity time scales, have been estimated for 0458–020 ( yr) and 1730–130 ( yr). The results of VLBI imaging at 8 GHz (Britzen et al. 1999b) and 43 GHz (Jorstad et al. 2001, 2005) suggest that the approximate duration of the activity cycle for 0528+134 is yr. Bright outbursts in 2230+114 repeat with a quasi-period of yr. Although the amplitudes of individual sub-outbursts vary from one quasi-period to another, their positions within the overall outburst are preserved. The time lags for two adjacent periods of activity in 2230+114 suggest a correlation with outburst amplitude: the brighter outburst shows a greater time delay. The first maximum of the following bright outburst in 2230+114 is expected to be near .
(5) The maximum flux densities of new jet components often coincide with a sudden increase in their velocities from the core. This suggests that the component’s flux reaches its maximum when the shocked region that corresponds to the jet component becomes optically thin and begins to freely expand, as was suggested by Gomez et al. (1997).
8 Acknowledgements
The work was supported by the RFBR (grant 05-02-17562). UMRAO has been supported by a series of grants from the NSF and by funds from the University of Michigan. SGJ was partly supported by the National Science Foundation grant (AST 04-06865). This research has made use of the United States Naval Observatory (USNO) Radio Reference Frame Image Database (RRFID). We acknowledge also the MOJAVE and VLBA 2-cm Survey Program teams. Finally, we wish to thank the referee, Matt Lister, for his thorough reading of the manuscript and his helpful and productive comments for improving this paper.
9 References
Agudo ı., Gómez J.L., Gabuzda D.C., Alberdi A., Marscher A. P., Jorstad S. G. 2002, Proc. 6th European VLBI Network Symposium, ed. Ros, E., Porcas, R.W., Lobanov, A.P. & Zensus, J.A., p. 115
Aller H.D., Aller M.F., Latimer G.E. & Hodge P.E. 1985, ApJS, 59, 513
Aller M. 1999, in BL Lac Phenomenon, ed. L.O. Takalo & A. Sillanpää (San Francisco: ASP), ASP Conf. Ser., 159, p. 31
Bower G.C., Backer D.C., Wright M., Forster J.R., Aller H.D. & Aller M.F. 1997, ApJ, 484, 118
Britzen S., Vermeulen R.C., Taylor G.B., Readhead A.C.S., Pearson T.J., Henstock D.R. & Wilkinson P.N. 1999a, in BL Lac Phenomenon, ed. L.O. Takalo, A. Sillanpää (San Francisco: ASP), ASP Conf. Ser., 159, p. 431
Britzen S., Witzel A., Krichbaum T.P., Qian S.J. & Campbell R.M. 1999b, A&A, 341, 418
Carswell R.F., Strittmatter P.A., Williams R.D., Kinman T.D. & Serkowski K. 1974, ApJ, 190, L101
Dent W.A. & Kapitzky J.E. 1976, AJ, 81, 1053
Fey A.L., Boboltz D.A., Charlot P., Fomalont E.B., Lanyi G.E. & Zhang L. D. 2005, in Future Directions in High Resolution Astronomy: The 10th Anniversary of the VLBA, ed. J.D. Romney & M.J. Reid (San Francisco:ASP), ASP Conf. Ser., 340, p. 514
Gómez J.L., Alberdi A. & Marcaide J.M. 1993, A&A, 274, 55
Gómez J.L., Martí J.M., Marscher A.P., Ibáñez J.M. & Alberdi A. 1997, ApJ, 482, L33
Gómez J.L. 2005, in Future Directions in High Resolution Astronomy: The 10th Anniversary of the VLBA, ed. J.D. Romney & M.J. Reid (San Francisco:ASP), ASP Conf. Ser., 340, p. 13
Hardee P.E., Hughes P.A., Rosen A. & Gómez E.A. 2001, ApJ, 555, 744
Hewitt A. & Burbidge G. 1993, ApJS, 87, 451
Homan D.C., Lister M.L., Kellermann K.L., Cohen M.H., Ros E., Zensus J.A., Kadler M. & Vermeulen R.C. 2003, ApJ, 589, L9
Jorstad S.G., Marscher A.P., Mattox J.R., Aller M.F., Aller H.D., Wehrle A.E. & Bloom S.D. 2001, ApJ, 556, 738
Jorstad S.G., Marscher A.P., Lister M.L., Stirling A.M., Cawthorne T.V., Gear W.K., Gomez J.L., Stevens J.A., Smith P.S., Forster J.R. & Robson E.I. 2005, AJ, 130, 1418
Kellermann K.I., Vermeulen R.C., Zensus J. A. & Cohen M.H. 1998, AJ, 115, 1295
Kidger M.R., 2000, AJ, 119, 2053
Kranich D. 2003, in High Energy Blazar Astronomy, ed. L.O. Takalo & E. Valtaoja (San Francisco: ASP), ASP Conf. Ser., 299, p. 3
Krichbaum T.P., Britzen S., Standke K.J., Witzel A., Schalinski C.J. & Zensus J.A. 1995, Proc. Nat. Acad. Sci. USA, 92 (25), 11377
Krichbaum T.P., Witzel A., Graham D. & Lobanov A.P. 1997, in Millimeter-VLBI Science Workshop, Workshop held 22-23 November 1996 at MIT, ed. R. Barvanis, R.B. Phillips, p. 3
Lehto H.J. & Valtonen M.J. 1996, ApJ, 460, 207
Lister M. & Homan D. 2005, AJ, 130, 1389
Lobanov A.P. 1998, A&A, 330, 79
Lobanov A.P., Krichbaum T.P. & Graham D.A. 2000, A&A, 364, 391
Lobanov A.P. & Roland J. 2002, Proc. of the 6th European VLBI Network Symposium, ed. E. Ros, R.W. Porcas, A.P. Lobanov & J.A. Zensus, p. 121
Lobanov A.P., Hardee P.E. & Eilek J. 2003 NewAR, 47, 629
Marscher A.P. 1996, in Blazar Variability, ed. H.R. Miller, J.R. Webb & J.C. Noble (San Francisco, ASP), ASP Conf. Ser., 110, p. 248
Marscher A.P. 2001, in Probing the Physics of Active Galactic Nuclei by Multiwavelengths Monitoring, ed. B.M. Peterson, R.S. Polidan, R.W. Pogg (San Francisco, ASP), ASP Conf. Ser., 224, p. 23
Marscher A.P., Jorstad S.G., Mattox J.R. & Wehrle A.E. 2002, ApJ, 577, 85
Mukherjee R. et al. 1997, ApJ, 490, 116
Mukherjee R., Böttcher M., Hartman R.C., Sreekumar P., Thompson D. J., Mahoney W. A., Pursimo T., Sillanp A. & Takalo L. O. 1999, ApJ, 527, 132
Pian E. 2003, in High Energy Blazar Astronomy, ed. L.O. Takalo & E. Valtaoja (San Francisco, ASP), ASP Conf. Ser., 299, p. 37
Pursimo T. et al. 2000, A&AS, 146, 141
Pyatunina T.B., Marchenko S.G., Marscher A.P., Aller M.F., Aller H.D., Teräsranta H. & Valtaoja E. 2000, A&A, 358, 451
Pyatunina T.B., Rachimov I.A., Zborovskii A.A., Gabuzda D.C., Jorstad S.G., Teräsranta H., Aller M.F. & Aller H.D. 2003, High Energy Blazar Astronomy, ed. L.O. Takalo & E. Valtaoja, (San Francisco:ASP), ASP Conf. Ser., 299, p. 89
Raiteri C.M. et al. 2001, A&A, 377, 396
Reuter H.-P., Kramer C., Sievers A., Paubert G., Moreno R., Greve A., Leon S., Panis J.F., Ruiz-Moreno M., Ungerechts H. & Wild W. 1997, A&AS, 122, 271.
Savolainen T., Wiik K., Valtaoja E., Jorstad S.G. & Marscher A.P. 2002, A&A, 394, 851
Sillanpää A., 1999, in Observational Evidence for Black Holes in the Universe, ed. Chakrabarti (Dordrecht: Kluwer), 209
Steppe H., Salter, C.J., Chini, R., Kreysa E., Brunswig W. & Lobato Pérez J. 1988, A&AS, 75, 317.
Steppe H., Liechti S., Mauersberger R., Kömpe C., Brunswig W. & Ruiz-Moreno M., 1992, A&AS, 96, 441.
Steppe H., Paubert G., Sievers A., Reuter H.P., Greve A., Liechti S., Le Floch B., Brunswig W., Menéndez C. & Sanches S., 1993, A&AS, 102, 611.
Teräsranta H. et al. 1998, A&AS, 132, 305
Teräsranta H. et al. 2004, A&A, 427, 769
Teräsranta H., Wiren S. & Koivisto P. 2003, in High Energy Blazar Astronomy, ed. L.O. Takalo & E. Valtaoja (San Francisco, ASP), ASP Conf. Ser., 299, p. 235
Teräsranta H., Wiren S., Koivisto P., Saarinen V. & Hovatta T. 2005, A&A, 440, 409
Valtaoja E., Lähteenmäki A, Teräsranta H. & Lainela M. 1999, ApJS, 120, 95
Valtaoja E., Teräsranta H., Tornikoski M., Sillanpää A., Aller M.F., Aller H.D. & Hughes P.A. 2000, ApJ, 531, 744
Wright A.E., 1984, Proc. Austr. Astron. Soc., 5, 510
Zhang Y.F., Marscher A.P., Aller H.D., Aller M.F., Teräsranta H. & Valtaoja E. 1994, ApJ, 432, 91
Zhou J.F., Hong X.Y., Jiang D.R. & Venturi T. 2000, ApJ, 540, L13