Gas expulsion and the destruction of massive young clusters
Abstract
We examine the luminosity and dynamical mass estimates for young massive stellar clusters. For many young ( Myr) clusters, the luminosity and dynamical mass estimates differ by a significant amount. We explain this as being due to many young clusters being out of virial equilibrium (which is assumed in dynamical mass estimates) because the clusters are undergoing violent relaxation after expelling gas not used in star formation. We show that, if we assume that luminous mass estimates are correct (for a standard IMF), at least 50 per cent of young clusters for which dynamical masses are known are likely to be destroyed within a few 10s Myr of their formation. Even clusters which will retain a bound core may lose a large fraction of their stellar mass. We also show that the core radius and other structural parameters change significantly during the violent relaxation that follows gas expulsion and that they should be considered instantaneous values only, not necessarily reflecting the final state of the cluster. In particular we note that the increasing core radii observed in young LMC/SMC clusters can be well explained as an effect of rapid gas loss.
keywords:
galaxies: star clusters – stellar dynamics – methods: -body simulations1 Introduction
Almost all stars form in star clusters which have a mass function of the form (Lada & Lada 2003). This means that most clusters are fairly small ( – ), however some of the most interesting young clusters are the rare, massive ‘super star clusters’ (SSCs) with masses comparable to, or greater than, the Galactic globular clusters. SSCs are found in merging and interacting galaxies such as NGC 7252 (Miller et al. 1997) and NGC 6745 (de Grijs et al. 2003)111See Larsen (2004) for an extensive list of starburst, merger, spiral, dwarf, and irregular galaxies which contain populations of young massive clusters., as well as the LMC (Elson, Fall & Freeman 1989; Elson 1991; Mackay & Gilmore 2003), and even within our own Galaxy (esp. Wd 1, see Clark et al. 2005).
Star clusters form within giant molecular clouds and remain embedded in their natal clouds for – Myr before the combined effect of massive stellar winds and supernovae drive-out the gas not used in star formation. This gas represents % of the initial mass of the cluster and its rapid loss (on less than a crossing time, Goodwin 1997a; Melioli & de Gouveia dal Pino 2006) causes a huge change to the potential of the cluster. The stars left behind after gas expulsion violently relax to the new potential and attempt to return to virial equilibrium.
The effect of gas expulsion on the (stellar) dynamics of star clusters is well understood theoretically (e.g. Tutkov 1978; Hills 1980; Goodwin 1997a,b; Boily & Kroupa 2003a,b). The stars have too large a velocity dispersion for their new potential and the cluster expands, and stars with a velocity greater than the new escape velocity are lost. The loss of stars is not instantaneous, however, and escaping stars remain physically associated with the cluster for 10s Myr.
Recently Bastian & Goodwin (2006, hereafter BG06) have shown that a number of massive young clusters show the signature of gas expulsion: an excess of light at large radii over and above a relaxed (King or Elson-Fall-Freeman (EFF)) surface brightness profile. They note that such signatures are also seen in many young LMC clusters (see Elson et al. 1989; Elson 1991; Mackay & Gilmore 2003).
BG06 show that a consequence of gas expulsion is that many young clusters are not in virial equilibrium: thus dynamical mass estimates based on virial equilibrium may be highly inaccurate. In particular, claims of unusual IMFs based on dynamical masses being inconsistent with luminous mass estimates are probably incorrect.
In this paper we take the approach that luminosity mass estimates are correct and the discrepancy between luminosity and dynamical masses can be used as an indicator of the extent to which young clusters are out of virial equilibrium. This may then be used to estimate the star formation efficiency (SFE; see below for details) of young clusters and their survivability. Additionally, we will show that rapid gas removal can explain the trend of increasing core radii with age observed in young LMC clusters. This paper is organised as follows; in § 2 we introduce the simulations of rapid gas loss in cluster and address the caveats in the current study. In § 3 we present the results of the simulations placing particular emphasis on the dynamical state of young clusters and on the effects of “infant-weight loss” and “infant mortality”. We summarise our results in § 4.
2 Simulations
We have simulated the -body dynamics of a cluster post-gas expulsion using the GRAPE-5A special-purpose hardware at the University of Cardiff (Kawai et al. 2000) using a simple -body integrator code.
2.1 Initial conditions
Star clusters were modelled as a Plummer (1911) sphere with a density distribution of the form
| (1) |
where is the total mass of the cluster, and is the Plummer radius (the half-mass radius is ). The initial positions and velocities of the particles were constructed using the method of Aarseth, Hénon & Wielen (1974). The cluster changes rapidly after gas expulsion and so the exact form of the initial density distribution is unimportant as the cluster loses memory of this configuration very quickly (see e.g. Goodwin 1997a).
A number of authors have modelled the effect of gas expulsion on star clusters (e.g. Lada, Margulis & Dearborn 1984; Goodwin 1997a,b; Geyer & Burkert 2001; Kroupa, Aarseth & Hurley 2001; Kroupa & Boily 2002; Boily & Kroupa 2003a,b). If the gas removal timescale is less than a crossing time (as it is expected to be, especially in massive clusters - see Goodwin 1997a; Melioli & de Gouveia dal Pino 2006) then it is effectively instantaneous and the system can be modelled as one that is initially out of virial equilibrium (this avoids modelling the gas as an external potential (e.g. Goodwin 1997a,b; Kroupa et al. 2001).
We define an effective star formation efficiency (eSFE), which is a measure of how far out of virial equilibrium the cluster is after gas expulsion. We define the virial ratio as , where is the kinetic energy, and the potential energy (so a system in virial equilibrium has ).
A cluster with an eSFE of initially has a velocity dispersion too large to be in virial equilibrium. For example, a GMC with a radius of pc would have a velocity dispersion in virial equilibrium of km s-1. If it formed stars at 50 per cent efficiency, and those stars were in virial equilibrium with the total potential of the stars and gas initially then, after gas expulsion, the virial ratio of the stars would be 222The potential after gas expulsion is a factor of smaller, while the kinetic energy is a factor of lower, thus the virial ratio goes as . It should be noted that if stars do not form in virial equilibrium with the gas the eSFE is not a direct measure of the star formation efficiency. Indeed, it is possible for clusters to have eSFEs in excess of 100 per cent. For example, if the stars formed from the above GMC with a velocity dispersion of only 10 km s-1 from the GMC (thus less than the 15 km s-1 required to be in virial equilibrium after gas expulsion), the eSFE would be 225 per cent and the cluster would contract after gas expulsion (in fact it would be contracting before gas expulsion). However, as we shall see, all the evidence points towards eSFEs being less than 100 per cent.
As canonical initial conditions we choose a cluster with pc and . The results however scale (as per -body units) as we do not include an external tidal field or stellar evolution which would set a physical timescale. Excluding these effects is probably not important as clusters are so far out of virial equilibrium due to gas expulsion that these effects will be small perturbations on the overall behaviour of the system (see below). Thus we expect the results seen here to be applicable to clusters of all sizes333This assumption will probably fail if cluster masses were fairly small as the tidal field may then play an important role (see Kroupa et al. 2001), however for massive clusters it is probably correct..
Simulations were conducted using equal-mass particles. Tests show that the results are insensitive to both and the softening length of the gravitational interactions for any reasonable values. This convergence is unsurprising as the simulations follow the violent relaxation of the cluster to a new equilibrium, a situation in which 2-body encounters are fairly unimportant and it is the bulk behaviour of the potential that dominates the evolution.
The dynamical masses of star clusters models are calculated by “observing” the 1D velocity dispersion and calculating a mass using
| (2) |
where is the half-light radius, is the 1D (line-of-sight) velocity dispersion, the gravitational constant, and is a numerical constant (see Fleck et al. 2006 and references therein). Recently, Fleck et al. (2006) have modelled the effect on the parameter used in dynamical mass estimates. They find that increases dramatically due to mass segregation, such that the value typical used by observers, should underestimate the true mass of the clusters. As shown later in Fig. 5 (see also Bastian et al. 2006) the youngest clusters have masses which appear overestimated with respect to their luminous masses. Therefore the results of Fleck et al. (2006) seem not to apply to the young massive clusters with dynamical mass measurements (i.e. any cluster shown in Fig. 5) with the possible exception of M82-F.
2.2 Caveats
2.2.1 Stellar evolution
These simulations do not take into account the mass lost by stellar evolution. In the first few tens of Myr, clusters may lose per cent of their stellar mass. Goodwin (1997a,b) did include stellar evolutionary mass loss and found that it was a fairly minor perturbation on the expansion (as 10 per cent of the stellar mass is only a few per cent of the total initial mass). However, mass loss from stellar evolution may play a significant role once a cluster has relaxed into a new equilibrium as it will cause the cluster to expand further and possibly be disrupted even if the eSFE was high enough to allow it to survive the initial gas expulsion.
2.2.2 Stellar mass function and mass segregation
We also do not include a mass function. Goodwin (1997a) included a mass function, whilst Goodwin (1997b) used equal-mass particles. Again, no significant difference in the results was found. This is because we assume that there is no energy equipartition in these young clusters and so all stars, whatever their mass, have the same velocity dispersion, and so have the same probability of being lost. In reality, young clusters do appear to be mass segregated (e.g. de Grijs et al. 2001a,b). This may mean that there is some initial equipartition and higher mass stars have a lower velocity dispersion. If so, we would expect low-mass stars to escape preferentially as their velocity dispersion is higher. How significant this effect is depends on the details of mass segregation and how far down the mass function it extends (ie. is it only the highest-mass stars that have a lower velocity dispersion, or does velocity dispersion depend upon mass for all masses?). However, we feel that this is a second-order effect as the new escape velocity of the cluster after gas expulsion is a factor of lower than the initial escape velocity.
3 Results
Firstly we describe the effects of gas expulsion and violent relaxation on the structure of young massive star clusters. Then we examine the differences between the dynamical masses and luminosities of a large number of young clusters and how they might be explained. Finally we discuss infant mortality and the destruction of clusters.
3.1 The effects of gas expulsion
After gas expulsion stars have far too large a velocity dispersion for their new potential. As a result, the cluster expands in an attempt to find a new equilibrium. Those stars with a velocity greater than the new escape velocity tend to escape the cluster444In reality it is not quite this simple as, (a) stars can redistribute energy through 2-body encounters, and (b) the escape velocity changes as the cluster loses stars. However to a first approximation this is what occurs. (see also Tutkov 1978; Goodwin 1997a,b; Kroupa & Boily 2002; Boily & Kroupa 2003a,b; BG06).
In Fig. 1 we show the mass of escaped stars with time for different eSFEs. If the eSFE is per cent then the cluster becomes completely unbound within a few 10s Myr as it is incapable of reaching a new equilibrium. For greater eSFEs the cluster manages to retain a bound core but may loose a very significant fraction of its initial stellar mass (see also Goodwin 1997a,b; Kroupa & Boily 2002; Boily & Kroupa 2003a,b; BG06). It is these escaping stars that create the excess of light at large radii that BG06 show is observed in a number of young clusters and is the most obvious signature of violent relaxation after gas expulsion.

The expansion of the clusters, in an attempt to reach a new equilibrium, changes the core (and other) radii of clusters as illustrated in Fig. 2. This figure shows the core radii measured by fitting an EFF profile (Elson, Fall & Freeman 1987) to the surface brightness profile of the form
| (3) |
where is the central surface brightness, is a measure of the steepness of the outer parts of the profile, and is related to the core radius such that . Note that after 20 – 30 Myr, for low eSFE clusters, the lack of stars within the nominal 20 pc cluster radius makes determinations of the core radius very noisy and effectively meaningless. By such an age, low eSFE clusters have a very low surface brightness and we doubt if such objects would ever be observable above the background.
Clearly, the core radii increase as the clusters expand. However, much of the increase in the core radii of clusters with eSFE per cent is due to fitting the EFF profile to the entire cluster, including the tail of escaping stars. In Fig. 3 we show the surface brightness profiles of a 40 per cent eSFE cluster after 20 and 60 Myr together with their best-fit EFF profiles. At 20 Myr, the best-fit EFF profile is clearly not a good fit, this is due to attempting to fit an equilibrium model to a non-equilibrium cluster. The fit over-estimates the core radius as it tries to fit the excess light at large radii with pc and giving pc. By 60 Myr most of the excess light at large radii has gone, as those stars have become physically detached from the cluster, but the inner structure of the cluster is very similar. However, now the profile does not have to fit the excess light the best-fit becomes pc and giving pc555There is still a small amount of excess light at large radii even after 60 Myr. The attempt to fit the excess light in both profiles results in the over-estimate of the central surface brightness in both cases..
This clearly illustrates that, during the period that there is a significant contribution to the luminosity from escaping stars, the parameters obtained from profile fitting may have little to do with any final parameter. This may be avoided by not fitting profiles to the outer regions of clusters. A significant improvement occurs if the fitting is to luminosity rather than magnitude as this tends to weight the central regions more heavily. Similar effects can occur with other parameters - in particular the parameter from the EFF profile (see Goodwin 1997b).


This increase in core radii due to the expansion of clusters could well account for the increase in the observed core radii of very young clusters (see Elson et al. 1989; Elson 1991, esp. Fig. 14; Mackey & Gilmore 2003). Core radii generally increase with age as would be expected, in particular core radii seem to increase dramatically in the first few Myr (however this is based on just one point - R136). There is also very mild evidence that the core radii start to level-off after Myr as would be expected. However it is difficult to draw any conclusions from this data alone as we do not know what the initial core radii were, nor if they were all the same (but see Goodwin 1997b).
The rapid evolution of the core radii illustrates an important point. When measuring the properties of young star clusters many measurements are of instantaneous values which may not have a simple connection to a ‘final’ value (ie. the value when a new equilibrium has been reached). Measurements of the core radius of a cluster at Myr may give a value that is far in excess of the core radius that cluster will have at Myr. Indeed, measurements of parameters such as a characteristic radius need not give any clues as to the eSFE or final fate of a cluster unless all clusters were initially the same (e.g. see Goodwin 1997b for an attempt to combine parameters to estimate the final fate of young LMC clusters).
The simplest way to determine the eSFE of young clusters is to compare the dynamical and luminous masses. One of the main points made by BG06 was that the dynamical masses of clusters are not an accurate measure of their true masses during the expansion phase. In Fig. 4 we show the evolution of the ratio of dynamical mass to true mass (the actual mass of stars within 20 pc of the cluster) for clusters with eSFEs of 10 – 60 per cent. Clearly, the lower the eSFE - and so the higher the initial virial ratio - the worse the dynamical mass becomes as a measure of the true mass.

3.2 Dynamical mass vs. luminous mass
In Fig. 5 we show the ratio of dynamical-mass-to-luminosity (DMtL) for a selection of clusters against their age (updated from Fig. 5 of Bastian et al. 2006). The solid line shows the expected DMtL for virialised clusters (ie. those for which the dynamical mass is the true mass) with a Kroupa (2002) IMF from the simple stellar population models of Maraston (2005). The luminosity of the cluster changes as it ages due to stellar evolution which is included in the calculation of the canonical IMF line. Clearly, for young clusters, the DMtL is often significantly below this canonical value. Older clusters, however, lie very close to this line (Bastian et al. 2006). The discrepancy between the expected and observed DMtL has been taken as an indication of a non-standard IMF within some of these clusters. We, however, interpret this as a signature of violent relaxation.
Older clusters are expected to be in virial equilibrium having survived their gas expulsion episode. That they lie on the standard IMF DMtL line suggests that they have a standard IMF. This gives us confidence that our assumption of a standard IMF for young clusters is correct. It may be that young clusters with unusual IMFs destroy themselves and so are not present in the old sample. However to lie below the canonical line on Fig. 5 (as all but 2 clusters do) their IMF would have to be bottom heavy (ie. less light for their mass than expected) which would mean that they would be more likely to survive as the effects of stellar evolution would be significantly less dramatic.
Given that we expect dynamical masses to over-estimate the true mass of a young cluster it is possible to use the luminous mass (making the apparently reasonable assumption of a standard IMF) to determine how wrong the dynamical mass is, and hence the eSFE, and so final fate, of the cluster. We also mark on Fig. 5 the expected evolutionary paths of clusters with eSFEs between 10 and 60 per cent, i.e. the canonical IMF SSP evolution folded with the results of Fig. 4. As the dynamical mass overestimates the true mass (see Fig. 4), the DMtL will lie below the canonical line. Note that the evolutionary paths for different eSFEs start at 2 Myr to account for the time-lag between star formation and gas expulsion (ie. our simulations begin at gas expulsion).
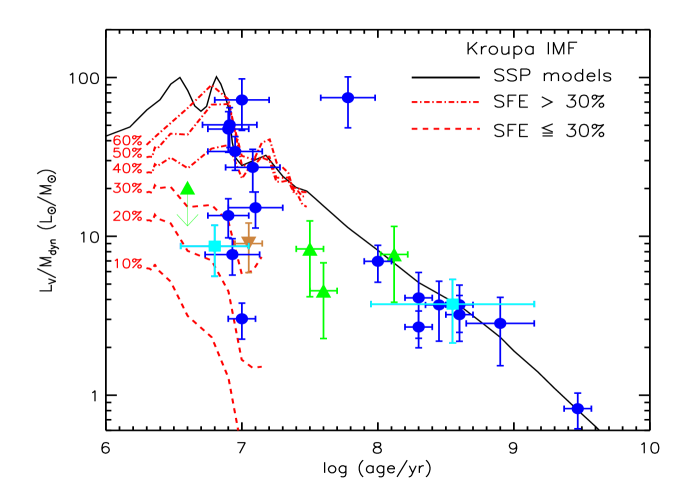
If our interpretation is correct, the young ( Myr) clusters plotted on Fig. 5 formed with a wide range of eSFEs, somewhere between 20 and 100 per cent. We reiterate that the eSFE is not necessarily a raw measure of the star formation efficiency – rather it measures the degree to which the cluster is out-of-equilibrium after gas expulsion (see § 2.1).
As clusters age they are either destroyed (eSFE per cent), or relax into (a new) virial equilibrium. Therefore clusters older than – Myr are expected to lie close to the canonical DMtL line as is found in Fig. 5. In some cases, even older clusters may become perturbed (by tidal or impulsive interactions, e.g. Gieles et al. 2006) pushing them out-of-equilibrium causing them to move away from the canonical DMtL line, however we would expect this to be fairly rare.
We note that M82-F is the one cluster that does not fit into this picture. It lies significantly above the canonical line which would suggest that it has an unusual top-heavy IMF (Smith & Gallagher 2001), is contracting, or possibly that its age estimate is incorrect (see BG06). The two LMC clusters (NGC 1850 and NGC 2157) with ages of Myr in the middle of Fig. 5 are also rather unusual as their eSFE from their position in the fig. is estimated to be per cent – right on the border-line between survival and destruction666Goodwin (1997b) estimates the eSFE of NGC 2157 to be 45 per cent, not too dissimilar to the 35 per cent suggested here..
3.3 Infant mortality
It is known that many young clusters must be destroyed. Observations of the age distribution of clusters in many galaxies show that the number of clusters in a given (linear) age bin decreases significantly with age. In particular, very young ( Myr) clusters are significantly over-abundant. Unless the cluster formation rate in galaxies is significantly higher now than in the past then many young clusters cannot survive into old age and suffer a high ‘infant mortality’ (e.g. Lada & Lada 2003, Bastian et al. 2005, Fall et al. 2005). Gas expulsion would seem an extremely good candidate for the mechanism that causes (at least a significant fraction of) infant mortality.
Clusters with eSFEs below per cent cannot survive gas expulsion. They are unable to find a new equilibrium and are destroyed (see also Goodwin 1997a,b; Kroupa & Boily 2002; Boily & Kroupa 2003a,b). Such destruction occurs in – Myr (see Fig. 1). The destructive expansion of low eSFE clusters is sufficiently rapid that clusters will likely become completely unobservable within a few 10s Myr, as an increase in radius by a factor of 3 will cause the surface brightness to decline by magnitudes (see Fall et al. 2005).
Examination of Fig. 5 shows that of the 12 clusters younger than Myr at least 7 of them had eSFEs of per cent and so would be expected to be destroyed before they reach Myrs. This provides a lower limit on the infant mortality in this sample of per cent. However, the biases of this sample are impossible to quantify as we rely on those clusters for which there are dynamical mass estimates. These clusters tend to be bright which may suggest a bias towards high eSFE clusters if there is any trend of eSFE with mass (e.g. Elmegreen & Efremov 1997), but an examination of the data shows no significant trends (ie. eSFE with luminosity or velocity dispersion). We note however, that the agreement between this estimate of the infant mortality rate agrees well with other estimates, suggesting that the sample may not be very biased.
3.4 Infant weight-loss
As shown in Fig. 1 even clusters that can survive gas expulsion may lose a significant fraction of their stellar mass within the first Myr. Thus the star cluster mass function (CMF) may change drastically even over timescales as short as this if the eSFE and cluster mass are correlated (see also Kroupa & Boily 2002), which may be expected from cluster formation models (Elmegreen & Efremov 1997).
If studies are restricted to the youngest clusters ( Myr) they will measure the initial CMF with which clusters form. If clusters with a range of ages are included, then the effects of rapid infant weight loss, early destruction through gas expulsion, and slower destruction/weight loss by stellar evolution and/or tidal fields must be accounted for. Models of a full cluster population, such as those presented in Gieles et al. (2005), which fit cluster parameters in age and mass space simultaneously, are a promising way to measure whether there is a mass dependence in the (e)SFE.
We note that, even though a bound core may remain when the eSFE is per cent, moderate eSFE clusters will become significantly more vunerable to destruction. Other effects which are not taken into account in this study (e.g. stellar evolution or tidal disruption) may be enough to dissolve the cluster completely. Of particular importance may be interactions with GMCs (e.g. Gieles et al. 2006), as young clusters form in gas rich environments.
Thus we see that rapid gas loss and subsequent effects are an extremely rapid and efficient way to put newly formed stars into the field. There are also galaxy-scale implications of the effect of rapid gas expulsion in young clusters (see Kroupa 2003). Since star clusters are born in a compact state, the velocity dispersion of the stars within the clusters can be rather large as there is enough gravitational potential energy provided by the remaining gas and other stars to bind the cluster. However, if the star-formation efficiency is low and the residual gas is removed on time-scales shorter than a crossing time, many stars will be thrown into the field with large velocities. It has been suggested that this effect can alter the morphology of galaxies and explain the age-velocity-dispersion relation observed in the Galaxy (Kroupa 2003).
4 Conclusions
We have simulated the evolution of massive young star clusters that are far-out of virial equilibrium due to the expulsion of the residual gas left-over after star formation. Our results are in agreement with previous simulations of this phase (e.g. Lada et al. 1984; Goodwin 1997a,b; Geyer & Burkert 2001; Kroupa et al. 2001; Kroupa & Boily 2002; Boily & Kroupa 2003a,b).
We parameterise the initial state of a cluster with an effective star formation efficiency (eSFE), , where the initial virial ratio of a cluster is (we define virial equilibrium to be ). We explore clusters with eSFEs between 10 and 60 per cent.
Clusters expand after gas expulsion in an attempt to reach a new equilibrium. If eSFE per cent then the clusters are destroyed within a few 10s of Myr, for higher eSFEs a bound core remains, but there may still be a significant degree of (stellar) mass loss and the final cluster may only be a small fraction of its initial mass. Those stars that escape cause an excess of light at large radii that is observed in many young clusters (BG06).
During its expansion a cluster is not in virial equilibrium. Its velocity dispersion retains a memory of the initial (gas plus stars) mass of the cluster and so dynamical mass estimates – which assume virial equilibrium – may be wrong by a very significant factor.
We also note that during the expansion phase cluster parameters, such as the core radius, may change significantly on a short timescale. In particular they may not change in a linear fashion. The core radii of intermediate eSFE clusters measured when escaping stars are still physically associated with the cluster may be significantly greater than the ‘final’ (relaxed) core radii (see also Goodwin 1997b). Many properties are instantaneous and it may be difficult to extrapolate to future values without knowing the initial conditions. This includes the mass of clusters which can change significantly as stars are lost (see also Kroupa & Boily 2002).
We compare the dynamical (assuming virial equilibrium) and luminous (assuming a standard Kroupa IMF) masses for a large sample of young clusters (limited by the number of clusters for which reliable values for both parameters are available). As noted by Bastian et al. (2006), young ( Myr) clusters tend to have too much dynamical mass for their luminosity, whilst older clusters have dynamical masses that match their expected luminosity for a Kroupa IMF.
We suggest that the discrepancy between the dynamical and luminous masses for young clusters is due to the incorrect assumption of virial equilibrium. We assume that young clusters – the same as old clusters – have a standard IMF and use the discrepancy between the mass estimates to calculate their eSFEs which appear to fall between and per cent (an upper limit is very difficult to establish as for eSFEs per cent the effect of gas expulsion is difficult to observe). This wide range of eSFEs may be due to a real difference in the star formation efficiencies of different clusters, or to differences in the initial equilibrium between the stars and gas (or, most likely, a combination of the two).
At least per cent of the young clusters have eSFEs – per cent and so we expect the infant mortality rate in this sample to be at least per cent (as we ignore further destructive effects such as stellar evolutionary mass loss and tidal fields). Further, there is an observational bias that means that low surface brightness – hence more extended, or more expanded – clusters which are likely to be destroyed are not observed.
In summary, young clusters are most likely to be re-virialising after gas expulsion. This means that (a) dynamical mass estimates may be significantly wrong, and (b) measured parameters (including mass) are instantaneous values and may not reflect the ‘final’ values. Assuming that luminosity-derived masses for young clusters are correct allows us to determine the effective star formation efficiencies of young clusters with dynamical mass estimates and we find that at least per cent of young clusters in our sample are unlikely to survive for more than a few 10s Myr. The true infant mortality rate is probably much higher than this.
Acknowledgments
SPG is supported by a UK Astrophysical Fluids Facility (UKAFF) Fellowship. The GRAPE-5A used for the simulations was purchased on PPARC grant PPA/G/S/1998/00642.
References
- [1] Aarseth, S.J., Hénon, M., & Wielen, R. 1974, A&A, 37, 183
- [2] Bastian, N., Gieles, M., Lamers, H.J.G.L.M., Scheepmaker, R. A., & de Grijs, R. 2005, A&A 431, 905
- [3] Bastian, N., Saglia, R.P., Goudfrooij, Kissler-Patig, M., Maraston, C., Schweizer, F., & Zoccali, M. 2006, A&A, 881, 891
- [4] Bastian, N. & Goodwin, S. P. 2006, MNRAS, 369, L9 (BG06)
- [5] Boily, C.M. & Kroupa, P. 2003a, MNRAS, 338, 665
- [6] Boily, C.M. & Kroupa, P. 2003b, MNRAS, 338, 673
- [7] Bosch, G., Selman, F., Melnick, J., & Terlevich, R. 2001, A&A, 380, 137
- [8] Clark, J.S., Negueruela, I., Crowther, P.A. & Goodwin, S.P. 2005, A&A, 434, 949
- [9] de Grijs, R., Gilmore, G. F., Johnson, R. A. & Mackey, A. D. 2001a, MNRAS, 331, 228
- [10] de Grijs, R., Johnson, R. A., Gilmore, G. F. & Frayn, C. M. 2001b, MNRAS, 331, 245
- [11] de Grijs, R., Anders, P., Bastian, N., Lynds, R., Lamers, H.J.G.L.M., & O’Neil, E.J. Jr. 2003, MNRAS, 343, 1285
- [12] Elmegreen, B.G. & Efremov, Y.N. 1997, ApJ, 480, 253
- [13] Elson, R.A.W. 1991, ApJS, 76, 185
- [14] Elson, R.A.W., Fall, M.S., & Freeman, K.C. 1987, ApJ 323, 54
- [15] Elson, R.A.W., Fall, M.S., & Freeman, K.C. 1989, ApJ, 336, 734
- [16] Fall, S. M., Chandar, R. & Whitmore, B. C. 2005, ApJ, 631, L133
- [17] Fleck, J.-J., Boily, C. M., Lançon, A. & Deiters, S. 2006, MNRAS, 369, 1392
- [18] Geyer, M.P. & Burkert, A. 2001, MNRAS, 323, 988
- [19] Gieles, M., Bastian, N., Lamers, H.J.G.L.M., & Mout, J.N. 2005, A&A, 441, 949
- [20] Gieles, M., Portegies Zwart, S. F., Baumgardt, H., Athanassoula, E., Lamers, H.J.G.L.M., Sipior, M., Leenaarts, J., 2006, MNRAS accepted (astro-ph/0606451)
- [21] Goodwin, S.P. 1997a, MNRAS, 284, 785
- [22] Goodwin, S.P. 1997b, MNRAS, 286, 669
- [23] Hills, J.G. 1980, ApJ, 235, 986
- [24] Hunter, D.A., Shaya, E.J., Holtzman, J.A., et al. 1995, ApJ, 448, 179
- [25] Kawai, A., Fukushige, T., Makino, J. & Taiji, M. 2000, PASJ, 52, 569
- [26] Kroupa, P., Aarseth, S., & Hurley, J. 2001, MNRAS, 321, 699
- [27] Kroupa, P. 2002, Science, 295, 82
- [28] Kroupa, P. 2003, MNRAS, 330, 707
- [29] Kroupa, P. & Boily, C.M. 2002, MNRAS, 336, 1188
- [30] Lada, C.J., Margulis, M., & Dearborn, D. 1984, ApJ, 285, 141
- [31] Lada, C.J. & Lada, E.A. 2003, ARA&A, 41, 57
- [32] Larsen, S.S. 2004 in “Planets to Cosmology: Essential Science in Hubble’s Final Years, ed. M. Livio, STScI” (astro-ph/0408201)
- [33] Larsen, S.S., Brodie, J.P., Hunter, D.A. 2006, AJ, 131, 2362
- [34] Mackey, A.D. & Gilmore, G.F. 2003, MNRAS, 338, 85
- [35] Maraston, C. 2005, MNRAS, 362, 799
- [36] McLaughlin, D.E. & van der Marel, R.P. 2005, ApJS, 161, 304
- [37] Melioli, C. & de Gouveia dal Pino, E. M. 2006, A&A, 445, L23
- [38] Miller, B. W., Whitmore, B. C., Schweizer, F. & Fall, S. M. 1997, AJ, 114, 2381
- [39] Östlin, G., Cumming, R., Bergvall, N. 2006, A&A, submitted
- [40] Plummer, H. C. 1911, MNRAS, 71, 460
- [41] Smith, L. J., & Gallagher, J. S. 2001, MNRAS, 326, 1027
- [42] Tutkov, A. V. 1978, A&A, 70, 57