The PSCz Dipole Revisited
Abstract
We re-examine the gravitational acceleration (dipole) induced on the Local Group of galaxies by the Infrared Astronomical Satellite (IRAS) galaxy distribution of the Point Source Catalogue redshift survey (PSCz). We treat the cirrus-affected low galactic latitudes by utilizing a spherical harmonic expansion of the galaxy surface density field up to the octapole order. We find strong indications for significant contributions to the Local Group motion from depths up to Mpc and possible contribution even from Mpc, in agreement with the recent analysis of Kocevski & Ebeling of a whole sky X-ray cluster survey. What changes with respect to the previous PSCz dipole analyses is: (a) the large-scale dipole contributions and (b) an increase of the overall dipole amplitude due to the important contribution of the local volume ( Mpc), which we now take into account. This results in a lower value of the parameter, which we find to be in real space. Therefore, for the concordance cosmological model () the IRAS galaxies bias factor is which means that IRAS galaxies are good traces of the underlying matter distribution.
Keywords: galaxies: clusters: general - large-scale structure of universe - infrared: galaxies
1 Introduction
It is well known that the peculiar velocity of the Local Group of galaxies is accurately determined from the CMB temperature dipole (Kogut et al. 1996; Bennett et al. 2003), being 622 km/sec towards . Under the framework of linear theory, the most probable cause for this motion as well as for the observed peculiar motions of other galaxies and clusters is gravitational instability (see Peebles 1980). The latter is supported by the fact that the gravitational acceleration of the Local Group of galaxies, as traced by many different samples of extra-galactic mass tracers is well aligned with the general direction of the CMB dipole (eg. Yahil, Walker & Rowan-Robinson 1986; Lahav 1987; Plionis 1988; Lynden-Bell et al. 1988; Miyaji & Boldt 1990; Rowan-Robinson et al. 1990; Strauss et al. 1992; Hudson 1993; Scaramella et al. 1991; Plionis & Valdarnini 1991; Branchini & Plionis 1996; Basilakos & Plionis 1998; Schmoldt et al. 1999; Rowan-Robinson et al. 2000; Kocevski, Mullis & Ebeling 2004; Erdogdǔ et al. 2006; Kocevski & Ebeling 2006).
However, what has been debated over the last decades, is the largest depth from which density fluctuations contribute significantly to the gravitational field that shapes the Local Group motion, which is called dipole convergence depth, .
The outcome of many studies in the past, using different flux or magnitude limited galaxy and cluster samples, was that the apparent value of the dipole convergence depth differed from sample to sample, in the range from 40 to 160 Mpc, with a strong dependence to the sample’s characteristic depth. For example, the dipole of the IRAS Point Source Catalogue for redshifts (hereafter PSCz) was claimed to mostly converge within a depth of Mpc with negligible, if any, contributions beyond Mpc (Rowan-Robinson et al. 2000; Schmoldt et al. 1999), while that of the optical Abell/ACO cluster sample, which is volume limited out to a large depth ( Mpc), was claimed to converge at Mpc but with significant contributions beyond Mpc (Scaramella et al. 1991; Plionis & Valdarnini 1991; Branchini & Plionis 1996). The latter result has been confirmed using X-ray cluster samples, which are free of the various systematic effects from which the optical catalogues suffer (Plionis & Kolokotronis 1998; Kocevski et al. 2004; Kocevski & Ebeling 2006). Of course, under the assumption that there is a linear bias relation between the cluster, the galaxy and the underlying matter density fluctuations, as proposed by Kaiser (1987), then the galaxy dipole should also show similarly deep contributions. This hinted that the shallower galaxy dipole convergence was spurious, and it could be attributed to the lack of adequately sampling of the distant density fluctuations.
This discussion was recently re-opened by two important papers, that of Erdogdǔ et al. (2006) who analysed the 2 Micron All-Sky Redshift Survey (hereafter 2MRS) and found Mpc, and of Kocevski & Ebeling (2006) who analysed a complete whole-sky survey of X-ray clusters and found Mpc.
Due to the fact that the Erdogdǔ et al. (2006) analysis accounted for the dipole contribution of local galaxies with known true distances and due to the potential importance of such contributions, especially on the light of the apparent difference between the original PSCz and 2MRS dipole results (see section 5 in Erdogdǔ et al. 2006), we decided to re-analyse the PSCz catalogue along the same lines. In particular, we estimate the PSCz dipole using an approach which is based on (a) a spherical harmonic expansion of the galaxy surface density up to the octapole order in order to mask the “zone of avoidance” and (b) accounting for contributions to the PSCz dipole from the nearby galaxies.
2 Data and Method
In this analysis we utilize the IRAS flux-limited 60-m redshift survey (PSCz) which is described in Saunders et al. (2000). It is based on the IRAS Point Source Catalogue and contains galaxies with flux Jy. The subsample we use, defined by and limiting galaxy distance of 240 Mpc, contains galaxies and covers of the sky.
We remind the reader that using linear perturbation theory one can relate the gravitational acceleration of an observer, induced by the surrounding mass distribution, to her/his peculiar velocity, according to:
| (1) |
where and is the mean number density. The dipole moment, , is estimated by weighting the unit directional vector pointing to the position of each galaxy, with its gravitational weight and summing over the galaxy distribution:
| (2) |
In order to estimate the dipole using observational data, it is necessary to recover the true galaxy density field from the observed flux-limited samples. This is done by weighting each galaxy by , where is the selection function, defined by:
| (3) |
is the luminosity function of the objects under study, , with the flux limit of the sample and is the mean tracer number density, given by integrating the luminosity function over the whole luminosity range. Note, that here we use the Rowan-Robinson el al. (2000) luminosity function.
Finally, due to discreteness effects and the steep selection function with depth, there is an additive dipole term, the shot-noise dipole, for which we have to correct our raw dipole estimates. In this work, we estimate the shot noise dipole using the analytic formula of Strauss et al. (1992) and Hudson (1993). Assuming Gaussianity, the Cartesian components of the shot noise dipole are equal and thus . Choosing the coordinate system such that one of the shot-noise dipole components is parallel to the z-axis of the true dipole we use an approximate correction model of the raw dipole according to (see Basilakos & Plionis 1998):
| (4) |
2.1 Treatment of the Masked regions
Firstly, we need to model the excluded, due to cirrus emission, galactic plane and correct accordingly our raw dipole. We do so by extrapolating to these regions the galaxy distribution from the rest of the unit sphere with the help of a spherical harmonic expansion of the galaxy surface density field (e.g., Yahil, Walker, Rowan-Robinson 1986; Lahav 1987; Plionis 1988; Tadros et al. 1999). For the purpose of the present analysis we expand the PSCz surface density field, , in spherical harmonics up to the octapole order:
where (), and the associated Legendre functions (). The observed surface density is related to the intrinsic one, , by: , where is a mask to account for the excluded galactic plane:
with . Thus the overall problem is reduced to the inversion of a matrix, , which then provides the values for the whole sky components of the galaxy distribution: , where is a matrix which contains the observed components from the incomplete data and is a matrix containing the model corrected components. Then the differential dipole components, at each spherical shell in , are corrected according to this expansion.
Secondly, about of the sky was unobserved by IRAS and we therefore apply to these areas a homogeneous distribution of galaxies following the PSCz redshift selection function.
2.2 Determining distances from redshifts
All heliocentric redshifts are first transformed to the Local Group frame using . We then derive the distance of each tracer by using:
with km/sec Mpc and
the non-linear term that takes into account the contribution of galaxy peculiar velocities, , to the galaxy redshift [ the peculiar velocity of the Local Group]. Instead of using 3D reconstruction schemes (e.g., Schmoldt et al. 1999; Branchini & Plionis 1996; Branchini et al. 1999; Rowan-Robinson et al. 2000) to estimate this term, we use a rather crude but adequate for the purpose of this work model velocity field (see Basilakos & Plionis 1998), the main assumptions of which are:
(a) The tracer peculiar velocities can be split in two vectorial components; that of a bulk flow and of a local non-linear term:
(b) The first component dominates and thus . As for the observed bulk flow direction and profile we use that given by Dekel (1997) and combined with that of Branchini, Plionis & Sciama (1996). The zero-point, , and the direction of the bulk flow is estimated assuming, due to the “coldness” of the local velocity field (eg. Peebles 1988), by (where km/s is the LG in-fall velocity to the Virgo Cluster).
2.3 Treatment of the Local Volume
As in Erdogdǔ et al. (2006) we use the true distances for all possible nearby PSCz galaxy. To this end we cross correlate the PSCz catalogue () with two literature datasets of neighbouring galaxies with measured distances (Freedman et al. 2001; Karachentsev et al. 2004), which revealed 56 common galaxies up to km/s, out of which three are blue-shifted galaxies. Two of these belong to the Virgo cluster area and thus we put them to the center of Virgo ( Mpc), while the other one is assigned to the zero velocity surface Mpc (see Courteau & van den Bergh 1999; Erdogdǔ et al. 2006).
3 Results
3.1 Redshift-Space
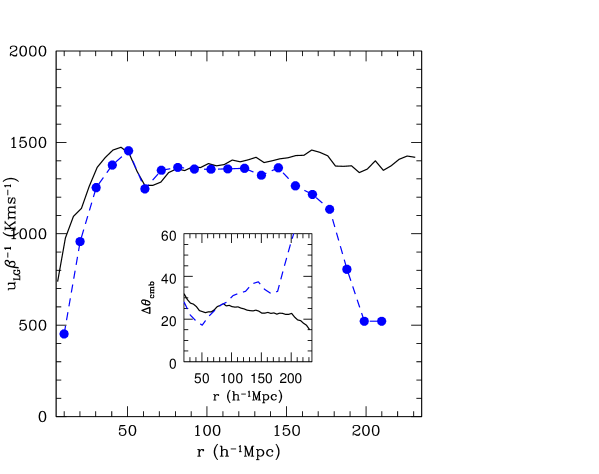
In figure 1 we present a comparison in redshift space of our PSCz (solid line) and the 2MRS (dashed line; Erdogdǔ et al. 2006) number-weighted galaxy dipoles, out to 210 Mpc, both corrected for their respective shot-noise (eq. 4). The corresponding galaxy-CMB dipole misalignment angle is shown in the insert of figure 1. The shape and amplitude of the two profiles are in very good agreement but only within Mpc. The 2MRS dipole seemingly reaches a plateau at 60Mpc while the corresponding PSCz dipole continues to grow.
Beyond Mpc, however, the 2MRS dipole drops dramatically, a behaviour not seen in the flux-weighted 2MRS dipole (see Erdogdǔ et al. 2006), while the PSCz dipole appears to increase by up to Mpc. Despite, the fact that the 2MRS catalogue samples the volume within Mpc better than the PSCz survey, the opposite is observed at greater distances, as revealed by comparing the two redshift distributions (see figure 3 of Erdogdǔ et al. 2006). Therefore, the PSCz catalogue samples the distant matter fluctuations better than the 2MRS survey. This can also be appreciated when comparing the corresponding PSCz and 2MRS dipole misalignment angles with the CMB (see the insert panel of figure 1).
3.2 Real-Space
We concentrate now on the real space dipoles. Due to the fact that Erdogdǔ et al. (2006) did not present the 2MRS dipole in real space, we will compare our results only with previous PSCz analyses (Schmoldt et al. 1999; and Rowan-Robinson et al. 2000). These studies, however, utilize different techniques in order to correct for the redshift space distortions while they also practically exclude the local volume (galaxies with Mpc), an important contributor of the local velocity field.
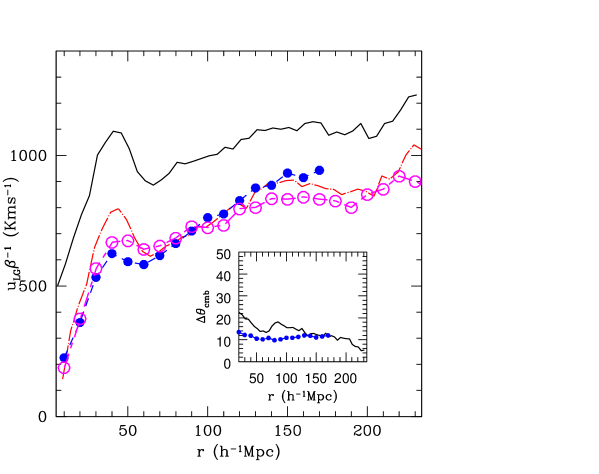
In figure 2 we present our PSCz dipole (solid line) in real space taking into account the contributions from the local volume. Apparently, there are three amplitude dipole bumps. The first one, at Mpc, is caused by the Great Attractor (Lynden-Bell et al. 1988). The second one is caused by the Shapley concentration (Scaramella et al. 1989; Raychaudhury 1989; Bardelli et al. 1994), a huge mass overdensity located beyond Mpc in the general direction of the Hydra-Centaurus supercluster (e.g., Plionis & Valdarnini 1991; Scaramella et al. 1991; Branchini & Plionis 1996; Plionis & Kolokotronis 1998; Kocevski et al. 2004; Kocevski & Ebeling 2006 and references therein). Finally, from our analysis there appears to be also a third bump, at Mpc. However, due to sparse sampling such deep contributions cannot be accurately determined by the present galaxy sample (e.g., Kolokotronis et al. 1996).
If we now exclude the local volume ( Mpc), we can directly compare our estimated PSCz dipole (dot dashed line) with those derived by Schmoldt et al. (1999) and Rowan-Robinson et al. (2000) (solid and open circles respectively). The three dipoles compare very well, although they are based on a different treatment of the masked regions and of the method used to translate redshift to real space, to which we should attribute the small differences in the Local Universe (Mpc) and between 140 and 200 Mpc (in which distance range we slightly differ only with Rowan-Robinson et al. results). The insert panel of figure 2 shows the PSCz-CMB dipole misalignment angle as a function of distance from the Local group for our (line) and Schmoldt et al. (dots) results. Evidently, they almost coincide at large distances. The further decrease of our PSCz-CMB dipole misalignment angle out to 240 Mpc supports the existence of possible dipole contributions from very large depths.
3.3 Robustness of Spherical Harmonic Mask
As we discussed in section 2.1 we have decided to use the mathematically elegant spherical harmonic apporach in order to deal with the so-called “zone of avoidance”. For concistency we have decided to use the same galactic latitude limit () as in Schmoldt et al. (1999), who however used a cloning technique (see Lynden-Bell, Lahav & Burstein 1989) to extrapolate the galaxy distribution of two strips, above and below the “zone of avoidance”, to the masked region. Rowan-Robinson et al. (2000) used a slightly different technique although of the same philosophy. They divided the sky into 413 areas, each approximately 100 deg2. The areas affected by the mask where artifiscially filled, at random positions, with flux-velocity pairs either randomly selected from the whole data set or from two neighboring bins that were at least 75% full. However, the resulting dipole direction and amplitude was found, especially at large distances, to be distinctly different.

Therefore it appears imperative to test the robustness of our approach, to variations of the galactic latitude limit. In Fig. 3 we present the fluctuation of the real-space dipole amplitude, , around its value at Mpc for the different values. The robusteness of the dipole amplitude is evident (variations ). As for the dipole misalignment angle with respect to the CMB (see insert of Fig. 3) it is always lower than . However, there is a small increase of the misalignment angle as a function of increasing which should be expected from the important structures located near the galactic plane (eg. Radburn-Smith et al. 2006 and references threin).
We conclude that our dipole results are robust to small variations of the considered size of the “zone-of -avoidance”.
3.4 Deep Contributions
In order to further investigate the probable deeper PSCz dipole contributions we estimate the differential dipole in equal volume shells of different sizes (see Plionis, Coles & Catelan 1993; Basilakos & Plionis 1998). In table 1, we present results for the case of Mpc3. A measure of the significance of the differential dipole of the individual shells, is given by:
| (5) |
We observe that two local shells ( Mpc) and four distance shells reaching up to 228 Mpc have signal to noise ratios and relatively small misalignment angles between the differential and CMB dipoles: and for the inner and outer shells, respectively. The joint probability to have random alignments within the above misalignment limits is extremely low. Indeed, the formal probability that two vectors are aligned within is given by the ratio of the solid angle which corresponds to , to the solid angle of the whole sphere, ie., .
We can now estimate the random joint probability of alignment, within the observed , of independent vectors, which is given by: . Due to (a) the fact that galaxies are correlated spatially and (b) the vicinity of some of the shells, we consider the joint probability of the first (1-103 Mpc), the eighth (187-196 Mpc) and the tenth (214-221 Mpc) shells, for which we find . This should be considered as a conservative upper limit since we have not taken into account the other four, , shells.
| Mpc | ||||||
|---|---|---|---|---|---|---|
| 1-103 | 8238 | 141.7 | 290.7 | 40.3 | 15 | 0.017 |
| 103-129 | 1390 | 13.1 | 249.8 | 39.3 | 24 | 0.043 |
| 129-148 | 662 | 1.8 | 191.4 | 15.7 | 78 | 0.400 |
| 148-163 | 480 | 3.1 | 324.9 | -14.2 | 64 | 0.280 |
| 163-176 | 375 | -3.8 | 147.7 | -34.9 | 137 | 0.868 |
| 176-187 | 260 | 0.2 | 304.9 | -54.4 | 88 | 0.480 |
| 187-196 | 201 | 5.2 | 300.6 | 44.8 | 24 | 0.042 |
| 196-205 | 164 | -5.9 | 132.8 | -25.8 | 148 | 0.925 |
| 205-214 | 165 | 5.1 | 254.8 | -21.5 | 56 | 0.219 |
| 214-221 | 142 | 9.3 | 297.3 | 1.5 | 34 | 0.088 |
| 221-228 | 107 | 9.8 | 269.8 | -10.5 | 41 | 0.123 |
| 228-235 | 100 | 1.6 | 325.6 | -36.1 | 80 | 0.416 |
As a further test we also use a Monte-Carlo procedure (see Basilakos & Plionis 1998) to test whether the dipole-CMB alignments could be induced due to our frame transformation procedure. We find that the probability to have random alignments due to the frame transformation is low and comparable to . As a result, we conclude that the differential dipole directions are not randomly oriented with respect to the CMB and therefore we have further indications for significant dipole contributions from large depths.
The deeper differential dipole signal supports the existence of dipole contributions from large depths, were numerous groupings and cluster of galaxies have been found (Kocevski & Ebeling 2006). This result is however in contrast with the conclusions of Rowan-Robisnon et al. (2000) and Schmoldt et al. (1999), who find negligible, if any, dipole contributions beyond Mpc. Our different conclusion is based, we beleive, in the different approach (differential dipole) used to investigate the possible deep dipole contributions in the presence of sparse data.
3.5 The Parameter
Under the biasing ansatz it is easy to obtain the value of the parameter. Erdogdǔ et al. (2006) found from the dipole in redshift space. However, using the corrected for shot-noise dipole (according to eq. 4) one finds: , which is exactly the value that we find also from our PSCz analysis. In real space our PSCz dipole gives , which means that in the framework of the concordance cosmological model () the IRAS galaxy bias factor is . It is interesting to mention that our results are in agreement with those derived from the so called VELMOD technique using a variety of extragalactic data sets (see Davis, Nusser & Willick 1996; Willick & Strauss 1998; Nusser et al. 2001; Pike & Hudson 2006). Also our results are in agreement with those found by Maller et al. (2003), based on the 2MASS flux weighted dipole.
If we take out the contributions from the local volume the parameter is found to be in agreement with Basilakos & Plionis (1998), Schmoldt et al. (1999), Rowan - Robinson et al. (2000) and Ciecielag & Chodorowski (2005).
4 Conclusions
We have revisited the PSCz dipole using a spherical harmonics expansion of the galaxy density field up to the octapole order in order to model the excluded low-galatic latitudes. We have also used measured distances from the literature for the nearby galaxies and we find that the amplitude of the dipole increases with respect to the previous PSCz dipole analysis. We also find indications for significant contributions to the gravitational field that shapes the Local Group motion from very large distances in agreement with a recent analysis of a deep all-sky X-ray cluster survey. Finally, within the linear biasing ansatz we find and 0.49 in redshift and real space, respectively. This implies that within the framework of the concordance cosmological model () the linear biasing factor of the IRAS galaxies is .
References
- [] Bardelli, S., Zucca, E., Vettolani, G., Zamorani, G., Scaramella, R., Collins, C.A., MacGillivray, H.T., 1994, MNRAS, 267, 665
- [] Basilakos, S. & Plionis, M., 1998, MNRAS, 299, 637
- [] Bennett, C.L., et al., 2003, ApJS, 148, 1
- [] Branchini E., &, Plionis M., 1996, ApJ, 460, 569
- [] Branchini E., Plionis M., &, Sciama D.W., 1996, ApJ, 461, L17
- [] Branchini E., et al., 1999, MNRAS, 308, 1
- [] Ciecielag, P., &, Chodorowski, M. J., 2004, MNRAS, 349, 945
- [] Courteau, S., &, van den Bergh, S., 1999, AJ, 118, 337
- [] Davis, M., Nusser, A., &, Willick, J. A., 1996, ApJ, 473, 22
- [] Dekel A., 1997, in L.da Costa ed. ‘Galaxy Scaling Relations: Origins, Evolution & Applications’, Springer, p.245
- [] Erdogdǔ, P, et al., 2006, MNRAS, 368, 1515
- [] Freedman, W. L., et al., 2001, ApJ, 553, 47
- [] Hudson M.J., 1993, MNRAS, 265, 72
- [] Kaiser N., 1987, MNRAS, 227, 1
- [] Karachentsev, I. D., Karachentseva, V. E., Huchtmeier, W. K., &, Makarov, D. I., 2004, AJ, 127, 2031
- [] Kocevski, D. D., Mullis, C. R.., &, Ebeling, H., 2004, ApJ, 608, 721
- [] Kocevski, D. D., & , Ebeling, H., 2006, ApJ, 645, 1043
- [] Kogut et al., 1993, ApJ, 419, 1
- [] Kolokotronis, V., Plionis, M., Coles, P., Borgani, S., &, Moscardini, L., 1996, MNRAS, 280, 186
- [] Lahav O., 1987, MNRAS, 225, 213
- [] Lynden-Bell, D., Faber, S.M., Burstein, D., Davies, R.L., Dressler, A., Terlevich, R.J. & Wegner, G. 1988, ApJ, 326, 19
- [] Lynden-Bell, D., Lahav, O. & Burstein, D. 1989, MNRAS, 241, 325
- [] Maller, A. H., McIntosh, D. H., Katz, N., &, Weinberg, M. D., 2003, ApJ, 598, L1
- [] Miyaji T., &, Boldt E., 1990, ApJ, 353, L3
- [] Nusser, A., et al., 2001, MNRAS, 320, L21
- [] Peebles P.J.E., 1980. The Large Scale Structure of the Universe, Princeton University Press, Princeton New Jersey
- [] Peebles, P.J.E., 1988, ApJ, 332, 17
- [] Pike R. W., &, Hudson M. J., 2006, ApJ, in press, astro-ph/0511012
- [] Plionis, M., 1988, MNRAS, 234, 401
- [] Plionis, M. & Valdarnini, R., 1991, MNRAS, 249, 46
- [] Plionis M., Coles P., &, Catelan P., 1993, MNRAS, 262, 465
- [] Plionis M. & Kolokotronis, V., 1998, ApJ, 500, 1
- [] Radburn-Smith, D.J., Lucey, J.R., Woudt, P.A., Kraan-Korteweg, R.C., Watson, F.G., 2006, MNRAS, 369, 1131
- [] Raychaudhury, S., 1989, Nat, 342, 251
- [] Rowan-Robinson M., et al., 1990, MNRAS, 247, 1
- [] Rowan-Robinson M. et al., 2000, MNRAS, 314, 375
- [] Saunders W., et al. 2000, MNRAS, 317, 55
- [] Scaramella, R., Baiesi-Pillastrini, G., Chincarini, G., Vettolani, G. Zamorani, G., 1989, Nat, 338, 562
- [] Scaramella, R., Vettolani, G., &, Zamorani, G., 1991, ApJ, 376, L1
- [] Schmoldt, I. M., et al., 1999, MNRAS, 304, 893
- [] Strauss M.A., Yahil A., Davis M., Huchra J.P., &, Fisher K., 1992 ApJ, 397, 395
- [] Tadros, H., et al., 1999, MNRAS, 305, 527
- [] Willick, J. A., &, Strauss, M. A., 1998, ApJ, 507, 64
- [] Yahil A., Walker, D., &, Rowan-Robinson, M., 1986, ApJ, 301, L1