The giant star of the symbiotic system YY Her: Rotation, Tidal wave, Solar-type cycle and Spots
Abstract
We analyze the historical light curve of the symbiotic star YY Her, from 1890 up to December 2005. A secular declining trend is detected, at a rate of .01 magn in 1000 d, suggesting that the system could belong to the sub-class of symbiotic novae. Several outburst events are superposed on this slow decline. Three independent periodicities are identified in the light curve. A quasi-periodicity of 4650.7 d is detected for the outburst occurrence. We suggest that it is a signature of a solar-type magnetic dynamo cycle in the giant component. A period of 593.2 d modulates the quiescent light curve and it is identified as the binary period of the system. During outburst events the system shows a stable periodic oscillation of 551.4 d. We suggest that it is the rotation period of the giant.The secondary minima detected at some epochs of quiescence are probably due to dark spots on the surface of the rotating giant.
The difference between the frequencies of these two last periods is the frequency of a tidal wave in the outer layers of the giant. A period which is a beat between the magnetic cycle and the tidal wave period is also apparent in the light curve. YY Her is a third symbiotic system exhibiting these cycles in their light curve, suggesting that a magnetic dynamo process is prevalent in the giant components of symbiotic stars, playing an important role in the outburst mechanism of some of these systems.
keywords:
binaries: symbiotic – stars: individual: YY Her – stars: magnetic fields – stars: oscillations.1 Introduction
The long-term light curve (LC) of a symbiotic star (SS) is quite irregular, and shows phases of quiescence, with quasi regular brightness oscillations and phases of activity. For a few SS’s, records of their photometric behaviour, going back about a century, are available. The inspection of these historical LC’s reveals a complex photometric variability both during quiescence and during outburst epochs. Analysis of these LC’s can be used as a tool for gaining insight into the symbiotic nature and may help revealing properties of the cool component of these binary systems.
Formiggini & Leibowitz (1994) analyzed the historical LC of Z And and discovered a 8400 d period for the outburst activity, beside the 758.8 d binary one. During the outburst phases, a period of 656 d is also present. In BF Cyg, Leibowitz & Formiggini (2006, hereafter paper I) detected, in addition to the well known 757.3 d binary period of the system, a 6376 d cycle for the occurrence of the outbursts. Another significant periodicity of 798 d was detected for this system, and was interpreted as the rotation period of the giant component of this binary system. The discovery that outburst events occur with a constant time interval between them is relevant to the understanding of the origin of the outburst phenomenon and of the nature of the clock that regulates their appearance. In paper I we suggested that a magnetic dynamo process, similar to the well known solar cycle, can be the mechanism that regulates the activity events of BF Cyg.
In this paper we analyze the historical LC of YY Her, which is among the prototype symbiotic stars. Its giant component is a M4 star (Műrset & Schmid 1999). Its optical spectrum shows strong TiO bands, but no radial velocity data are available (Kenyon 1986). The nature of the hot component is not well established. Numerous strong emission lines are detected in the IUE ( International Ultraviolet Explorer) spectra. The flat UV continuum can be fitted by a hot main sequence accretor (Kenyon & Webbink 1984). The photometric history of YY Her since 1890 has already been analyzed by Munari et al. (1997), and a periodic 590 d fluctuation was detected. Several outburst events are known for YY Her. After the 1997/98 event, secondary minima appear in the B, V, R photometric data, but not in the U light curve (Hric, Petrik & Niarchos 2001). Ellipsoidal variations of the red giant have been suggested as the origin of these secondary minima (Mikolajewska et al. 2002).
In this work we analyze a 115 years historical LC of YY Her with a procedure that is similar to the one used for BF Cyg in paper I. Although the photometric data available for YY Her are less regular, the results are so similar to those found for BF Cyg, that the two stars may be considered as nearly twin systems.
In Section 2 we describe the data sets used in our analysis and the strategy adopted for merging the data sets and constructing a time-series adequately scaled along the whole time interval of the available observations. In Section 3 we present the time-series analysis techniques used in the search for periodicities and the periods detected in that analysis. We propose an interpretation of the detected periodicities and of the appearance of the secondary minima. In Section 4 we compare the characteristics of YY Her to those of BF Cyg and discuss some possible implications on the nature of the giant star in symbiotic systems.
2 The long-term light curve of YY Her
The previous study of the photometric history of YY Her by Munari et al. (1997) is based on two data sets. The first one is of photographic magnitudes from several sources and the second one is a merging of visual estimates retrieved from the AAVSO and AFOEV data banks, after correcting for possible systematic errors. Several outburst events are evident in this LC but the different scale of the photographic and visual samples precludes a whole overview of the behaviour of this system (see Fig. 3 of Munari et al. 1997).
The photographic magnitudes assembled in Table 6 of Munari et al. (1997) are sparse data mainly from the Harvard plates collection, and more frequent measurements from the Sonnenberg Sky Patrol archive, starting from JD 2434099 (1952) up to JD 2439059 (1965). We use these data such as published as representative of the ancient LC of YY Her. To these we added the large AAVSO data set of confirmed visual estimates up to November 2001 and converted them into means of 10 d.
The last validated data from AAVSO correspond to November 2001. In order to obtain the LC up to the present days, we retrieved the data from the AFOEV data-bank. We averaged these visual estimates over a time interval of 10 d, excluding the upper limits or the uncertain values. A systematic offset of .028 magn between this set and the 10-d binned set from the of AAVSO was estimated comparing the data in the overlapping time interval. Scaling the data we were able to continue the LC for YY Her up to December 2005.

Fig. 1 is a plot of the entire LC obtained from all our data sources. Two distinct subsets are clearly seen in the figure. In order to establish the mpg and the mv LC’s on a common zero-point level we considered the few measurements that populated the overlapping portions of the two light curves. Comparing the magnitudes of points that are close in their time of observations in the two LC’s we derive the value (mpg-mv)= .90.
A more accurate value has been obtained by also taking into account the general trend of the system during quiescence state, in each of the two light curves separately. For this purpose, we eliminated from both samples the measurements classified as uncertain and all the brightest data belonging to epochs of activity. Applying a linear regression to the quiescence state sections of each of the two light curves, a slow decline with time is detected in both of them. The slope of the two lines in Fig. 1 is .96 10-05 and 4.3 10-06 for the mpg and the mv data respectively. The fact that a negative slope is measured in the two independent LC’s, at two different time intervals, is evidence of the reality of the trend. Considering the statistical uncertainty in the slope, due also to the different time-length of the two data samples, these result are consistent with a general decline at a constant rate throughout the entire time of the observations. The no trend result reported by Munari et al. (1997) is probably due to the relatively short time interval (1969-1993) considered by these authors. Our second subgroup of data points that does show the decline includes twelve additional years, based on AAVSO data.
When the decline trend is taken into account, the scaling factor between the two lines in Fig. 1 in the overlapping regions of the two data sets takes the value .97 magn, and we applied it to the AAVSO data. We then calculated a linear regression to the complete sample of quiescent data. The resulting rate of the steady decline of the system from 1890 up to November 2001 is .01 magn in 1000 d. The trend of decline detected here, suggests that the system is recovering from a major brightening event, which occurred sometime before 1890, the year of the first recorded magnitudes. A decreasing trend in the long-term LC is one of the characteristic of the sub-class of symbiotic novae such as HM Sge, RR Tel or BF Cyg. This behaviour is associated with a single major nova-like event that occurred in these systems, followed by a very slow fading that lasts for more than a century.
The dots in Fig. 2 show the measurements of YY Her from 1890 up to Dec 2005, de-trended for the secular decline as explained above. The total time covered by the observations is 115.6 yr, but the distribution of data within this time range is not homogeneous. Due to the scarcity of points of the very old observations, in the time series analysis that we applied to the data we have disregarded all points prior to JD 2420000. Therefore the analysis is applied to a 92.37 years LC. Several outbursts, with different amplitudes, are clearly seen in this LC, although only the last two are well covered by frequent measurements. We shall address the bias due to the non homogeneous distribution of points in the LC that we have analyzed.

3 Time Series Analysis

3.1 General Periodic Content
In order to examine the overall periodic content of the LC we begin our analysis by computing the power spectrum (PS) of the LC shown in Fig. 2 by means of the Lomb-Scargle algorithm (Scargle 1982). The PS is presented in Fig. 3 (a); the insert shows the window function. Due to the very uneven distribution of the observation points along the time axis, many of the peaks in the PS do not represent genuine periodicities in the LC but are rather aliases of other periods. In order to clean the PS from these spurious peaks we applied the CLEAN algorithm for time-series (Roberts, Lehár & Dreher 1987). Fig. 3 (b) is the CLEAN PS. The PS in both Fig. 3 (a) and (b) is dominated by a highly significant peak designated P1 in the figure. The 2nd and 3d highest peaks are marked as P2 and P3. The other peaks in the PS are also marked by numbers ordered by their height.
From inspecting Fig. 2 it is quite clear that the cycle of P1 in the LC is highly non-harmonic. Since the Lomb-Scargle PS search technique (Scargle 1982) is especially sensitive to harmonic signals, we applied on the LC the Analysis of Variance (AoV) (Schwarzenberg-Czerny 1989) method. This technique does not favor any particular structure in the search for cycles. Fig. 3 (c) is the AoV periodogram, where the three dominating features are the same highest peaks in the PS seen in frames (a) and (b). Thus it is clear that the three periodicities have not been introduced into the data by the algorithm of the analysis.
3.2 The P1 periodicity
The period corresponding to the P1 peak is 4638 d. We applied the bootstrap statistical test (Efron & Tibshirani 1993) on the LC. It showed that the probability of obtaining in the PS a peak as high as the P1 from a random distribution of magnitudes at the times of the observations is smaller than 10-3.
In order to strengthen even further the reliability of the statistical significance of the P1 peak we repeated the bootstrap test with the following procedure. We bin the LC onto 128 bins, each of 300 d width. With this binning, each time interval corresponding to the suspected binary period of the system (600 d, Munari et al. 1997) is represented by just two points. The outburst events themselves are represented by just three to seven points. We compute the PS of the resulting time series. The highest peak in this LC corresponds again to the P1 period. The bootstrap test indicates that even for such a poorly sampled LC, the probability to obtain in the PS, as a random event, a peak as high as that of the P1 periodicity, is less than 1/300.
The periodic or quasi-periodic nature of the series of outbursts of YY Her therefore seems to be statistically highly significant.
Fig. 2 shows that the cycle of the P1 periodicity does not have a stable structure. In particular the amplitudes of the outbursts are very different from one cycle to another. The value of P1 therefore should not be construed as the period of a coherent oscillation, but rather as the mean value of a rather regular time interval that separates successive outbursts of the system. The meaning of P1 is therefore similar to the meaning of the 11.3 year interval that is commonly referred to as the period of the Solar activity cycle. As is well known, the actual time interval between successive minima of the solar cycle varies between 9.5 and 12.5 years (Lorente & Montesinos 2006), or even between 7 and 17 years (Rogers, Richards & Richards, 2006). Further discussion of the nature of the P1 cycle and its relation to the P3 periodicity is presented in Section 3.7.
Fig. 4 (a) displays the LC of the star, superpose on a Sine wave of the P1 periodicity. The figure shows that while the structure of individual outbursts varies considerably, the outburst repetition time P1 does indeed represent a strong periodic modulation of the timing of the phenomenon.

Fig. 4 (b) displays the LC of the star folded onto the P1=4650.7 d period. This particular value for the period P1 is explained in Section 4.3. The complete absence of high points in about one half of the P1 cycle is again a clear demonstration of the cyclic nature of the outbursts phenomenon in the YY Her system.
3.3 The P2 and P3 periods
The two highest peaks in the high frequency part of the PS, numbered 2 and 3 in Fig. 3 (a), and particularly distinguishable in Fig. 3 (b), correspond to the periods P2594 d and P3551 d. The P2 period was already identified in the LC of YY Her and it is commonly considered the binary orbital period of the system (Munari et al. 1997). We note, however, that so far we are unaware of spectroscopic measurements that confirm this identification. The peak of the P3551 d periodicity is nearly as prominent in the PS as that of the P2 period. In order to show even better their prominence and independence we proceed as follows. We compute a running mean LC (RMLC) by applying the running mean operator on the observed LC. The width of the running window that we used in this operation is 600 d, close to the 594 d suspected binary period of the system, as mentioned above. In the low frequency range, up to f=0.001 (1/day) the PS of the RMLC is identical to that of the observed LC. It shows that the low frequency brightness variations of the star are independent of the high frequency variations. We then consider the residuals of the observed LC (RSLC) obtained by subtracting the RMLC from the observed one. This is the LC of the star from which the low frequency variability, in particular the P1 periodicity, is removed. Note that by subtracting the RMLC we remove the low frequencies without using, or even assuming, any cyclic behavior of the star on the 600 d time scale.
Fig. 5 (a) is the CLEAN PS of RSLC. The P1 periodicity is absent and the two domineering peaks of P2 and P3 are highly significant. However, these two periodicities are not contemporaneous in the LC of the star.

In order to show this, we consider separately two subsets of the LC points. One is the High (H)LC, consisting of points measured during outbursts of the star. The Low (L)LC consists of the observed points during quiescence states of the system. The division between H and L LCs was done in three different ways: (1) Applying a brightness criterion in the selection of the points. In particular, an Hm LC is constructed from all points with magnitude brighter than -0.5 mag in Fig.2. The complementary low points constitute the Lm LC. Our results are similar when we consider any division threshold between the Hm and the Lm LCs in the range -.2 to -.6 mag. (2) Determining by eye in Fig. 2 the time intervals at which an outburst of the star is apparent. These time intervals are indicated by the heavy line segments along the x-axis of Fig. 4a. All points of the RSLC that fall within these intervals are the Hj LC (j for JD determined). The complementary points of the RSLC constitute the Lj LC. (3) Selecting points by phase in the P1 cycle. This is done with the help of Fig. 4b. The Hp LC consists of all RSLC points that fall between phase 0.1235 and 0.5635 in the P1 cycle, where phase 0 is taken arbitrarily to be on JD 2415000. All points in the complementary phase interval are the Lp LC.
The PS of the Lm LC (not shown in this paper) has a distinct, highly significant peak corresponding to the P2 periodicity with hardly a trace of the P3 period in it. The PS of the Hm LC is very noisy, due to the scarcity of points in that subset of the data. We therefore consider now the Lj and Hj LCs. Fig. 5 (b) is the PS of the Lj LC. It is very similar to the PS of the Lm LC. Fig. 5 (b) shows the dominating, highly significant peak of the P2 periodicity. Fig.5 (c) is the PS of the Hj LC. Here the second highest peak is P3 (the highest one corresponds to P=492 d which is a 4650 d alias of P3, introduced into the data by the selection process of the Hj LC). The P2 peak in this figure is hardly above the noise level of the curve. This shows that during outbursts, the star oscillates mainly with the P3 periodicity, while the P2 period plays only a secondary role.
The P3 peak emerges from the noise in this PS while as mentioned above it is not prominent in the PS of the Hm LC. The reason is that in the selection criterion of the Hj LC, we include also faint points that are measured during outbursts, while we select them out from the Hm LC. Thus the Hj LC includes complete oscillation cycles of the star during outbursts, and therefore the PS is able to discover them. The Hm LC, on the other hand, includes only the brightest points that constitute only part of the oscillation cycles. Therefore, the P3 periodicity is not well identified by the PS of that LC.
Finally, we note that the power spectra of the Lp and Hp LCs, namely, the Low and High LCs obtained by selecting points according to their phase in the P1 cycle, are virtually the same as those shown in Fig. 5 (b) and (c).

Figure 6 (a) is the folding of the observed Lm LC onto the period P2. The systematic variation of the luminosity of the system in its quiescent state with this periodicity is seen unmistakably. Note that the period, as well as the phasing, are stable throughout the entire 92.37 years of the observations. They are undisturbed by the violent events of the outbursts that interrupted seven times the relative calmness of the system.
Fig. 6 (b) displays the observed Hm LC, folded onto the P3 period. It shows clearly that all the time points at which the star was brighter than -0.5 mag are concentrated within one and the same half of the P3 cycle. This demonstrates rather clearly that the brightening of the star in its outbursts occurs periodically also with a stable period P3 throughout the 92.37 years of the observations.
For comparison we show in Fig. 6 (c) the Hm LC folded onto the P2 periodicity. Here the distribution of the points is nearly homogeneous, indicating that the oscillations during outbursts are not modulated by the P2 period, the one that modulates the low state of the system.
3.4 Combination periods
Among the high peaks in the low frequencies end of the CLEAN PS of YY Her we found that peak No.13 corresponds to the period P13 2300 d which is the second harmonic of P1. We also found that P7 is the beat period of P1 and the beat period of P2 and P3. In frequency unit the relation is: f7 = f1-(f2-f3). We shall return to this relation in the following sections.
3.5 Period value determination
As described in Section 3.1, the low frequency oscillations of the star are dominated by the P1 periodicity, with an amplitude and structure that vary in time. The high frequency oscillations are dominated by the P2 and P3 periodicities, both having stable frequency throughout the entire 92.37 years time interval covered by the observations. While the frequencies are stable, the amplitudes are clearly not. Their ratio at low state are very different from the ratio in the high state.
In order to better determine the value of the three independent periods that we identify in the LC, we proceed as follows.
We consider three synthetic LC’s. One is a two term Fourier series with the P2 and P3 periodicities, representing the Hp LC. The second one is another two term Fourier series with the same pair of periods, representing the Lp LC. The third one is a three term Fourier series constructed with the periods P1, P1/2 and the period 1/(f1-(f2-f3)), as explained above, representing the RMLC. We look for the best simultaneous fit of the sum of these three synthetic LC’s to the observed one, in the least squares sense, from JD 2420000. In this fitting procedure there are three independent parameters, P1, P2 and P3.
Best fit is obtained with the following three values: P1=4650.7 35 d, P2=593.2 1.2 d and P3=551.4 1.4 d, that also imply P13=2325.4 d and P7=2917 d. The uncertainty estimates are explained in Section 3.6.
Similar results are obtained when the subdivision of the residual LC between HIGH and LOW curves is done by JD selection rather than by the P1 phasing (see Section 3.3).
The solid curve in Fig. 2 is the synthetic LC that is constructed with the above values of the three independent periods P1, P2 and P3 and of the two combinations made up from them, P7 and P13. Fig. 7 (a), (b), and (c) are blowups of three sections of the LC of Fig. 1, enabling a better appreciation by eye of the quality of the fit.

The curve in Fig. 3 (d) is the PS of the synthetic LC depicted as a solid line in Fig. 2 and 7. The discrete points used in the computation of this PS are the calculated magnitudes at the sampled times in the observed LC. There is a great similarity between this curve and the CLEAN LC of the observed data, curve b in Fig. 3. In particular, we found that 16 out of the 20 highest peaks in the PS of the observed LC have 16 counterparts among the 20 highest peaks in the PS of the synthetic LC. In counterparts, we mean frequencies that differ from each other by less than the inherent uncertainty in the frequency values which is 1/T, T being the length (in days) of the 92.37 years of the LC.
The conclusion of this section is that it is possible to construct with merely three independent periods, P1, P2 and P3, a time series that is very similar in its temporal behavior to the observed LC of YY Her. These results permit us to conclude that the presence of the three periods P1, P2 and P3, as well as P7 and P13 in the LC of YY Her may be considered as established (and see also Section 3.7).
3.6 Accuracy of P1, P2 and P3
In order to estimate the accuracy in our derived values of the three periods P1 P2 and P3 we performed a bootstrap analysis on the data (Efron & Tibshirani 1993). We subtract the value of the theoretical LC from the observed one at each time point of the observations. The set of the differences so created may be regarded as a sample of the noise values in the observations. We now construct a pseudo-observed LC by adding to each of the theoretical LC one number chosen randomly from this sample. On this pseudo-observed LC we apply the same period determination procedure that we have applied on the observed one, as described above. We obtain a set of three values for the three period P1, P2 and P3. We perform this process repeatedly 1000 times and obtain 1000 triplets of P1, P2 and P3 values. The central interval of a histogram that includes 950 of the P1 values so obtained may be considered the 95 percent uncertainty interval around the P1 value derived from the observed LC. The same goes for P2 and P3. These results are the period errors quoted in Section 3.5.
3.7 Stability of P1, P2 and P3
In view of the results presented in Section 3.2, particularly the folding of the observed LC as shown in Fig. 6 (c) and 6 (d), we may conclude that the two periods P2 and P3 preserve their frequency throughout the 92.37 years of the monitoring of the star. Each one of these cycles all but disappeared from the LC at certain epochs along the history, always reappearing at the same phase. Thus, the P3 period that dominates the oscillations during outbursts seems to be squelched at quiescence epochs. When it returns to the LC at the next outburst it appears with the same phasing as before. The same goes for P2. Upon returning to the LC after an outburst it appears with the same phase as before the outburst.
In order to check even further this claim we divided the entire LC into two distinct subsets, one of all points up to JD2440000, and the other of all the later points. The PS of each of these subsets is of course noisier than those presented in Fig. 3, especially that of the older set of the less numerous observations. However, the two peaks of the P2 and P3 periods are clearly distinguishable in both plots. Also the folding of the two subsets on either the P2 or the P3 periodicity show the same phasing as in Fig. 6.
These results indicate that each one of the clocks in the system that is responsible for one of these two cycles keeps a stable frequency, notwithstanding the dramatic variations that the system is undergoing, e.g. in its luminosity. We therefore suggest that the two clocks are the binary orbital cycle, as suggested by others (Munari et al. 1997), and the rotation period of the giant star of this system.
The P1 periodicity does not share the stability that characterizes the P2 and P3 periods. In fact an outburst event of the system seems to consist not of a rise in the DC output of the system but rather of a series of one to three violent oscillations of amplitudes that are significantly larger than the amplitude of the binary cycle. The fact that an outburst of YY Her is actually a series of violent oscillations is evident particularly in the later events, where the observational coverage is more dense (see Fig. 2). In these cases we see in particular that during outbursts, the brightness of the system is sometimes falling even below the mean brightness level of the quiescence state. Fig. 6 (b) shows that these oscillations have the P3 (and not P2) periodicity. The non stability of P1 is at least partly due to the fact that the P3 is indeed stable. Since the two periods are not commensurate, the onset of the outburst is not stable in the P1 phase space. Furthermore, as already mentioned, the number of P3 oscillations within a given outburst event, varies between one and three. This is another cause of the non stability of the P1 cycle.
The amplitude of the P3 oscillations within an outburst event is not constant and hence also the overall amplitude of the outburst events is clearly varying among the different cycles. Our reconstructed LC is unable to mimic the large upsurge in the luminosity observed in the first two recorded outbursts. We do note, however, that at least part of this discrepancy may be due to unknown errors in the measurements, as well in the zero term in the scaling of these observations that were made so many decades ago.
As discussed in Section 3.2, the P1 periodicity should be regarded as an average value of the quasi-periodic repetition time of the outbursts of the YY Her system. The meaning of the P1 period in the context of YY Her is therefore similar to the meaning of the well known and much in use period of 11.3 year of the solar activity cycle (see Section 4).
3.8 The Secondary Minima
The LC of YY Her contains additional evidence for the P3 periodicity, as well as for its interpretation as the rotational period of the giant component. In a series of photoelectric measurements performed along the last few binary cycles of the system, Hric et al. (2001) identified in two cycles secondary minima that appear in between successive primary minima. Mikolajewska et al. (2002) interpreted this signal as a trace of the well known ellipsoidal effect in binary stars.
In order to investigate this interpretation we consider now in details the last four cycles of the binary revolution before the onset of present day outburst, that are well covered observationally. We combine the photoelectric measurements of Munari et al. (1997), Tatarnikova et al. (2000), Hric et al. (2001), Mikolajewska et al. (2002) with the AAVSO published confirmed magnitudes. Fig. 8 presents the running mean of this LC with a 60 d wide running window. The arrows designate times of successive primary and secondary minima. The asterisks and the circles on the x axis of the figure indicate the times of the primary and of the secondary minima, respectively.
In the ellipsoidal scenario, the secondary minima in the LC of a binary system are seen when the longer axis of the elliptically structured giant star is pointing in the direction of the observer. At this phase the surface area of the giant that emits in this direction takes a minimum value. The bulge in the outer layers of the giant has a fixed direction in the binary rotating frame. Therefore, the frequency of the ellipsoidal effect should be the frequency of the orbital revolution, or rather twice this value.
The light variations due to the ellipsoidal effect are expected to be gradual entrance to and exit from the two minimum phases in the binary cycle. The structure of the LC seen in Fig. 8, in particularly around the secondary minima, is hardly having this structure.
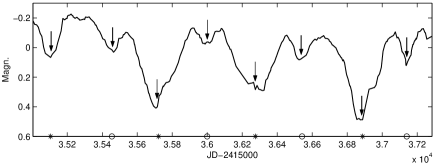
The arrows indicating the minima in Fig. 8 were positioned at mid points of the corresponding minimum profile, as judged by the eye. When we repeat the eye positioning a number of times, determining again the mid points independently, we find that the variations in the minimum times so determined are no larger than 6 d. The uncertainty in the computed mean time between successive minima is of the same order.
We find that the mean time difference between successive primary minima is 594.3 d, practically the same value of P2 derived for the quiescence state from the entire LC. The mean difference between secondary minima is 561.7 d, consistent with P3, and significantly different from P2. When we take as the time of each minimum simply the day of the lowest brightness value of the corresponding minimum event, the mean differences take the values 588 d and 557 d, respectively. This result seems to prove that the ellipsoidal effect cannot be responsible for the secondary minima.
Consistently with our previous suggestion that P3 is the rotation period of the giant, we propose here that the secondary minima result from star spots on the surface of the giant. For an a-symmetric lateral distribution of spots, as is the case for the sun and other stars, e.g. spotted G and K giants (Bopp & Rucinski 1981), periodic light variations at the rotation frequency are indeed expected. As stellar spots are not permanent features on the surface of the star, their light modulation at the rotation frequency, in amplitude as well as in phase, is expected to vary between different activity cycles of the star, and to some extent also within one and the same active cycle. This P3= 551.4 d modulation may also disappear completely from the LC, as was the case, up to the accuracy of the observations, during the previous quiescence state of the star. This would happen when the spots are distributed more evenly along the latitude coordinates of the rotating star.
Finally, we note that evidence for the P3 periodicity revealed in the time of the secondary minima is independent of the evidence for this periodicity that we found with our time series analysis presented in Section 3.3. There the P3 periodicity manifests itself mainly during the outburst state of the system, and through its beats with the other two periods of the system, as explained in that section. Indeed, the theoretical LC presented as the solid line in Fig. 2 and 7 does not show the secondary minima of the last quiescence time interval of the star. These minima appear in the LC due to the effect of the dark spots, which is not taken into account in our analysis of the LC in its entirety. This is quite appropriate since the spots are not always there and even when they appear, they do not preserve the phases of maxima and minima in the LC in different active cycles. The analysis presented in this section therefore provides additional, independent evidence for the P3 periodicity.
4 Discussion
The analysis performed in Section 3, revealed the presence of three independent periodicities in the historical LC of YY Her. The period P14650.7 d regulates the activity phases of YY Her. During the quiescence state of the system, the variation is modulated mostly with the P2593.2 d period, which is interpreted as the binary orbital period. However, the P3551.4 d period is also apparent in the last epoch of quiescence of the star through the secondary minima superposed on the P2 modulation. During the outburst epochs the system enters an oscillation mode with the P3 period, with an amplitude reaching 2 magn or more. This amplitude is more than twice the amplitude of the P2 orbital modulation. We interpret this modulation as due to the rotation period of the giant component, similar to the results for BF Cyg (paper I).
The thousand days time-scale of the P1 period is similar to that already detected for two symbiotic systems, namely for Z And, 8400 d (Formiggini & Leibowitz 1994) and more recently 6376 d for BF Cyg (paper I) . We already proposed the existence of a magnetic cycle in the cool giant component as the mechanism that regulates these multiple outbursts. In analogy with the sun and other late type stars, a magnetic dynamo process suggests itself as the cyclical generator of surface magnetic fields that regulate the activity of the star and in particular the mass-loss rate and the dynamics of the star wind. Note that magnetic activity in the giant component of symbiotics has already been invoked by Soker (2002) from a theoretical point of view.
There is theoretical and observational evidence for the presence of magnetic fields in some late-type giants, such as asymptotic-giant-branch stars (AGB). Observationally, magnetic fields are detected as the source of maser polarization found around AGB stars and of the X-ray emission measured for cool giant stars (Ayers, Brown & Harper 2003). Invoking dynamo action is also supported by theoretical models (Soker & Kastner 2003, Dorch 2004). Among many modes of dynamo action, Dorch (2004) recognizes an exponentially amplification of the magnetic field on a time scale of about 25 years.
This is the time scale of the outburst periodicity found by us for the three SS’s Z And, BF Cyg and YY Her.
4.1 Detailed Comparison with BF Cyg
In paper I we presented an analysis, similar to the analysis presented in this work, of a 104 year historical LC of the symbiotic star BF Cyg. As already mentioned in Section 1, BF Cyg and YY Her are quite similar to each other in some of their characteristics. Table 1 lists some of these features and gives their value in the two systems. Here we draw attention in particular to the similarities in the kinematical parameters.
The giant component in the two systems is rotating nearly synchronously with the orbital revolution. For BF Cyg, this result is consistent with the conclusion of Zamanov et al. (2006) on the rotation of the giant stars in symbiotic systems. The star YY Her was not investigated in that study.
Although from the point of view of the temporal evolution of circularization and synchronization of stellar binary systems, BF Cyg and YY Her may be considered as reaching synchronization, our results for the two stars indicate that in both cases a complete locking of the star spin rate has not been achieved yet. The difference between the spin and the orbital frequencies is less than 10 percent of their value. It is nonetheless rather significant, and has a profound effect on the physical processes that take place in the outer envelope of the giant.
The two systems differ from each other in the direction of the deviation from a full synchronization. In BF Cyg, the spin period, 798 d, is longer than the orbital period, 757 d. In YY Her the spin is faster. Its period is 551 d, as compared to the 593 d of the orbital period.
The gravitational pull of the hot component in the two stars excites a tidal wave in the atmosphere of the giant. If we assume that the rotation of the giant and the orbital revolution are in the same direction, then in the rotating frame of the BF Cyg giant, the sense of the tidal wave is pro-grade. For an observer on the surface of the giant of YY Her, on the other hand, the tidal wave is traveling in the opposite direction to the spin and to the orbital motion. This is indicated by the negative sign in Table 1.
A tidal wave in the outer layers of the giant is an additional, periodic, mostly radial motion in the equatorial plane of the atmosphere of the star. This is another important flow field, in addition to the differential rotation, the convection and the meridional flows that are considered responsible for the 11/22 years magnetic dynamo process in the sun (for a recent comprehensive review of models of the solar magnetic dynamo processes see Ossendrijver 2003). The sun itself does not possess it. In the two symbiotics, the effect of this additional motion on the dynamo process is manifested by additional modulation on the activity cycle of the stars, at the beat period of the cycle fundamental frequency f1 and the frequency of the tidal wave in the giant rotating coordinate system. Note that the beat frequency in both cases is the algebraic sum of the cycle frequency and the tidal wave frequency. In BF Cyg, where the tidal wave has a prograde motion, the two frequencies are added to each other with a positive sign. In YY Her, where the tidal wave motion is retrograde, its frequency is added to the fundamental frequency of the magnetic cycle with a negative sign. We shall not make an attempt here to explain these findings.
Another difference between the two stars is that in BF Cyg the spin and the orbital periods are modulating the system optical emission at quiescence, as well as during outbursts. Not so for YY Her where the orbital period manifests itself only at quiescence. The spin period is modulating the emission during outbursts, although at some epochs it also modulates the quiescence emission through dark spots on the surface of the giant. Table 1 summarizes the properties of BF Cyg and YY Her.
In paper I we proposed, following suggestions by other investigators (e.g. Mikolajewska & Kenyon 1992) that the main cause for the varying optical luminosity of BF Cyg during outbursts is in variations in the accretion rate onto the hot component of that system. If this is also the case in YY Her, the strong P3 modulation at the outbursts of this star implies that the accretion is modulated by the cool/donor component rotation frequency. However, if a beamed outflow of matter from the rotating giant is the triggering agent of an energy source in the vicinity of the hot component of the system, the expected periodicity should be the synodic period of the giant. If indeed this is the meaning of the P3= 551.4 d period, the sidereal rotation period of the giant must be the P=2917 d period. On the other hand, the secondary minima in the LC discussed in Section 3.8, and our interpretation of them as manifestations of dark spots on the surface of the rotating giant, would indicate that P3 is the sidereal rotation period of the star. We shall not try to resolve this difficulty in the framework of this paper.
The fact that in BF Cyg the giant spin rate is slower while in YY Her it is faster than the orbital angular velocity is of interest by itself. It may be relevant for the study of synchronization and circularization in close binary systems. It may also be of relevance within the general area of the dynamical evolution of interacting binary stars.
5 Summary
A 115 year light curve of the symbiotic star YY Her was analyzed. The mean optical brightness of the system was found to be declining at a constant rate of .01 magn in 1000 d. This suggests that YY Her should be reclassified as a symbiotic nova. The optical LC of the star is modulated by three independent periods, P1=4650 d, P2=593.2 d and P3=551.4 d. The first one is a mean time interval between successive outbursts of the star, of which 7.5 events have been recorded. We suggest that it is the period of a solar-type magnetic dynamo cycle operating in the outer envelope of the giant star of this system. P2 is the orbital revolution period. It modulates the luminosity of the star at quiescence states of the system. P3 is the rotation period of the giant star, modulating the emission during outbursts. At some quiescence epochs it also modulates the quiescence emission, probably through dark spots on the surface of the rotating giant. The difference between the spin and the orbital frequencies excites a tidal wave in the atmosphere of the giant. The LC of the system is also modulated at a frequency that is a beat of the magnetic dynamo frequency and the tidal wave frequency.
YY Her is the third symbiotic star exhibiting outburst events that occur at nearly constant frequency, with a characteristic repetition time of a few thousands days. Similarly with the star BF Cyg, YY Her shows that tides in the atmosphere of the magnetically active giant star affect significantly the dynamo process operating in this star.
In contrast to BF Cyg, the deviation from locked synchronization in the YY Her system is in the sense that the giant star is spinning with a higher angular velocity than that of the orbital motion. In BF Cyg it is the other way around.
| Table 1 Comparison of the properties of BF Cyg and YY Her | |||||
| BF Cyg | Ref. | YY Her | Ref. | ||
| Giant Sp. Type | M5 III | 1 | M4 III | 1 | |
| Luminosity L | Lo | 5200 | 2 | 1100 | 2 |
| Binary period | P2 | 757.3 | 3 | 593.2 | 4 |
| Giant Spin period | P3 | 798.8 | 3 | 551.4 | 4 |
| Tidal wave period | Pt | 14580 | 3 | -7825 | 4 |
| Solar-type period | P1 | 5375 | 3 | 4650 | 4 |
| Beat period | Pb | 4436 | 3 | 2917 | 4 |
1) Műrset & Schmid (1999) 2) Műrset et al. (1991) 3) Leibowitz & Formiggini (2006) 4) This paper
Acknowledgments
We acknowledge with thanks the variable star observations from the AAVSO International Database contributed by observers worldwide and used in this research.
This research is supported by ISF - Israel Science Foundation of the Israeli Academy of Sciences.
References
- (1) Ayers T.R., Brown A., Harper G.M., 2003, ApJ, 598 , 610
- (2) Bopp B.W., Rucinski S.M., 1981, in Fundamental Problems in the Theory of Stellar Evolution, IAU Symp. 93, 177, G. Sugimoto, D.G. Lamb, D.N. Schramm, Eds., Reidel, Dordrech
- (3) Efron B., Tibshirani R.J., 1993, An Introduction to the Bootstrap, Chapman & Hall, New York, London
- (4) Dorch S.B.F., 2004, A&A, 423, 1101
- (5) Formiggini L., Leibowitz E.M., 1994, A&A, 292, 534
- (6) Hric L., Petrik, K., Niarchos P., 2001, IBVS 5046
- (7) Kenyon S.J., 1986 The symbiotic stars, Cambridge Univ. Press., 208 Cambridge and New York
- (8) Kenyon S.J., Webbink R.F., 1984, ApJ, 279, 252
- (9) Leibowitz E.M., Formiggini L., 2006, MNRAS, 366, 675 (paper I)
- (10) Lorente R., Montesinos B., 2006, ApJ, 632, 1104
- (11) Mikolajewska J, Kenyon S.J. 1992, MNRAS, 256, 177
- (12) Mikolajewska J., Kolotilov E.A., Shugarov S. Yu., Yudin B.F., 2002, A&A, 392, 197
- (13) Munari U. et al., A&A, 1997, 323, 113
- (14) Műrset U., Nussbaumer H., Schmid, H. M., Vogel M., 1991, A&AS, 248, 458
- (15) Műrset U., Schmid, H. M., 1999, A&AS, 137, 473
- (16) Roberts D.H., Lehár J., Dreher J.W., 1987, A.J., 93, 968
- (17) Ossendrijver M., 2003, A &A Rev, 11, 287
- (18) Rogers M.L., Richards M.T., Richards D. St.P., 2006, astro- ph/0606426
- (19) Scargle J.D., 1982, Ap J., 263, 835
- (20) Schwarzenberg-Czerny A., 1989, MNRAS, 241, 153
- (21) Soker N., 2002, MNRAS, 337, 1038
- (22) Soker N., Kastner J.H. 2003, ApJ, 592, 498
- (23) Tatarnikova A.A., Rejkuba M., Buson L.M., Kolotilov E.A., Munari U., Yudin B.F., 2000, Astron. Rep., 44, 190
- (24) Zamanov R.K., Bode M.F., Melo C.H.F., Bachev R., Gomboc A., Porter J., Pritchard J., 2006, astro-ph/0603415