The correlation in Nearby Early-Type Galaxies
Abstract
Early-type galaxy velocity dispersions and luminosities are correlated. The correlation estimated in local samples ( Mpc) differs from that measured more recently in the SDSS. This is true even when systematics in the SDSS photometric and spectroscopic parameters have been accounted-for. We show that this is also true for the ENEAR sample if galaxy luminosities are estimated using distances which have been corrected for peculiar motions. We then show that, because the estimate of the ‘true’ distance is derived from a correlation with velocity dispersion, in this case the relation, using it in the relation leads to an artificially tight relation with a biased slope. Making no correction for peculiar velocities results in a relation which is very similar to that of the SDSS, although with larger scatter. We also measure the correlation in a mock ENEAR catalog, in which the underlying galaxy sample has the same correlation as seen in the SDSS. The mock catalog produces the same relation as the data, the same biased slope when distances are used to estimate luminosities, and good agreement with the input relation when redshift is used as the distance indicator. This provides further evidence that the true relation of ENEAR galaxies is indeed very similar to that of SDSS early-types. Our results suggest that local relations which are based on Fundamental Plane distances should also be re-evaluated. Our findings also have important implications for black hole demographics; the best direct estimates of the masses of supermassive black holes come from local galaxies, so estimates of the black hole mass function are more safely made by working with the correlation than with .
Subject headings:
galaxies: elliptical — galaxies: fundamental parameters — galaxies: photometry — galaxies: spectroscopy — black hole physics1. Introduction
The luminosities and velocity dispersions of early-type galaxies are strongly correlated: their logarithms follow an approximately linear relation (e.g. Faber & Jackson 1976). There is a long and complicated history of what the slope of this relation is, mainly due to the fact that, if there is intrinsic scatter around this correlation, then there are at least three interesting slopes: that obtained from fitting the mean luminosity at each velocity dispersion, , the mean velocity dispersion as a function of luminosity, , and the slope of the principal axis of the joint distribution of and (e.g. Lynden-Bell et al. 1988; Saglia et al. 2001). The first of these allows one to use to predict , whereas the second must be used if one wishes to predict from . Until recently, authors were not careful to distinguish between these cases.
Because depends on the distance to the source, whereas does not, it is straightforward to estimate from flux limited samples; naive estimates of the other two correlations are compromised by selection effects. Most studies of this correlation, based on local samples, agree that the typical velocity dispersion at fixed luminosity, , scales as : . The common unfortunate abuse of jargon is to say that luminosity scales as the fourth power of velocity dispersion; in fact, is considerably shallower. In what follows, we will be almost exclusively concerned with how well can be used as a predictor for : .
Prior to the year 2000, studies of the correlation were restricted to local samples (from within about 50 Mpc) containing objects. The SDSS provided a sample of early-type galaxies that was larger by about two orders of magnitude (Bernardi et al. 2003a): objects drawn from a volume which extended to considerably larger distances (median redshift ). However, the relation in this sample,
| (1) |
with an intrinsic scatter of about 0.07 dex is inconsistent with that found in local samples. For example, at , the relation which Forbes & Ponman (1999) found best fits the Pruniel & Simien (1996) sample of 236 local early-type galaxies differs from the SDSS fit by more than 0.05 dex. Expressed in terms of absolute magnitudes, the fits differ by more than 0.5 mags at . This is substantially larger than expected given the measurement errors. What causes this difference?
Because the SDSS luminosities and velocity dispersions are obtained from an automated pipeline, (i.e., light profiles and spectra were not inspected individually), it may be that, say, the SDSS measurements differ systematically from those estimated for local objects in the literature. Indeed, it is known that the SDSS photometric reductions underestimate the luminosities of objects in crowded fields (Mandelbaum et al. 2005; Bernardi et al. 2006a; Hyde et al. 2006; Lauer et al. 2006). See the Appendix for a more detailed discussion. The Appendix also shows that the SDSS also slightly overestimates the velocity dispersions at small . In what follows, we will refer to the sample in which these systematics have been accounted-for as the SDSS-B06 sample (see the Appendix). In the SDSS-B06 sample,
| (2) |
with intrinsic scatter of 0.07 dex; it happens that this is not very different from the relation obtained by Bernardi et al. (2003b).
A common problem from which all local samples suffer is that, while the apparent magnitude of an object can be measured quite accurately, the absolute magnitude is more difficult because it depends on the distance to the galaxy. The true distance is difficult to measure because the redshift, which is usually well-determined, is a combination of the distance to the galaxy and the component of its peculiar velocity which is directed along the line of sight to the observer: . Typical velocities are expected to be of order a few hundred km s-1, so the redshift is a reliable distance indicator only beyond about Mpc. Most of the objects in the SDSS lie well beyond this distance, whereas all local samples are shallower. Thus, a legitimate concern is whether uncertainties in estimating the true distance are driving the difference between the SDSS measurement and those which are based on more local samples.
To address such concerns, we have studied the relation in the definitive sample of nearby early-type galaxies—that assembled in the ENEAR database (da Costa et al. 2000; Bernardi et al. 2002a; Alonso et al. 2003; Wegner et al. 2003). ENEAR contains about 1000 objects out to 7000 km s-1, for which measured redshifts and estimated distances are available. Section 2 shows how the relation changes if one uses the redshift rather than the estimated distance when computing . It highlights the fact that, if played a role in determining the distance, e.g. if the distance comes from a Fundamental Plane or analysis, then the relation may be biased. In Section 3 we discuss our results.
2. The local relation
The first part of this section compares various determinations of the local relation. The second part compares these determinations with that from the SDSS-B06.

2.1. ENEAR
The ENEAR sample (da Costa et al. 2000) is approximately magnitude limited to 14.5 in the B band. The catalog provides new apparent magnitudes, measurements, redshifts, and velocity dispersions for about 1000 early-type galaxies distributed over the whole sky out to about 7000 km s-1.
In principle, estimating in the ENEAR sample is straightforward because the ENEAR team has also published a measurement of the correlation:
| (3) | |||||
(Bernardi et al. 2002b), with a scatter of 0.2/ln(10) dex. Here, is that angular scale within which the average surface brightness in the Rc band is 19.25 magarcsec2. For reasons we describe below, we compute luminosities for the ENEAR galaxies based on two different distance estimates. One uses this relation to estimate ‘true’ distances, and the other uses the redshift as a distance indicator (i.e., this second distance estimate ignores peculiar velocities). We will refer to the associated luminosities as and . In addition, for ease of comparison with the SDSS, we shift all magnitudes from ENEAR to SDSS .
The joint distribution of and which results from using the distance estimate (filled circles) is shown in Figure 1. Here we only show galaxies which have both spectroscopy and photometry observed by the ENEAR team (i.e. we did not include measurements listed in the ENEAR catalog which were compiled from previous work). In addition, we selected galaxies with disk-to-bulge ratio smaller than 0.5 and used the total magnitude listed by Alonso et al. (2003) (using the bulge luminosity the results only slightly change). Dashed line shows
| (4) |
which best-fits the sample. Comparison with equation (2) shows that this relation is considerably steeper than in the SDSS.
The observed scatter around this relation is dex. This is about 0.01 dex larger than what SDSS reports as intrinsic scatter. This is remarkable, because ENEAR ought to be carrying distance errors of about twenty percent. These errors ought to translate into increased scatter of 0.43 mags along the x-axis of Figure 1. If not accounted-for (and the fit above does not), this should have artificially decreased the slope and increased the scatter of the correlation. E.g., adding this scatter to the SDSS numbers would have decreased the magnitude of the slope by about fifteen percent, and the rms scatter around the new relation would have been about fifteen percent larger.
2.2. To remove or not to remove ?
Since the estimate of the distance is only good to 20 percent, one might well wonder if samples like ENEAR reach distances at which the redshift itself provides a more reliable estimate of the true distance than relations like or the Fundamental Plane. This will happen on scales where . This suggests that, beyond about Mpc, the redshift may actually be a better estimate of the true distance even if typical line-of-sight peculiar velocities were as high as 1000 km s-1.
Since ENEAR straddles this distance regime, we have studied what happens to the relation when the redshift itself is used as an estimate of the distance—i.e., no correction is made for the peculiar velocity. The inferred relation, when the total luminosity is used,
| (5) |
is shown as the dashed line in Figure 1. The relation obtained when the total luminosity is scaled to the bulge luminosity
| (6) |
is shown as the dotted line. The two relations are similar. Equation 5 is considerably shallower than (equation 4), with substantially larger scatter (0.12 dex).

Comparison of the relation based on redshift, say, with the one based on distances, , shows that the scatter appears to decrease considerably when using the distances rather than the redshifts. While it is tempting to conclude that this is signalling that the distance indicator is accurate, this is not the full story. After all, the distance estimate is actually a function of : distance . As a result, appears in both axes of Figure 1, with the x-axis proportional to . Therefore, scatter in the relation will be correlated along a line which has slope . A slope of is not far-off the one actually observed. Hence, it may be that the relation shown in Figure 1 and quantified by equation (4) is both biased and artificially tight. Note that similar concerns would also apply to the use of Fundamental Plane-based distance estimates (such as those used by Pruniel & Simien 1996), since the coefficient of the velocity dispersion in the direct fit is also (e.g. Jørgensen et al. 1996; Bernardi et al. 2003c). This discussion provides another reason why the simple procedure of using the redshift as the distance indicator might actually be the preferred one.
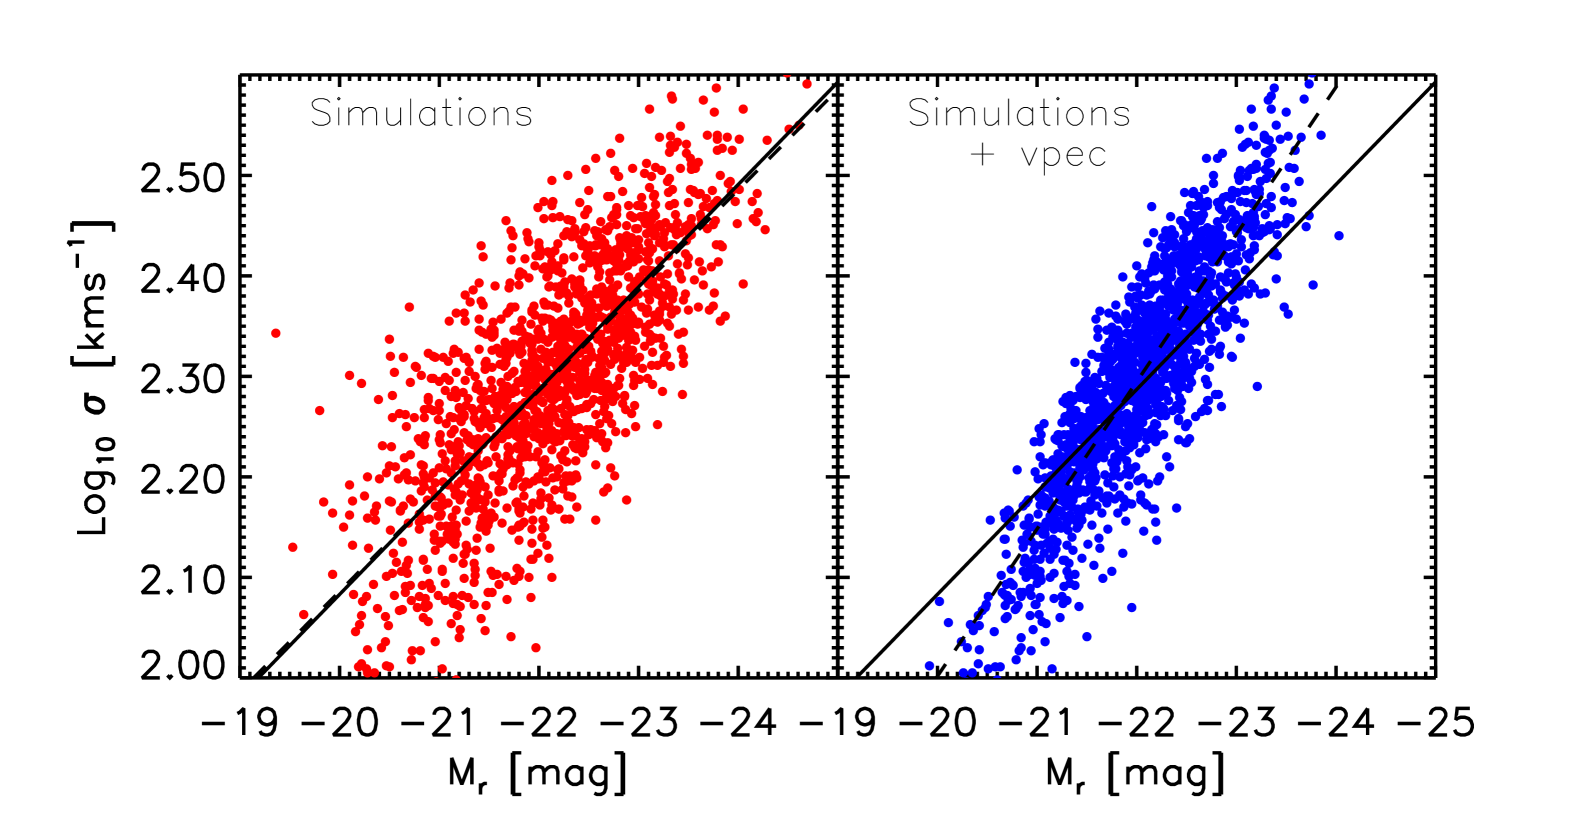
2.3. Results from a mock ENEAR-SDSS catalog
To better understand the effect of using a -based distance estimate on the relation, we constructed a mock catalog of the ENEAR sample. This was done by assuming that the joint distribution in luminosity, size and velocity dispersion for ENEAR galaxies is the same as for SDSS-B06 galaxies, so we could simply follow the steps described by Bernardi et al. (2003b). We then added Gaussian noise with dispersion equal to the ENEAR observational estimates, and applied the ENEAR apparent magnitude and redshift cuts.
Since this method allows us to generate both and a half-light radius , the assumption that the light profile is deVaucoleur allows us to compute a value of for each mock galaxy. We then fit for the relation, finding that it had slope 1.15, zero-point 1.4 and rms scatter 0.1 dex. These values are rather similar to equation (3), suggesting that our mock catalog is actually rather realistic.
Figure 2 compares the and relations in the mock catalog; the relation based on the distance indicator is clearly steeper and tighter than the one based on the redshift, just as in the ENEAR sample itself. Moreover, notice that the slope of relation is clearly steeper than the input slope, whereas is in rather good agreement with the input relation. This suggests that equation (5) is closer to the true relation for ENEAR galaxies than is equation (4). This bias does not depend strongly on the range of apparent magnitudes in the sample. It does depend on the intrinsic distribution of the absolute magnitudes. When the absolute magnitude range is large then the slope of the relation is closely related to that of the relation (see discussion in previous subsection) and has little scatter. However, when the luminosity function is narrow (i.e. sharply peaked) then the relation shows larger scatter: while the slope is still biased it is less easily related to that of the relation.
2.4. Comparison with SDSS-B06
The analysis above suggests that the relation in ENEAR, and, by extension, other local samples, are likely to be more reliable than the local relations. Figure 3 shows the joint distribution of and in the ENEAR sample when the luminosity is computed using the redshift distance; i.e., the distance has not been corrected for peculiar motions. The dashed line shows equation (5), and the dotted line shows the result of using bulge rather than total luminosities for ENEAR.
These fits should be compared to the solid line, which shows the SDSS-B06 relation (equation 2), for which the redshift is an excellent indicator of the true distance. Note that the ENEAR and SDSS-B06 samples are in excellent agreement, suggesting that correcting for peculiar motions in local samples can lead to serious biases in correlations which involve .
3. Discussion
We showed that the ENEAR relation, where indicates that the luminosity is based on a distance estimate which has been corrected for peculiar motions, is almost certainly biased. This is because the distance indicator used to estimate depends on . We also showed that if the redshift is used as the distance indicator (i.e., no correction for peculiar motions is made) then the resulting relation, while noisier, is less likely to be biased. The ENEAR relation is in excellent agreement with that measured in the SDSS, where neglecting peculiar velocities is an excellent approximation. Thus, it appears that the discrepancy between the SDSS relation and that in local samples is due to the use of a distance indicator which correlates with .
Our results are of particular interest for the problem of estimating black hole abundances from the observed distribution of luminosities or velocity dispersions (e.g. Yu & Tremaine 2002; Shankar et al. 2004; Tundo et al. 2006). The first method requires whereas the second requires . The two approaches will only give the same estimate of if the relation of the black hole sample is the same as that of the sample from which the luminosity function and velocity dispersion function are drawn. Current black hole samples are relatively local, so their correlations are very different from that of the SDSS. Bernardi et al. (2006b) suggests that current black hole samples are biased towards objects with abnormally large velocity dispersions for their luminosities. If this is a selection rather than physical effect, then the and relations currently in the literature are also biased from their true values. Bernardi et al. find that the bias in the relation is likely to be small, whereas the relation is biased towards predicting more massive black holes for a given luminosity. Therefore, the estimate based on the velocity function (e.g. that of Sheth et al. 2003) is to be preferred.
The relations show evidence for a flattening at large , a fact we do not use here, but which is relevant to studies of BCGs (e.g. Bernardi et al. 2006a) and may be relevant to studies of black hole demographics.
References
- (1) Adelman-McCarthy, J. et al. 2006, ApJS, 162, 38
- (2) Alonso, M. V., Bernardi, M., da Costa, L. N., Wegner, G., Willmer, C. N. A., Pellegrini, P. S., & Maia, M. A. G. 2003, AJ, 125, 2307
- (3) Bernardi, M., Alonso, M. V., da Costa, L. N., Willmer, C. N. A., Wegner, G., Pellegrini, P. S., Rité, C., & Maia, M. A. G. 2002a, AJ, 123, 2990
- (4) Bernardi, M., Alonso, M. V., da Costa, L. N., Willmer, C. N. A., Wegner, G., Pellegrini, P. S., Rité, C., & Maia, M. A. G. 2002b, AJ, 123, 2159
- (5) Bernardi M., Sheth R. K., Annis J., et al. 2003a, AJ, 125, 1817
- (6) Bernardi, M., Sheth, R. K., Annis J. et al. 2003b, AJ, 125, 1849
- (7) Bernardi, M., Sheth, R. K., Annis J. et al. 2003c, AJ, 125, 1866
- (8) Bernardi, M., Hyde, J. B., Sheth, R. K., Miller, C. J., Nichol, R. C. 2006a, AJ, in press (astro-ph/0607117)
- (9) Bernardi, M., Sheth, R. K., Tundo, E., & Hyde, J. B. 2006b, ApJ, submitted (astro-ph/0609300)
- (10) da Costa, L. N., Bernardi, M., Alonso, M. V., Wegner, G., Willmer, C. N. A., Pellegrini, P. S., Rité, C., & Maia, M. A. G. 2000, AJ, 120, 95
- (11) Desroches, L., Quataert, E., Ma, C., & West, A. A. 2006, MNRAS, submitted (astro-ph/0608474)
- (12) Faber, S. M. & Jackson, R. 1976, ApJ, 204, 668
- (13) Forbes, D. A., & Ponman, T. J. 1999, MNRAS, 309, 623
- (14) Hyde, J. B., Bernardi, M., Sheth, R. K. et al. 2006, AJ, submitted
- (15) Jørgensen, I., Franx, M., & Kjærgaard, P. 1996, MNRAS, 280, 167
- (16) Lauer, T. R., et al. 2006, ApJ, submitted (astro-ph/0606739)
- (17) Lynden-Bell, D., Faber, S. M., Burstein, D., Davies, R. L., Dressler, A., Terlevich, R. J., & Wegner, G. 1988, ApJ, 326, 19
- (18) Mitchell, J. L., Keeton, C. R., Frieman, J. A., & Sheth, R. K. 2005, ApJ, 622, 81
- (19) Prugniel, P., & Simien, F. 1996, A&A, 309, 749
- (20) Saglia, R. P., Colless, M., Burstein, D., Davies, R. L., McMahan, R. K., & Wegner, G. 2001, MNRAS, 324, 389
- (21) Shankar, F., Salucci, P., Granato, G. L., De Zotti, G., & Danese L. 2004, MNRAS, 354, 1020
- (22) Sheth, R. K., Bernardi, M., Schechter, P. L., et al., 2003, ApJ, 594, 225
- (23) Tundo, E., Bernardi, M., Hyde, J. B., Sheth, R. K., & Pizzella, A. 2006, ApJ, submitted (astro-ph/0609297)
- (24) Wegner, G., Bernardi, M., Willmer, C. N. A., da Costa, L. N., Alonso, M. V., Pellegrini, P. S., & Maia, M. A. G. 2003, AJ, 126, 2268
- (25) Yu, Q., & Tremaine, S. 2002, MNRAS, 335, 965
Appendix A Comparison of the relation in various SDSS data releases
Bernardi et al. (2003b) report the first SDSS-based relation, from a sample of about objects classified as being early-types on the basis of imaging (concentrated light profiles) and spectroscopy (weak or no emission lines): hereafter, we will refer to this sample as SDSS-B03.
A.1. Changes to SDSS photometry
Shortly after this estimate was published, the SDSS reported a problem with the point-spread-function in the SDSS photometry which led, on average, to an overestimate of the apparent brightness of extended objects and larger effective radii. This problem was fixed in subsequent SDSS data releases. However, more recent work has shown that there remain a problem with the SDSS photometric reductions which is most severe for bright objects in crowded fields (the SDSS pipeline overestimates the sky level; see Mandelbaum et al. 2005; Bernardi et al. 2006a; Lauer et al. 2006). Re-analysis of such objects (Bernardi et al. 2006a; Hyde et al. 2006) suggests that the SDSS-DR5 photometric reductions underestimate the true apparent brightness by 0.1 mags on average, and by up to 0.5 mags for bright objects in crowded fields (by chance the combination of the two problems make the magnitudes in Bernardi et al. 2003a to be similar to the recomputed values by Hyde et al.).
These changes in the photometric reductions affect the estimated in the relation. They also have a small effect on , because the velocity dispersions are scaled (to account for aperture effects) to a fraction (typically 1/8) of the half light radius, and the half light radii are about 15% smaller than in Bernardi et al. (2003a). This aperture correction is small, so the change to the relation is driven by the change to .
A.2. Changes to SDSS spectroscopy
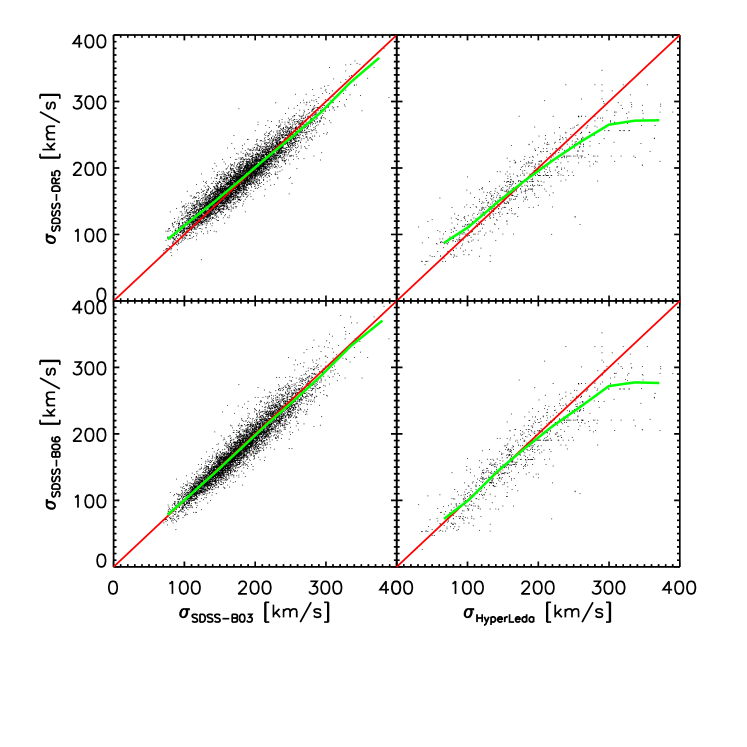
In addition, the SDSS spectroscopic reductions appear to have changed between Bernardi et al. (2003a) and DR5. The left-hand panel of The top left panel in Figure 4 shows that in the SDSS-DR5 for the SDSS-B03 sample do not match the values used by Bernardi et al. (2003a). The difference is small but systematic, with SDSS-DR5 being larger than SDSS-B03 at small . Since there is considerably more overlap between measurements from the literature (from the HyperLeda database) with SDSS-DR5 than with SDSS-B03, we have checked if the SDSS-DR5 velocity dispersion values are biased at low . The top right hand panel of Figure 4 shows that SDSS-DR5 is biased towards larger at km s-1; The bias is similar to that seen on the top left panel.
The SDSS-DR5 values are based on averaging the measurements from the Direct-Fitting and Fourier-fitting methods (Bernardi et al. 2003a). We have run simulations similar to those in Bernardi et al. (2003a) and found that the discrepancy results from the fact that the Fourier-fitting method is now biased level at low sigma (), whereas the other method is not. The bottom panels of Figures 4 shows that using only the Direct-Fitting method improves the agreement between SDSS-DR5 and SDSS-B03 as well as between SDSS-DR5 and HyperLeda.
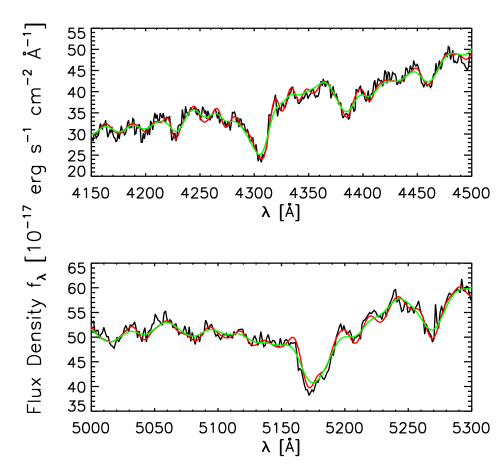
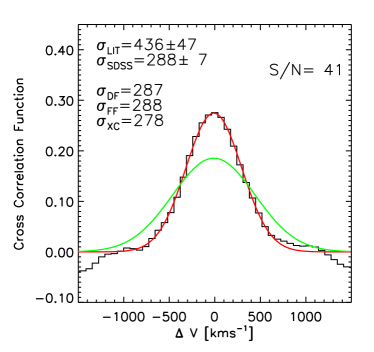
The right panels in Figure 4 show that HyperLeda reports substantially larger velocity dispersions at km s-1. Figures 5 and 6 suggest that, in this case, SDSS is more reliable than HyperLeda (these figures are a representative example; we have checked all galaxies with velocity dispersion larger than km s-1). This is important, because the objects with the largest are expected to host the most massive black holes. If the SDSS determinations were indeed biased low, then determinations of black hole abundances which are based on the SDSS velocity function (Sheth et al. 2003) would underestimate the abundances of supermassive black holes (e.g. McClure & Dunlop 2004; Shankar et al. 2004; Tundo et al. 2006). Our analysis shows that this is not a concern.
A.3. The SDSS-B06 sample and the relation
Because of the problems with the SDSS photometry and spectroscopy, we have chosen to use our new estimate of the relation. We selected the SDSS-B03 sample of early-type galaxies. For the photometry, we use the reductions from Hyde et al. (2006). For the velocity dispersions, we use the Direct-Fitting method described above, but do not average it with the Fourier-fitting method (as done for the values in the SDSS database). In the main text, we refer to the catalog which results as the SDSS-B06 sample.
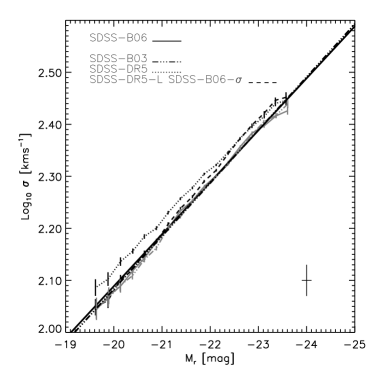
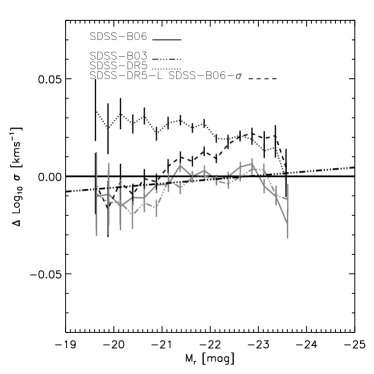
The main text studies the relation. Figure 7 illustrates the effect of these various SDSS reductions on this relation. In all cases, straight lines show single power-law fits to , and jagged lines show the median as a function of for a few bins in . To highlight the differences, the y-axis in the left hand panel shows , rather than itself, as a function of . The triple-dot dashed lines show the relation reported by Bernardi et al. (2003b), and the dotted lines show fits based on quantities output by SDSS-DR5 (corrected for aperture effects to ). The short dashed lines are based on SDSS-DR5 photometry, but use the SDSS-B06 dispersions (to approximately correct for the small systematic bias in SDSS-DR5 s), and solid lines show the result of recomputing the photometry as well as the velocity dispersions (the SDSS-B06 sample).
The relations from SDSS-B03 and SDSS-B06 are rather similar (the various adjustments to the SDSS-B03 photometry approximately cancel). Notice that all these relations show evidence for a flattening at large , a fact we do not use in the main text, but which is relevant to studies of BCGs (e.g. Bernardi et al. 2006a) and may be relevant to studies of black hole demographics.
A.4. Object by object comparison with ENEAR
The main text compares the relation in the SDSS-B06 and ENEAR samples. In the remainder of this section we provide an object by object comparison of the two sets of photometric and spectroscopic reductions. We began by matching the two catalogs: only about 50 objects with ENEAR imaging and/or spectroscopy were also in the SDSS-DR5 sample. This surprisingly small number is because the ENEAR objects are, in general, very bright and very large compared to the vast majority of objects targeted for SDSS spectroscopy. Of these, 30 have ENEAR velocity dispersions and 29 have ENEAR photometry, but only 15 have both.
Figure 8 compares the ENEAR and the Direct-Fitting estimates of the velocity dispersions of the 30 objects which have ENEAR spectroscopy available. The estimates are generally in good agreement, suggesting that SDSS-B06 velocity dispersions are unlikely to be systematically biased with respect to local samples. Therefore, the discrepancy in the relation is almost certainly due to systematic errors in the luminosity.
Such errors could arise from systematic differences in the photometry itself, or in the conversion from apparent to absolute magnitude. To test this, Figure 8 compares the ENEAR and Hyde et al. estimates of the apparent magnitudes for 29 galaxies which have ENEAR imaging available. Whereas Hyde et al. reports a magnitude associated with fitting a single deVaucoleur profile to the image, ENEAR reports both total (filled circles) and bulge (open diamonds) magnitudes. The figure indicates that Hyde et al. magnitudes tend to be similar to the ENEAR total magnitudes, and about 0.12 mags brighter than ENEAR bulge magnitudes. Here we compare galaxies dominated by the bulge component (i.e. with disk-to-bulge ratio less than 0.5).
Figure 9 shows the relation for objects with both ENEAR imaging and spectroscopy in common with SDSS. It is in reasonably good agreement with the SDSS-B06 relation.


