The Spitzer-IRS spectrum of SMP LMC 11
Abstract
We present the first mid-infrared spectra of SMP LMC 11 in the Large Magellanic Cloud. While this object resembles a planetary nebula in the optical, its infrared properties are more similar to an object in transition from the asymptotic giant branch to the planetary nebula phase. A warm dust continuum dominates the infrared spectrum. The peak emission corresponds to a mean dust temperature of 330 K. The spectrum shows overlapping molecular absorption bands from 12 to 17 m corresponding to acetylene and polyacetylenic chains and benzene. This is the first detection of C4H2, C6H2, C6H6 and other molecules in an extragalactic object. The infrared spectrum of SMP LMC 11 is similar in many ways to that of the pre-planetary nebula AFGL 618. The IRS spectrum shows little evidence of nitrogen-based molecules which are commonly seen in Galactic AGB stars. Polycyclic aromatic hydrocarbons are also absent from the spectrum. The detection of the [Ne II] 12.8 m line in the infrared and other forbidden emission lines in the optical indicates that an ionized region is present.
Subject headings:
circumstellar matter — infrared: general — ISM: molecules — ISM: lines and bands — planetary nebulae: individual (SMP LMC 11) — stars: AGB and post-AGB1. Introduction
The transition from the asymptotic giant branch (AGB) to the planetary nebula (PN) phase remains an elusive stage in stellar evolution. At the end of its lifetime on the AGB, a star loses mass at high rates, triggering the formation of molecules and dust in a thick circumstellar envelope (e.g. Habing, 1996; Blommaert et al., 2005). Radiation pressure on the dust and coupling between the dust and gas drive the outflows, stripping the star and exposing its hot core. As the effective temperature of the exposed core rises, it will ionize the nebular gas.
The detailed chemistry involved in this brief transition phase is poorly understood. In carbon-rich stars, carbon is primarily incorporated first into carbon monoxide (CO) and then into acetylene (C2H2). Acetylene and its derivatives are the precursors from which carbon-based compounds such as polycyclic aromatic hydrocarbons (PAHs) and soot are formed (Allamandola et al., 1989; Frenklach & Feigelson, 1989). Here, we present the infrared spectrum of SMP LMC 11, an object in the Large Magellanic Cloud (LMC) whose infrared spectral characteristics fall in the stage where most of this complex chemistry takes place.
SMP LMC 11 was part of the Sanduleak et al. (1978) survey of PNe in the Magellanic Clouds (from which it takes its designation, SMP LMC 11). It was also included in the catalogue by Leisy et al. (1997) of accurate positions of known PNe in the LMC. The reported H flux and extinction vary among papers in the literature. For instance, Leisy & Dennefeld (2006), Wood et al. (1987) and Meatheringham et al. (1988) report a log(H)=13.14 (with H in units of erg cm2 s-1), whereas Shaw et al. (2006) obtain log(H)=13.94. Similarly, differences in visual extinction amount to a factor of more than 3. The presence of another source nearby in the IRAC images (see §2) may explain these discrepancies. Morgan & Parker (1998) presented optical spectroscopy of 97 faint PNe including SMP LMC 11 and identified the forbidden emission lines of [O III], [N II] and [S II]. Recently Shaw et al. (2006) observed it with the Hubble Space Telescope (HST) as part of their sample of objects in the LMC and SMC. They measured the strength of the [O I] line, along with the previously identified forbidden lines, and inferred a bipolar morphology with a size of 0.76″0.55″.
In this letter we report the first mid-infrared spectrum of SMP LMC 11. The spectrum reveals a wealth of molecular absorption bands and a few atomic emission lines. To our knowledge, the only other object showing a similar infrared spectrum is the Galactic pre-planetary nebula111We adopt the term “pre-planetary nebula” to avoid the confusing term “protoplanetary nebula,” which could imply an object evolving into a PN or a nebula with embedded protoplanets. (PPN) AFGL 618. Bujarrabal et al. (1988) inferred that AFGL 618 became a PPN only 200 yr ago. Chiar et al. (1998) identified simple aliphatics (CH2, CH3) in its spectrum at 3.4 m. Cernicharo et al. (2001a) studied the spectrum of AFGL 618 from the Short-Wavelength Spectrometer (SWS, de Graauw et al., 1996) on the Infrared Space Observatory (ISO, Kessler et al., 1996), and they describe the system as having a thick molecular envelope surrounding a B0 star and an ultra-compact H II region. They suggest that UV radiation from the central star and shocks in the high-velocity winds have significantly modified the chemistry. Cernicharo et al. (2001a) detected C4H2, C6H2 and of C6H6 in a circumstellar environment for the first time. In this letter we compare the observed features in SMP LMC 11 to those of AFGL 618.
The next section describes the observations and the data reduction techniques. §3 gives the analysis of the observed spectral features and compares SMP LMC 11 to AFGL 618. §4 discusses the evolutionary status of the object.
2. Observations and data reduction
We observed SMP LMC 11 with the Infrared Spectrograph (IRS, Houck et al., 2004) on board the Spitzer Space Telescope (Werner et al., 2004) as part of the GTO program on 2005 June 6 (Program ID 103, AORkey 4947712). These observations consist of spectra from all four IRS modules: Short-Low (SL), Long-Low (LL), Short-High (SH), and Long-High (LH). Table 1 gives the wavelength coverage, spectral resolution and integration times for each module. We performed peak-up on a nearby star to achieve accurate pointing (0.4).
| Module | Order | Wavelength (m) | Resolution | Obs. timeaaOn-source observation time in seconds number of cycles. |
|---|---|---|---|---|
| SL | 1 | 7.5–14.5 | 60-120 | 142 |
| SL | 2 | 5.0–7.5 | 60-120 | 142 |
| LL | 1 | 20–40 | 60-120 | 301 |
| LL | 2 | 14.5–20 | 60-120 | 301 |
| SH | 11 to 20 | 10–20 | 600 | 601 |
| LH | 11 to 20 | 20–36 | 600 | 1201 |
The data were processed through a copy of the Spitzer Science Center’s pipeline reduction software (version S13.2) maintained at Cornell. To avoid possible problems in the flatfield, we chose to start the reduction analysis from the unflatfielded (droopres) images. From there, the reduction and extraction techniques were carried out as follows: Rogue pixels and flagged data were removed using the irsclean222This tool is available from the SSC website: http://ssc.spitzer.caltech.edu tool, which uses a mask of rogue pixels for each campaign to first flag and then remove rogue pixels. These rogue pixels are especially troublesome in LH. To remove the contribution from the background in the low-resolution modules (SL and LL) the images were differenced nodnod (e.g. SL1 nod 1SL1 nod 2). Spectra were extracted from the images using a script version of the Cornell-developed software package SMART (Higdon et al., 2004), using variable-column extraction for SL and LL, and full-slit extraction for SH and LH. The spectrum was calibrated by dividing the extracted spectrum of the source by the extracted spectrum of a standard star (HR 6348 for SL and LL, and Dra for SH and LH) and multiplying by its template (Cohen et al., 2003, Sloan in prep). Spikes which were not present in both nod positions or in the overlap region between orders were treated as artifacts and were removed manually.
It is important to note that there is a significant mismatch between the different modules, probably due to the presence of another source about 4″ from the target, which is revealed in the IRAC images from the SAGE program (Meixner et al., 2006), and which is included in the LL and LH slits. Pointing effects may also be present. We used the coordinates reported by Leisy et al. (1997), which differ from the coordinates recently reported from HST observations (Shaw et al., 2006) by 3″ in RA. We scaled the modules to match the average spectrum of the two nod positions in SH, because the difference between the two nods in SH is of only 5% and one of the nod positions avoids the contaminating source.
3. Analysis
Figure 1 (top) shows the resulting low-resolution spectrum of SMP LMC 11 together with the IRAC (5.8 and 8m), MIPS (24 m) and IRAS (25 m) fluxes. A cool dust component dominates the overall shape of the continuum emission. The spectrum also shows broad absorption bands, most notably between 12 and 17 m.
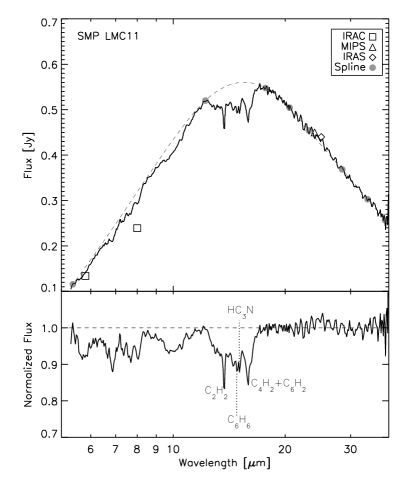
3.1. The dust continuum
The dashed line in Fig. 1 (top) is a spline fit to the dust continuum; the grey circles indicate the anchor points. In the short wavelength region we anchored to the maximum emission at only two points, 5 and 12 m. While this is an arbitrary choice, the resulting absorption spectrum is in accordance with the lack of emission features seen in the rest of the spectrum. Given the carbon-rich nature of the gas and the lack of broad emission features in the spectrum (such as PAHs), it is reasonable to assume that amorphous carbon grains dominate the dust mixture. The dust continuum in Figure 1 is featureless and peaks at 15.5 m, implying that the bulk of the emitting dust is at 330 K. For the remainder of this paper, we will represent the dust continuum by the spline fit shown in Figure 1.
3.2. Absorption features
The bottom panel of Figure 1 shows the spectrum of SMP LMC 11 after dividing out the dust continuum and reveals a number of molecular bands visible even at low resolution. Similarly, Figure 2 shows the high-resolution spectrum of SMP LMC 11 and the ISO/SWS spectrum of AFGL 618 for comparison. In Figure 2, the narrow spectral features in SMP LMC 11 are very similar to those in AFGL 618.
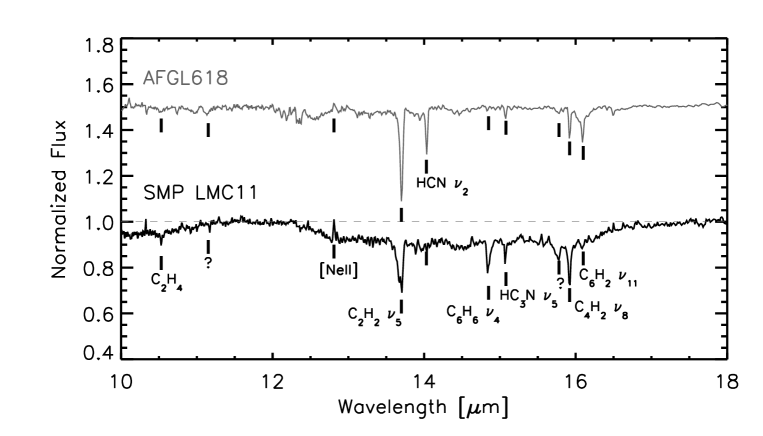
The high-resolution spectrum of SMP LMC 11 shows broad absorption between 12 and 17 m with a wealth of narrow lines superposed. These are the unresolved branches of various ro-vibrational bands from different molecules, many of which can be identified by comparison to AFGL 618 as due to acetylene (C2H2, 13.70 m), di-acetylene (C4H2, 15.87m), tri-acetylene (C6H2, 16.10m), benzene (C6H6, 14.85m) and HC3N (15.10m). Most of these also appear in the low-resolution spectrum (Figure 1). The strongest branch is the one due to C2H2 at 13.7 m. Close inspection of the spectrum indicates the presence not only of the fundamental mode, but also of hot bands and combination bands. The broad absorption is the result of the superposition of the many - and -branch lines that correspond to these branches, which indicates that the column densities of these species must be high. SMP LMC 11 presents a weaker tri-acetylene band compared to AFGL 618, but in contrast shows a stronger benzene band. Ammonia (NH3, with the strongest bands at 10.35, 10.75, and 6.15 m) and HCN (at 14.01m) are at most marginally present. By contrast stronger ro-vibrational bands of HCN are present in AFGL 618 and in the extreme carbon star IRC +10216 (Cernicharo et al., 1999). Figure 1 shows that the spectrum also exhibits an absorption dip near 10m. Such a dip is also seen by Zijlstra et al. (2006) in their sample of carbon stars. They attribute this feature to C3; however, this identification is still a matter of debate (e.g. Speck et al. 2006).
The spectrum of SMP LMC 11 shows features which are not seen in AFGL 618 at 10.53, 11.15, and 15.78 m. The feature at 10.53 m corresponds to the -branch of the CH2-wagging mode of C2H4 (ethylene). In the Spitzer wavelength range, the only other mode of this molecule that would be expected is the strong scissoring mode at 6.93 m; the rocking mode at 12.10 m is expected to be weak. There is indeed a feature around 6.93 m in the low-resolution spectrum (Figure 1). CH3C2H, also known as propyne or methylacetylene, has its strongest band at 15.79 m with medium-strength bands at 6.84 and 7.97 m, and the spectrum of SMP LMC 11 shows bands at both of those wavelengths (see Figure 1). Therefore propyne may be a good candidate for the 15.78 m band. However, the absorption from 6.3 to 8.3 m in Figure 1 (bottom panel) can also be due to the C2H2 + bands, which have been identified by Matsuura et al. (2006) in a sample of LMC AGB stars. With the latter identification the 8.0m feature could be ascribed to the C4H2 + band. The blue shoulder of this band in our spectrum may be due to HCN. Sloan et al. (2006) noted that the two absorption bands from C2H2 at 7.5 and 13.7 m are decoupled in their sample of carbons stars in the SMC. Thus we cannot use the lack of a 14.0 m band from HCN to rule out a contribution of HCN at 7.1 m. CH3 at 7.2 m and CH4 at 7.7 m have been seen in AFGL 618 (Cenicharo et al., 2001b) and in Titan’s atmosphere (Coustenis et al., 2003), and they could also be contributing to this band in SMP LMC 11. A firm identification of these bands will require higher resolution observations, especially from the ground and JWST, complemented with a detailed comparison with laboratory measurements. Besides the absorption features mentioned above, the spectrum of SMP LMC 11 shows no traces of the MgS feature (30 m) which is commonly seen in carbon stars with optically thick dust shells and on some PNe.
3.3. Emission lines
In addition to the absorption features, the high-resolution spectrum of SMP LMC 11 clearly shows emission from [Ne II] at 12.8 m. The [Ne III] line (15.5 m) may be present but the presence of another line at 15.65m which may be a glitch makes the identification of the [Ne III] more doubtful. The presence of the low-excitation line of [Ne II] is consistent with the optical measurements by Morgan & Parker (1998) and Shaw et al. (2006) of the low-excitation lines of [N II], [S II], [O I] and [O III].
4. Discussion
The infrared spectrum of SMP LMC 11 reveals three components: a cool dust continuum, absorption bands from hydrocarbon molecules, and emission from at least one low-ionization forbidden line.
The mean temperature of the dust as inferred from the peak of the IR emission (330 K) falls closer to the most evolved AGB stars (T300 K) than the youngest PNe (T150 K) (Kwok, 2000). The peak of the dust emission will shift to longer wavelengths as dust moves further away from the central star.
The Spitzer spectrum of SMP LMC 11 represents the first extragalactic detection of several molecules, including di-acetylene (C4H2), tri-acetylene (C4H2), benzene (C6H6), HC3N, C2H4, and possibly propyne. These molecules are the building blocks from which more complex hydrocarbons are produced. The absorption bands are due to the increase in thickness of the circumstellar shell, which is more dramatic at the very end of the AGB phase (García-Lario & Perea Calderón, 2002). For free molecules, this absorption will not be a Gaussian or a Lorentzian, but will be a complex addition of many individual ro-vibrational lines with different strengths (which depend on the temperature), causing the strong absorption we see in the 12-17 m region (due to the P and R branches of the molecules present in that region). The stronger absorption in this region compared to AFGL 618 indicates that SMP LMC 11 has a larger molecular column density.
The spectrum of SMP LMC 11 does not contain any PAH emission features. A mixture of PAHs and the PAH-precursor C2H2 are seen together in the low-resolution IRS spectrum of the post-AGB object MSX SMC 029 (Kraemer et al., 2006). The absence of PAH emission in SMP LMC 11 can be attributed to age or orientation effects. Cernicharo et al. (2001a) propose that PAHs may not form until the end of the AGB phase, based on their observations of AFGL 618. Alternatively, the dust in SMP LMC 11 could be distributed in an edge-on torus while MSX SMC 029 is seen more pole-on or has a more spherically symmetric dust distribution. The PAHs emit in photo-dissociation regions, and in an edge-on torus, we would not have a clear line of sight to the emitting region. The dust envelope is still too thick to allow a direct line of sight into the hotter central regions.
Despite the detection of HC3N (and perhaps HC5N), the spectrum of SMP LMC 11 shows evidence for reduced abundances of nitrogen-based molecules such as HCN and NH3 compared to Galactic objects like AFGL 618. This agrees with the nitrogen abundance derived by Leisy & Dennefeld (2006) for SMP LMC 11 () which is one of the lowest in their sample of LMC PNe. This result fits with the finding of Matsuura et al. (2006) that the HCN bands that are prominent in the Galactic sample of carbon stars are significantly weaker or absent in the LMC sample. The lower nitrogen abundance in the LMC compared to the Galaxy and higher efficiency of the third dredge-up at lower metallicities work together to decrease the nitrogen abundance relative to carbon.
The presence of an optically thick and relatively warm dust component between us and the central ionized region can explain not only the absence of PAH features, but also the absence of most ionized lines in the infrared. We only see [Ne II] (and maybe [Ne III]), and this line is probably visible only in scattered light. Scattering is more efficient in the optical than in the infrared, which would explain why more of the forbidden lines can be detected in the optical. The dust also explains the presence of molecular absorption in the spectrum, since the molecules do not have a direct line of sight to the still shielded central ionized region. It is also possible that some of the forbidden line emission is excited by high-velocity (v100 km s-1) shocks (Leisy & Dennefeld, 2006). All of these properties are more consistent an object which is in transition from the AGB to a PN than with a classic PN.
The bright H luminosity and its large size, present some problems with this scenario of a transition object. While the measured H flux by Shaw et al. (2006) makes SMP LMC 11 one of the faintest PNe in their LMC sample, its equivalent flux at 1 kpc (if we assume that it is at a distance of 50 kpc) is log(H)=10.55, which is bright for Galactic standards. Similarly, Shaw et al. (2006) state that it is one of the smallest bipolar nebulae in their LMC sample, but at a Galactic distance of 1 kpc it would be resolved. These characteristics resemble those of a typical PN. One could invoke then a massive molecular envelope surrounding the ionized region to explain the absorption features. Still, the absence of PAHs and H2 in the spectrum, and the high temperature of the dust (compared to PNe) would remain unexplained (unless perhaps invoking a complex geometry).
The rich chemistry seen in the IRS spectrum of SMP LMC 11 makes it (together with AFGL 618, and MSX SMC 029) a key object in our understanding of the formation of hydrocarbons, deserving future study from the community. Particularly, CO measurements of the circumstellar AGB envelope may prove to be particularly useful.
References
- Allamandola et al. (1989) Allamandola, L. J., Tielens, A. G. G. M., & Barker, J. R. 1989, ApJS, 71, 733
- Asplund et al. (2005) Asplund, M., Grevesse, N., & Sauval, A.J. 2005, ASPC, 336, 25
- Beichman et al. (1988) Beichman, C.A., Neugebauer, G., Harbig, H.J., Clegg, P.E., & Chester, T.J. 1988, NASA RP-1990, Infrared Astronomical Satellite (IRAS) Catalogues and Atlases, Vol 1: Explanatory Supplement
- Blommaert et al. (2005) Blommaert J., Cami J., Szczerba R. and Barlow M.J. 2005, in “ISO science legacy - a compact review of ISO major achievements”, Space Science Reviews, 119, 215
- Bujarrabal et al. (1988) Bujarrabal, V., Gómez-González, J., Bachiller, R., & Martín-Pintado, J., 1988, A&A, 204, 242
- Cernicharo et al. (1999) Cernicharo, J., Yamamura, I., González-Alonso, E., et al. 1999, ApJ, 526, L41
- Cernicharo et al. (2001a) Cernicharo, J., Heras, A.M., Tielens, A.G.G.M., et al. 2001a, ApJ, 546, L123
- Cenicharo et al. (2001b) Cernicharo, J., Heras, A.M., Pardo, J.R., et al. 2001b, ApJ, 546, L127
- Chiar et al. (1998) Chiar, J.E., Pendleton, Y.J., Geballe, T.R., & Tielens, A.G.G.M. 1998, ApJ, 507, 281
- Cohen et al. (2003) Cohen, M., Megeath, T.G., Hammersley, P. L., Martin-Luis, F., & Stauffer, J. 2003, AJ, 125, 2645
- Coustenis et al. (2003) Coustenis, A., Salama, A., Schulz, B., et al. 2003, Icarus, 161, 383
- Frenklach & Feigelson (1989) Frenklach, M. & Feigelson, E. D. 1989, ApJ, 341, 372
- García-Lario & Perea Calderón (2002) García-Lario, G., Perea Calderón, J.V. 2002, ESA SP-511, Proceedings of the Symp. Exploiting the ISO Data Archive - Infrared Astronomy in the Internet Age, pg 97
- de Graauw et al. (1996) de Graauw, T., Haser, L.N., Beintema, D.A., et al., 1996, A&A 315, L49
- Habing (1996) Habing, H.J. 1996, A&AR, 7, 97
- Higdon et al. (2004) Higdon, S.J.U., Devost, D., Higdon, J.L. et al. 2004, PASP, 116, 975
- Houck et al. (2004) Houck, J. R., Appleton, P. N., Armus, L., et al. 2004, ApJS, 154, 18
- Kessler et al. (1996) Kessler, M.F., Steinz, J.A., Anderegg, M.E., et al. 1996, A&A, 315, L27
- Kraemer et al. (2006) Kraemer, K.E., Sloan, G.C., Bernard-Salas, J., et al. 2006, ApJ, submitted
- Kwok (2000) Kwok, S. 2000, Cambridge Astrophysics Series 31, The Origin and Evolution of Planetary Nebulae
- Leisy & Dennefeld (2006) Leisy, P., & Dennefeld, M. 2006, A&A, in press
- Leisy et al. (1997) Leisy, P., Dennefeld, M., Alard, C., & Guibert, J. 1997, A&AS, 121, 407
- Matsuura et al. (2006) Matsuura, M., Wood, P., Sloan, G.C., et al. 2006, MNRAS, 371, 415
- Meatheringham and Dopita (1991a) Meatheringham, S. J., & Dopita, M. A. 1991, ApJS, 75, 407
- Meatheringham and Dopita (1991b) Meatheringham, S. J., & Dopita, M. A. 1991, ApJS, 76, 1085
- Meatheringham et al. (1988) Meatheringham, S.J., Dopita, M.A., & Morgan, D.H. 1988, ApJ, 329, 166
- Meixner et al. (2006) Meixner, M., Gordon, K.D., Indebetouw, R., et al. 2006, AJ, in press
- Morgan & Parker (1998) Morgan, & Parker 1998, MNRAS, 296, 921
- Sanduleak et al. (1978) Sanduleak, N., MacConnel, D.J., & Davis Philip, A.G. 1978, PASP, 90, 621
- Sloan et al. (2006) Sloan, G.C., Kraemer, K.E., Matsuura, M., et al. 2006, ApJ, 645, 1118
- Shaw et al. (2006) Shaw, R.A., Stanghellini, L., Villaver, E., & Mutcher, M. 2006, ApJ, submitted
- Speck et al. (2006) Speck, A.K., Cami, J., Markwick-Kemper, C., et al. 2006, ApJ, in press
- Werner et al. (2004) Werner, M., Roellig, T. L., Low, F. J., et al. 2004, ApJS, 154, 1
- Wood et al. (1987) Wood, P.R., Meatheringham, S.J., Dopita, M.A., and Morgan, D.H. 1987, ApJ, 320, 178
- Zijlstra et al. (2006) Zijlstra, A.A., Matsuura, M., Wood, P., et al. 2006, MNRAS, 370, 1961