X-RAY SPECTROSCOPY OF COOL STARS
Abstract
High-resolution X-ray spectroscopy has addressed not only various topics in coronal physics of stars, but has also uncovered important features relevant for our understanding of stellar evolution and the stellar environment. I summarize recent progress in coronal X-ray spectroscopy and in particular also discuss new results from studies of X-rays from pre-main sequence stars.
1 Introduction
X-rays from cool stars are a manifestation of magnetic fields generated by the internal dynamos. This by now classical view has not changed despite the discovery of new X-ray phenomenology and the development of new theoretical concepts with which to explain the production of X-rays around stars (e.g., accretion, outflows, fluorescence, etc).
However, with increasing detector sensitivities and the advent of high-resolution spectroscopy, “stellar environmental issues” have become of central interest in the area of pre-main sequence stars. The interplay between accretion disks and stellar magnetic fields leads to disk instabilities, ionization and heating of circumstellar material, chemical reactions in cool molecular gas, accretion flows from the disk to the star, outflows, and jets, in all of which X-rays either play a key role or at least provide important diagnostic access.
Limitations of present-day instrumentation are, however, evident. The following sections summarize selected topics of X-rays from cool stars that have been addressed in recent years using high-resolution spectroscopy from XMM-Newton and Chandra.
2 Coronal magnetic structure
To derive location, structure, and extent of stellar magnetic fields, only radio interferometric methods are available for direct imaging, with their own severe limitations. X-ray photometric studies have made use of rotational modulation or of eclipses (e.g., [1, 2, 3, 4, 5]). While appealing for specific studies of individual objects, such methods are constrained to exceptional cases or the fortuitous eclipse geometry of binaries, and are complicated by intrinsic variability (flares, new emerging flux) or the superposition of X-rays from two objects. On the other hand, X-ray spectroscopic density measurements have opened a new avenue toward assessing coronal structure.
He-like triplets show ratios between the “forbidden” and the “intercombination” line fluxes that are sensitive to the electron density , the forbidden line being suppressed in high-density environments [6, 7]. Under coronal temperature and density conditions, transitions of C v, N vi, O vii, Ne ix, Mg xi, and Si xiii are diagnostically useful, with some caveats. First, the density-sensitive range for the latter two exceeds cm-3, values that are probably uncommon to most solar-like stellar coronae. Second, the densities to which He-like transitions are sensitive increases with the formation temperature of the ion. Low densities cannot be explicitly measured in very hot plasmas. And third, the maximum formation temperatures of all ions mentioned above are in the range of 1–10 MK, while active stars reveal dominant electron temperatures up to several tens of MK (e.g., [8]). Several Fe lines are also sensitive to (e.g., prominent lines of Fe xvii and Fe xxi; [9, 10]) although blends and inaccuracies in the atomic physics parameters make their application challenging. Fe lines were already accessible to EUV spectroscopy performed by the EUVE satellite [11].
Triplet flux ratios measured in low-activity stars point to densities common to the solar corona, i.e., cm-3 (e.g., [12, 13, 14, 15, 16, 17]) at temperatures of a few MK. Magnetically active main-sequence stars show trends toward higher , typically of a few times cm-3, in the cool plasma as diagnosed for example by O vii [18, 19, 20] while several subgiant active binaries indicate below the low-density limit of O VII [4, 21, 22].
A rather surprising - and to the present day controversial - result have been indications for very high ( cm-3) derived from ions forming in hot plasma (e.g., Mg xi, Si xiii, and Fe xxi; see, e.g., [14, 23, 24], and the work referring to EUVE summarized in ref. [11]). The controversies are the following:
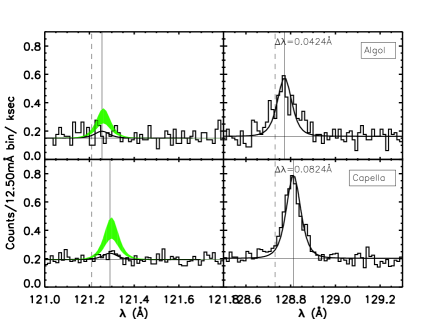
Contradicting measurements using different instruments; lines that should appear in high-density environments, and some of which were indeed reported from EUVE spectroscopy, are not present in high-resolution spectra obtained by Chandra, indicating much lower ([25, 26, 22], see Fig. 1).
Most high-density measurements straddle the low-density limit of the respective ion. This circumstance makes the measurements extremely vulnerable to inaccuracies in the atomic physics tabulations, and to unrecognized blends in some of the lines. Slight modifications then have a dramatic effect on the implied , as can be nicely seen in the analysis presented by ref. [26]. This work concluded, from a detailed study of the Chandra HETG spectrum of Capella, that measured by the most reliable Fe xxi line ratio, , is compatible with the low-density limit of this diagnostic (i.e., cm-3). The similarity among the high density values just slightly above the low-density limits for a wide variety of stars points to a problem in the atomic physics tabulations, while the true densities remain below the low-density limit [22].
Some measurements tend to be systematically different between ionization stages that have similar formation temperatures. In a study of the active binary CrB, for example, densities derived from He-like triplets, Fe xxi and Fe xxii reaches up to a few times cm-3 whereas Mg xi suggests cm-3 [27].
Blends, perhaps from as of yet unrecognized lines, may bias the measured line-flux ratios systematically. The resolution of this issue requires very high spectral resolution. Detailed studies for the Ne ix triplet and for the Mg xi and Si xiii triplets are available [28, 29].
If the density trend described above is real, then coronal loop pressures should vary by 3–4 orders of magnitude. This obviously requires different magnetic loop systems for the different pressure regimes, with a tendency that hotter plasma occupies progressively smaller volumes [27, 24, 30].
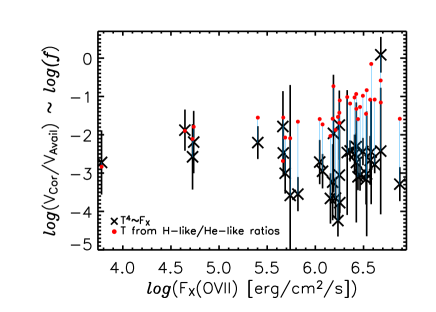
The most comprehensive surveys of stellar coronal measurements are those given by refs. [22] and [29]. These studies concluded that the surface filling factor (derived from the emission measure, the measured , and a realistic coronal scale height) of magnetic loops containing cool X-ray emitting material increases from inactive to moderately active stars but then “saturates” at levels of about ten percent (Fig. 2). In the most active stars, hot coronal loops are added, with a sharply increasing filling factor. This trend may be a consequence of increasing magnetic interaction in the corona. As one moves from low to intermediate activity levels, more magnetic flux increases the number of active regions. As the packing of active regions becomes denser, more frequent interactions between magnetic features induce more flare-like processes. The increased luminosity, the higher temperatures and the higher densities are then all a consequence of increased flaring and chromospheric evaporation in active regions [31, 32].
In general, the inversion problem from line flux ratios to density is degenerate, however. The simplest solution usually quoted, namely a plasma at constant density, is the least plausible one. Realistic coronae reveal a distribution of electron densities, with infinitely many distributions resulting in the same line flux ratios. The ratio-derived densities are not even linear averages across the emitting volume because of the dependence of the line fluxes. Denser volumes contribute disproportionately more X-rays than low-density volumes. The flux ratios thus provide information on possible distributions of volume in density [33].
3 Dynamics from X-ray spectroscopy
Doppler information from X-ray spectral lines may open up new ways of imaging coronae of stars as they rotate, or as they orbit around the center of gravity in binaries. First attempts are encouraging although the instrumental limitations are still severe. Ref. [34] reported Doppler shifts with amplitudes of km s-1 in X-ray lines of HR 1099. Amplitudes and phases clearly agreed with the line-of-sight orbital velocity of the subgiant K star, thus locating the bulk of the X-ray emitting plasma on the latter rather than in the intrabinary region. Periodic line broadening in YY Gem, on the other hand, suggests that both components are similarly X-ray luminous [35] which is expected because the two M dwarf components show nearly identical fundamental properties. Ref. [21] found Doppler motions in AR Lac to be compatible with coronae on both companions if the plasma is close to the photospheric level. For the contact binary 44i Boo, periodic line shifts corresponding to a total net velocity change over the full orbit of 180 km s-1 were found [36]. From the amplitudes and the phase of the rotational modulation [37], the authors concluded that two dominant X-ray sources, one very compact and one extended, were present, both being located close to one of the stellar poles of the larger companion.
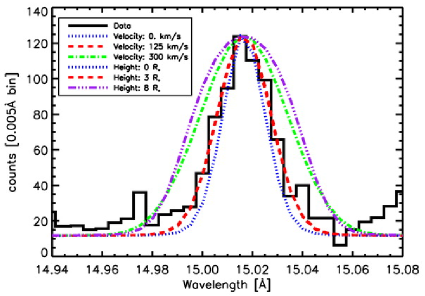
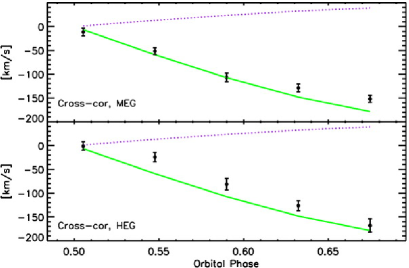
A comprehensive study involving line shifts and broadening has been presented for the Algol binary [38]. Periodic line shifts corresponding to a quadrature velocity of 150 km s-1 clearly prove that the X-rays are related to the K subgiant (Fig. 3). However, the amplitude of the shifts indicates that the source is slightly displaced toward the B star, which may be the result of tidal distortions of the K star. Excess line broadening (above thermal and rotational broadening, Fig. 4) can be ascribed to a radially extended corona, with a coronal scale height of at least one stellar radius, which is consistent with expected scale heights of hot coronal plasma on this star.
4 Abundances: I/FIP and solar models
It is quite well established that the solar corona and the solar wind show elemental compositions at variance with the composition of the solar photosphere. In the solar corona, elements with a First Ionization Potential (FIP) above eV (e.g., C, N, O, Ne, Ar) show photospheric abundance ratios with respect to hydrogen, while elements with a smaller FIP (e.g., Si, Mg, Ca, Fe) are overabundant by a factor of a few (“FIP Effect”, [39, 40]). Current thinking is that a fractionation process, probably involving electric and/or magnetic fields, waves, or pressure gradients, occurs at chromospheric levels where low-FIP elements are predominantly ionized and high-FIP elements are predominantly neutral (e.g., [41, 42]). Ions and neutrals can be affected differently by electric and magnetic fields.
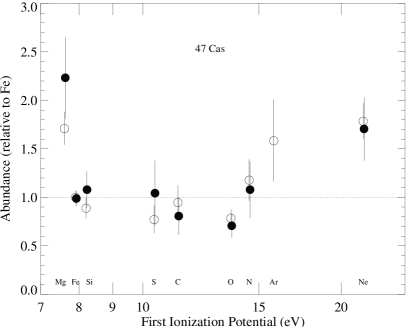
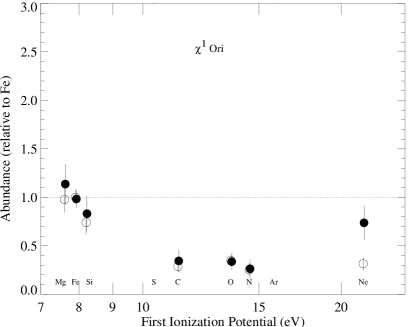
First recognition of coronal abundance anomalies date back to the earliest stellar spectral X-ray observations (see summary in [33]). Clarification of trends with FIP, however, required high-resolution grating spectroscopy. Early observations with XMM-Newton uncovered a new, systematic FIP-related bias in magnetically active stars: low-FIP abundances are systematically depleted with respect to high-FIP elements ([43, 18, 4]; Fig. 5), a trend known as the “inverse FIP effect” (IFIP). As a consequence of this anomaly, the ratio between the abundances of Ne (highest FIP) and Fe (low FIP) is unusually large, up to about 10, compared to the solar photospheric ratio. These trends have been widely confirmed with the various gratings available on XMM-Newton or Chandra, for many active stars (e.g., [44, 45]).
Systematic investigations have shown that the abundance pattern gradually changes from FIP to IFIP with decreasing activity level (or increasing main-sequence age; [46, 47], Fig. 5). In nearby solar-analog stars, this effect does not mirror an abundance trend in the photosphere, which usually shows a composition in agreement with the solar photosphere [47].
Trends are summarized in Fig. 6 for the low-FIP elements Fe and Mg and the high-FIP elements Ne and O, as a function of the average coronal temperature which serves as an activity indicator. Evidently, the absolute Fe abundance decreases with increasing activity, while the Ne abundance slightly increases, leading to a largely increasing Ne/Fe abundance ratio toward more active stars. The abundances reported here are quoted with respect to the solar photospheric abundances reported in ref. [48], except for Fe that is taken from ref. [49].
Fig. 6 shows an anomaly for the O/Ne ratio which is found at values of 0.3-0.7 times the solar ratio, apparently regardless of the stellar activity level. Because both O and Ne are high-FIP elements, their abundance ratio could reflect the photospheric ratio. But then, the Sun’s composition would be anomalous.
The tabulations of several solar element abundances have recently been revised, resulting in significant discrepancies between solar models and helioseismological results (see ref. [50] and references therein) unless further solar abundances were also different. A Ne abundance higher by a factor of at least 2.5 than hitherto assumed would be needed. Therefore, ref. [47] were first to point out that the systematically non-solar O/Ne abundance ratio (by a similar factor) calls for a revision of the solar Ne abundance tabulation which at the same time would solve the solar helioseismology problem. This was subsequently further elaborated by ref. [51] who suggested a factor of 2.7 upward revision of the adopted solar Ne abundance.


Two directions should be taken to verify this suggestion. First, further abundances of low-activity solar-analog stars should be derived. So far, agreement with solar values have been reported for Cen A [17], Procyon [16], and for Com, the latter with large error bars, however [47]. There seems to be a trend toward higher O/Ne ratios in Fig. 6 indeed. New results for Cen have been reported by J. Schmitt (these proceedings). Second, verification of the solar Ne/O ratio is needed. Although Ne cannot be measured directly in the photosphere, the Ne/O ratio can be derived from coronal measurements the same way as done for stellar observations. Recent analysis of solar active region X-ray spectra and of EUV spectra from transition-region levels [52, 53] both report the standard Ne/O abundance ratios, rejecting an upward correction of Ne. The issue should therefore be considered to be open for the time being. A FIP-related enrichment of Ne in active corona remains a viable possibility.
5 Young stars: New phenomenology
5.1 Diskless and non-accreting systems
As we move to younger stages, the stellar environment becomes a key ingredient, made up of circumstellar disks, gas flows from the disk to the star perhaps along extended magnetospheric field lines, massive envelopes, and high-velocity jets accompanied by massive, much slower molecular outflows. In recent years, surprising and unexpected X-ray phenomenology related to these features has been uncovered.
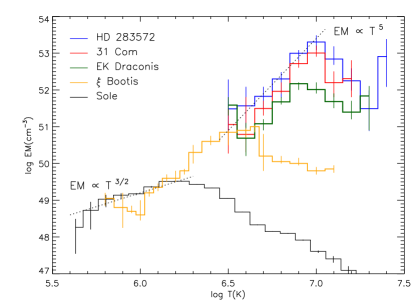
Studies of stars that have dissipated their thick accretion disks and are evolving toward the main sequence have almost uniformly revealed X-ray properties in line with findings in young main-sequence stars: very hot temperatures evident in broad emission-measure distributions (Fig. 7), overall low densities (Fig. 8), sub-solar abundances showing an IFIP effect (Fig. 9), and flares. This holds true for rather evolved pre-main sequence objects such as the rapidly rotating K0 V star PZ Tel ( d, age 20 Myr; [54], Fig. 8, 9), but also for the much younger weak-lined T Tau stars (WTTS, [55, 56]; Fig. 7).

Two systems in the TW Hya Association (TWA), HD 98800 [56] and TWA 5 [57], follow this trend although both reveal unusually high Ne/Fe abundance ratios (up to 10). Although such ratios have been found in evolved binaries, they seem to be unusual among WTTS.

5.2 Classical T Tau stars: new physics?
The emerging picture for non-accreting stars is that of a coronal origin of the X-rays in analogy to more evolved main-sequence stars. Does this hold for accreting classical T Tau (CTTS) stars?
The first CTTS studied in spectroscopic detail in X-rays was TW Hya in the TWA. The high-resolution X-ray spectra from Chandra [58] and XMM-Newton [59] are full of surprises. First, and perhaps most notably, the emission line pattern indicates a very cool plasma, dominated by temperatures around 3 MK, with little hot plasma. This is unusual for any type of T Tau stars. Second, the analysis of the Ne ix and O vii triplets reveals unusually high densities of order cm-3, the forbidden line of the O vii line essentially being absent (Fig. 10). And third, TW Hya shows an unusually high Ne/Fe abundance ratio of about 10 relative to the solar photospheric ratio, and the N/O and N/Fe ratios are enhanced by a factor of 3.
The model proposed by ref. [58] and further elaborated in [59] relies on magnetically guided accretion streams from the disk to the star. Material falling toward the star reaches near-free fall velocities, , which is a few hundred km s-1 for CTTS. Strong shocks at the photospheric impact site heat material to
| (1) |
where is the Boltzmann constant, is the mean molecular weight of the infalling plasma, and is the mass of the hydrogen atom. The density developing in the shock is four times the pre-shock density. The latter can be estimated if the global mass accretion rate, , and the accretion surface filling factor, , are known, as follows:
| (2) |
where typical filling factors measured for T Tau stars are 0.1-10% [60]. Shock temperatures of a few MK and electron densities cm-3 are thus indeed expected.

5.3 Cool plasma, Ne enhancements, high densities, or what?
Why would a relatively evolved CTTS with a rather moderate mass accretion rate show X-rays that are largely dominated by accretion-induced heating, whereas other T Tau stars, either of equal age or younger examples in star-forming regions, show X-rays originating predominantly from very hot (10-40 MK) coronal plasma (e.g., [65])?
To address this question further, two routes should be taken: i) a statistically meaningful sample of high-resolution spectra from T Tau stars should be collected, and ii) the anomalies claimed to relate to accretion should be critically compared to stars with other properties.
Obtaining X-ray spectra from CTTS is challenging since only a handful are bright enough and not subject to strong photoelectric absorption so as to allow access to cool material and the relevant He-like triplets. BP Tau has been analyzed by ref. [66]. While there is evidence for a suppressed forbidden line in O vii indicating electron densities of order (lower than in TW Hya), the overall plasma is dominated by very high temperatures. CR Cha has been reported to possibly show a low forbidden line flux in O vii although the low signal-to-noise ratio makes this claim tentative [67].
Further grating spectra have been obtained as part of the XMM-Newton Extended Survey of the Taurus Molecular Cloud (XEST, [68]). The example of T Tau is shown in Fig. 11. The ratio between its flux in the O vii line triplet and the flux in the O viii Ly line, O vii/O viii, is unusually high even though the bulk of the emitting plasma is very hot. Such oxygen flux ratios are otherwise seen in rather evolved main-sequence stars, but not in active near-ZAMS objects [47]. The Herbig Ae star AB Aur, prototype of its class, reveals an RGS spectrum that is entirely dominated by cool plasma, with a very prominent O vii line triplet but faint Fe lines, the latter dominated by the lowest species detectable in this range, namely Fe xvii (Fig. 12). Although winds are present in AB Aur, this object is thought to accrete matter at a similar rate as T Tau stars (see [69]).


Regardless of the overall, dominant electron temperature, there is thus evidence for a soft excess in CTTS compared to WTTS, best expressed by the O vii/O viii flux ratio. While this ratio is mostly in bright WTTS, it is around unity in CTTS. These systematics are illustrated in Fig. 13 where the flux ratio is plotted as a function of the hydrogen absorption column density, , allowing to estimate the unabsorbed flux (or luminosity) ratio and to model the equivalent isothermal plasma that would produce the same flux ratio [70]. Accreting stars show a systematically higher ratio, indicating a soft excess.

As for electron densities, apart from TW Hya and BP Tau, no further cases with a clear-cut suppression of the forbidden line in the O viii or Ne ix triplets have been reported. On the contrary, both T Tau and AB Aur reveal low densities (the 1 error bar reaching to cm-3 for AB Aur, see Fig. 12; Fig. 11 for T Tau).
A study of the element abundances in the X-ray sources of WTTS and CTTS, derived from XMM-Newton RGS spectroscopy, supports the often-reported trends of increasing abundances with increasing FIP [70]. Several CTTS and WTTS show large Ne/Fe ratios ( or higher), much larger than in main-sequence active solar analogs [47] but similar to RS CVn binaries [46]. In contrast, the CTTS SU Aur reveals a low Ne/Fe abundance ratio of order unity [67, 70], similar to some other massive CTTS [70]. On the other hand, high Ne/Fe ratios are also found in non-accreting WTTS, for example in TWA 5 (, as in TW Hya, [57]), HD 98800 ( [56]), and in V773 Tau and V410 Tau [70].
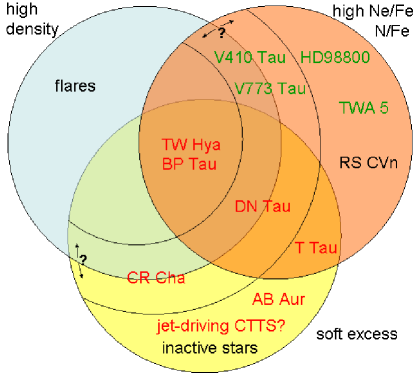
Fig. 14 summarizes results from high-resolution spectroscopy of TTS with regard to the three X-ray features claimed to be accretion indicators: high Ne/Fe abundance ratio, high electron densities, and soft excess. Only two stars, TW Hya and BP Tau, reveal all three properties to some extent, although they are expressed considerably less in the latter. Ne/Fe abundance ratios do not seem to correlate with accretion, while all CTTS show a soft excess (as defined above). (The existing grating spectra of SU Aur, HP Tau/G2, and HD 283572 contain insufficient information to place these stars onto the diagram.)
What, then, are the possible origins of these features? Accretion-shock induced X-rays [58] remain a possibility although the mechanism of X-ray escape remains problematic [60, 71]. The low O vii derived densities in some of these objects may relate to large surface accretion filling factors with consequent small mass flux densities and therefore small electron densities (see Eq. 2) although for stars like T Tau ( yr-1, refs. in [68]), the accretion filling factor would need to be around unity. In the Herbig star AB Aur, the O vii forbidden line should be suppressed additionally by the photospheric radiation field, which is not observed. Its X-ray source cannot therefore be located close to the stellar surface [70]. It is also possible that the observed O vii triplets are dominated by coronal emission, outshining any contribution from high-density accretion-related plasma. Obviously, this scenario is difficult to explain, in particular given the strong excess in the total O vii flux that is not usually observed in active coronal sources.
The most consistent trend in accreting stars is the soft excess. Explanations include: i) accretion-shock heated material [58]; ii) elimination of the potentially hottest coronal loops by the accretion streams [72]. iii) Additional mass loading of coronal loops from the accretion streams, either suppressing the heating efficiency of these loops [65] or enhancing the cooling such that a soft excess builds up.
Another class of young soft-excess emitters have recently been identified in jet-driving CTTS. Their low-resolution spectra reveal a strong, little absorbed soft component from plasma at a few MK, and a strongly absorbed, flaring coronal component. Here, the accretion scenario is unlikely given the expected (and observed) strong absorption of X-rays from low-lying plasma. Rather, shocks formed in the jets and outflows at some distance from the stars may be the origin of the X-rays [73, 74].
6 Summary and Conclusions
High-resolution X-ray spectroscopy has provided novel access to stellar coronae by resolving emission lines from which the composition and structure of magnetically confined coronal plasmas has been derived. There have also been little anticipated developments such as X-rays related to the stellar environment, e.g. accretion disks, accretion flows, and jets. An encouraging array of new emission models and of implications for stellar evolution have been described in the literature. Nevertheless, limitations have rapidly been reached with the presently available grating spectrometers. Only few T Tau stars are accessible to spectroscopic investigations, and some crucial classes of stars (protostars, brown dwarfs) are out of reach of these gratings. The next generation of X-ray satellites should improve on two parameters: wavelength resolution and sensitivity. A resolving power of a few 1000 will systematically access orbit and rotational velocities of many stars and binaries. Flare plasma flow velocities of a few 100 km s-1 can be systematically studied. Further, the problem with unrecognized blends would be dramatically reduced. Sensitivity will be required to study objects in star forming regions, in nearby open clusters, but also to access close but faint objects such as evolved main-sequence stars or brown dwarfs.
References
- [1] Ottmann, R. 1994, A&A, 286, L27.
- [2] Güdel, M., Schmitt, J. H. M. M., Benz, A. O., & Elias, N. M. II. 1995, A&A, 301, 201.
- [3] Kürster, M., Schmitt, J. H. M. M., Cutispoto, G., & Dennerl, K. 1997, A&A, 320, 831.
- [4] Audard, M., Güdel, M., & Mewe, R. 2001, A&A, 365, L318.
- [5] Marino, A., Micela, G., Peres, G., & Sciortino, S. 2003, A&A, 407, L63.
- [6] Gabriel, A. H., & Jordan, C. 1969, MNRAS, 145, 241.
- [7] Porquet, D., Mewe, R., Dubau, J., et al. 2001, A&A, 376, 1113.
- [8] Audard, M., Telleschi, A., Güdel, M., et al. 2004, ApJ, 617, 531.
- [9] Mewe, R., Gronenschild, E. H. B. M., & van den Oord, G. H. J. 1985, A&AS 62, 197.
- [10] Brickhouse, N. S., Raymond, J. C., & Smith, B. W. 1995, ApJS, 97, 551.
- [11] Bowyer, S., Drake, J. J., & Vennes, S. 2000, ARA&A, 38, 231.
- [12] Brinkman, A. C., Gunsing, C. J. T., Kaastra, J. S., et al. 2000, ApJ, 530, L111.
- [13] Canizares, C. R., Huenemoerder, D. P., Davis, D. S., et al. 2000, ApJ, 539, L41.
- [14] Mewe, R., Raassen, A. J. J., Drake, J. J., et al. 2001, A&A, 368, 888.
- [15] Ness, J.-U., Mewe, R., Schmitt, J. H. M. M., et al. 2001, A&A, 367, 282.
- [16] Raassen, A. J. J., Mewe, R., Audard, M., et al. 2002, A&A, 389, 228.
- [17] Raassen, A. J. J., Ness, J.-U., Mewe, R., et al. 2003, A&A, 400, 671.
- [18] Güdel, M., Audard, M., Briggs, K., et al. 2001b, A&A, 365, L336.
- [19] Ness, J.-U., Schmitt, J. H. M. M., Burwitz, V., et al. 2002a, A&A, 394, 911.
- [20] Raassen, A. J. J., Mewe, R., Audard, M., & Güdel, M. 2003b, A&A, 411, 509.
- [21] Huenemoerder, D. P., Canizares, C. R., Drake, J. J., & Sanz-Forcada, J. 2003, ApJ, 595, 1131.
- [22] Ness, J.-U., Güdel, M., Schmitt, J. H. M. M., et al. 2004, A&A, 427, 667.
- [23] Audard, M., Behar, E., Güdel, M., et al. 2001b, A&A, 365, L329.
- [24] Argiroffi, C., Maggio, A., & Peres, G. 2003, A&A, 404, 1033.
- [25] Ayres, T. R., Osten, R. A., & Brown, A. 2001a, ApJ, 562, L83.
- [26] Phillips, K. J. H., Mathioudakis, M., Huenemoerder, D. P., et al. 2001, MNRAS, 325, 1500.
- [27] Osten, R. A., Ayres, T. R., Brown, A., et al. 2003, ApJ, 582, 1073.
- [28] Ness, J.-U., Brickhouse, N. S., Drake, J. J., & Huenemoerder, D. P. 2003b, ApJ, 598, 1277.
- [29] Testa, P., Drake J. J., & Peres, G. 2004a, ApJ, 617, 508.
- [30] Maggio, A., Drake J. J., Kashyap, V. L., et al. 2004, ApJ, 613, 548.
- [31] Güdel, M., Guinan, E. F., & Skinner, S. L. 1997, ApJ, 483, 947.
- [32] Drake, J. J., Peres, G., Orlando, S., et al. 2000, ApJ, 545, 1074.
- [33] Güdel, M. 2004, A&ARev, 12, 71.
- [34] Ayres, T. R., Brown, A., Osten, R. A., et al. 2001b, ApJ, 549, 554.
- [35] Güdel, M., Audard, M., Magee, H., et al. 2001a, A&A, 365, L344.
- [36] Brickhouse, N. S., Dupree, A. K., & Young, P. R. 2001, ApJ, 562, L75.
- [37] Brickhouse, N. S., & Dupree, A. K. 1998, ApJ, 502, 918.
- [38] Chung, S. M., Drake, J. J., Kashyap, V. L., et al. 2004, ApJ, 606, 1184.
- [39] Meyer, J.-P. 1985, ApJS, 57, 151.
- [40] Feldman, U. 1992, Phys. Scripta, 46, 202.
- [41] Hénoux, J.-C. 1995, Adv. Space Res., 15, 23.
- [42] Laming, M. 2004, ApJ, 614, 1063.
- [43] Brinkman, A. C., Behar, E., Güdel, M., et al. 2001, A&A, 365, L324.
- [44] Drake, J. J., Brickhouse, N. S., Kashyap, V., et al. 2001, ApJ, 548, L81.
- [45] Huenemoerder, D. P., Canizares, C. R., & Schulz, N. S. 2001, ApJ, 559, 1135.
- [46] Audard, M., Güdel, M., Sres, A., et al. 2003, A&A, 398, 1137.
- [47] Telleschi, A., Güdel, M., Briggs, K., et al. 2005, ApJ, 622, 653.
- [48] Anders, E., & Grevesse, N. 1989, Geochim. Cosmochim. Acta, 53, 197.
- [49] Grevesse, N., & Sauval, A. J. 1999, A&A, 347, 348.
- [50] Antia, H. M., & Basu, S. ApJ, 620, L129.
- [51] Drake, J. J., & Testa, P. 2005, Nature, 436, 525.
- [52] Schmelz, J. T., Nasraoui, K., Roames, J. K., et al. 2005, ApJ, 634, L197.
- [53] Young, P. R. 2005, A&A, 444, L45.
- [54] Argiroffi, C., Drake, L. J., Maggio, A., et al. 2004, ApJ, 609, 925.
- [55] Scelsi, L., Maggio, A., Peres, G., & Pallavicini, R. 2005, A&A, 432, 671.
- [56] Kastner, J. H., Huenemoerder, D. P., Schulz, N. S., et al. 2004, ApJ, 605, L49.
- [57] Argiroffi, C., Maggio, A., Peres, G., et al. 2005, A&A, 439, 1149.
- [58] Kastner, J. H., Huenemoerder, D. P., Schulz, N. S., et al. 2002, ApJ, 567, 434.
- [59] Stelzer, B., & Schmitt, J. H. M. M. 2004, A&A, 418, 687.
- [60] Calvet, N., & Gulbring, E. 1998, ApJ, 509, 802.
- [61] Drake, J. J., Testa, P., & Hartmann, L. 2005, ApJ, 627, L149.
- [62] Savage, B. D., & Sembach, K. R. 1996, ARA&A, 34, 279.
- [63] Charnley, S. B. 1997, MNRAS, 291, 455.
- [64] Frisch, P. C., & Slavin, J. D. 2003, ApJ, 594, 844.
- [65] Preibisch, T., Kim, Y.-C., Favata, F., et al. 2005, ApJS, 160, 401.
- [66] Schmitt, J. H. M. M., Robrade, J., Ness, J.-U., et al. 2005, A&A, 432, L35.
- [67] Robrade, J., & Schmitt, J. H. M. M. 2006, A&A, 449, 737.
- [68] Güdel, M., Briggs, K. R., Arzner, K., et al. 2006, A&A, submitted.
- [69] Telleschi, A., Güdel, M., Briggs, K. R., et al. 2006a, A&A, submitted.
- [70] Telleschi, A., Güdel, M., Briggs, K. R., et al. 2006b, A&A, submitted.
- [71] Drake, J. J. 2005, in Cool Stars 14, eds. F. Favata et al. (Noordwijk: ESA), 519.
- [72] Audard, M., Güdel, M., Skinner, S. L., et al. et al. 2005, ApJ, 635, L81.
- [73] Güdel, M., Skinner, S. L., Briggs, K. R., et al. 2005, ApJ, 626, L53.
- [74] Güdel, M.,Telleschi, A., Audard, M., et al. 2006, A&A, submitted.
ACKNOWLEDGEMENTS
I thank C. Argiroffi, J. Drake, J.-U. Ness, L. Scelsi, B. Stelzer, and A. Telleschi for providing illustrations shown in this article.