Link between the chromospheric network and magnetic structures of the corona
Abstract
Context. Recent work suggested that the traditional picture of the corona above the quiet Sun being rooted in the magnetic concentrations of the chromospheric network alone is strongly questionable.
Aims. Building on that previous study we explore the impact of magnetic configurations in the photosphere and the low corona on the magnetic connectivity from the network to the corona. Observational studies of this connectivity are often utilizing magnetic field extrapolations. However, it is open to which extent such extrapolations really represent the connectivity found on the Sun, as observations are not able to resolve all fine scale magnetic structures. The present numerical experiments aim at contributing to this question.
Methods. We investigated random salt-and-pepper-type distributions of kilo-Gauss internetwork flux elements carrying some to Mx, which are hardly distinguishable by current observational techniques. These photospheric distributions are then extrapolated into the corona using different sets of boundary conditions at the bottom and the top. This allows us to investigate the fraction of network flux which is connected to the corona, as well as the locations of those coronal regions which are connected to the network patches.
Results. We find that with current instrumentation one cannot really determine from observations, which regions on the quiet Sun surface, i.e. in the network and internetwork, are connected to which parts of the corona through extrapolation techniques. Future spectro-polarimetric instruments, such as with Solar B or Gregor, will provide a higher sensitivity, and studies like the present one could help to estimate to which extent one can then pinpoint the connection from the chromosphere to the corona.
Key Words.:
Sun: magnetic fields — Sun: atmosphere — Sun: corona1 Introduction
The appearance of the large-scale magnetic field on the quiet Sun photosphere is dominated by the so called network structure, which is found at the boundaries of the super-granular cells. This magnetic network with a typical scale of 20 Mm is made up by concentrations each carrying a magnetic flux in the range of to Mx with field strengths of the order of kilo-Gauss (Schrijver et al., 1997). The region in-between these network structures, the internetwork, is not field-free (Livingston & Harvey, 1975), but shows a small average flux density appearing to be of the order of a few to 50 Mx/cm2. Depending on the spatial resolution, polarimetric sensitivity and diagnostic technique (Hanle and Zeeman effect), authors find a weak volume filling component (Faurobert et al., 2001), or small concentrations with kilo-Gauss flux tubes (e.g. Domínguez Cerdeña et al., 2003; Sánchez Almeida et al., 2004).
As there are flux tubes with high, kilo-Gauss field strengths to be found in the network as well as the internetwork, a better concept to distinguish between the network and internetwork would be the amount of flux carried by each individual flux elements. With some to Mx each internetwork (flux tube) element carries about one to two orders of magnitude less magnetic flux than the network patches (Lin & Rimmele, 1999; Socas-Navarro & Sánchez Almeida, 2002).
Even though each internetwork patch carries a very small amount of flux as compared to the stronger network patches, the weak internetwork patches can contribute a significant amount to the total (unsigned) flux on the solar surface, because they are so abundant. In contrast to the old canopy concept (e.g. Giovanelli, 1980), where the internetwork patches have been neglected, the abundant low flux but high field strength concentrations in the internetwork do interact with the strong network patches: a sizable fraction of the field lines originating from the internetwork patches do not close back to another internetwork patch very close by, but can connect either to the stronger network patches or to the corona.
This was first pointed out by Schrijver & Title (2003) who constructed a network patch surrounded by many smaller internetwork patches by placing magnetic charges at a plane, performed a potential field extrapolation and then studied the connections from their simulated photosphere, i.e. the distribution of point charges, to the corona. They found that, depending on the average absolute flux density, only part of the network flux is actually connected to the corona. At an internetwork average absolute flux density of about 20 Mx/cm2, which is compatible with solar observations, they found that only half of the network flux connects into the corona, the other half connects to the surrounding internetwork. Consequently, half of the magnetic flux in the corona originates from the internetwork, which is in strong contrast to the traditional canopy picture.
In this paper we will go one step further than Schrijver & Title (2003) and not only demonstrate that the coronal magnetic field to a large part originates in the internetwork, but also investigate the role of the (spatial) distribution of the magnetic field in the low corona and the photosphere, i.e. at the upper and lower boundary, for the link between the photosphere and the corona. This investigation will show the limitations for the knowledge we might gain from magnetic field extrapolations on the connections from the network and internetwork to the corona. As it will turn out, this is basically through our imperfect ability to determine the photospheric magnetic field at small enough scales with sufficient polarimetric sensitivity.
The organization of this paper is as follows. In order to also employ a boundary condition at the top of the computational domain we briefly describe a Fourier transform technique for the potential field extrapolation, the boundary conditions representing the photosphere and the low corona as well as how to derive the fraction of network flux reaching the corona (Sect. 2). Based on these results for the extrapolations with different boundary conditions we first compare our results to previous work in Sect. 3.1 before we discuss our new findings on the impact of the low corona (Sect. 3.2) and the distribution of photospheric flux (Sect. 3.2) on the magnetic connection from the photosphere to the corona. We will conclude the paper with a discussion of the consequences of this study for further investigations of the chromosphere–corona coupling in Sect. 4.
2 Magnetic field extrapolation and boundary conditions
In order to determine the magnetic coupling between internetwork fields and the lower corona we will calculate the fraction of the magnetic flux originating from the internetwork photosphere reaching into the corona. In a previous study Schrijver & Title (2003) computed “field lines by tracing the path of monopolar test particles through the summed potential field above a plane [resembling the photosphere] filled with magnetic point charges of mixed polarities that surround a small number of significantly stronger point charges” establishing a network like configuration. To enforce a vertical field at a coronal height, they added mirror charges at a height of Mm. The goal of the present paper is to re-visit the problem posed by Schrijver & Title (2003) in order to further investigate the impact of the boundary conditions at the top, i.e. in the corona, and at the bottom, i.e. in the photosphere. Thus we will apply a magnetic field extrapolation allowing the allocation of reasonable boundary conditions at the bottom and the top of the computational domain. Within the framework of the study of Schrijver & Title (2003) this would not be possible for the upper boundary. For the sake of simplicity we will be using a potential field extrapolation employing a Fourier transform to solve for the expansion of magnetic field into the half space above the photosphere, as has been described already by e.g. Alissandrakis (1981).
In a force free state, the Lorentz force has to vanish, i.e. has to be parallel to the magnetic field. If one further assumes a current free state, then
| (1) |
implying that can be written in terms of a gradient of a scalar field, i.e. is a potential field. This has to be accompanied, of course, by
| (2) |
Starting from a given -component of the magnetic vector in the plane and assuming a periodic nature of the problem in the horizontal directions, the field is calculated by utilizing a Fourier transform (FT) technique to solve (1) and (2).
2.1 Expansion of the magnetic field
To solve the expansion of the magnetic field governed by (1) and (2) we follow Alissandrakis (1981), but in addition to his study we will also prescribe the (-component of the) magnetic field at the upper boundary.
The FTs, denoted by , for the spatial derivatives of in the horizontal (, ) and vertical () directions read
and similar for and . As the problem is assumed to be periodic in and , the wavenumbers and are real. Applying these relations to the FTs of (1) and (2) yields a second order homogenous differential equation
| (3) |
Here the horizontal wavenumber is given through and for simplicity the hat symbol denotes the Fourier transform, i.e. . For the horizontal components we find
| (4) |
The general solution of (3) is
| (5) |
with and .
When considering a computational domain stretching from zero to infinity (as done by Alissandrakis, 1981) in the vertical direction, naturally has to be zero! However, if we confine the considered domain to a certain height we can specify a lower and an upper boundary condition (BC). Based on the upper and lower BC we know the Fourier transforms of the vertical component of the magnetic field at the bottom and the top of our computational domain,
This determines the coefficients in the general solution (5),
All three components of the (FT of the) magnetic field can now be written in terms of the assigned boundary conditions and height ,
The magnetic field is then determined by an inverse FT.
2.2 Assigning Boundary conditions
To achieve a maximum degree of comparability with the study of Schrijver & Title (2003), we employed magnetic configurations at the lower boundary, , which are derived by placing magnetic charges below the surface as was done in their work. From these we extracted the -component of the magnetic vector at the bottom () of several computed field domains to create sets of magnetograms for the use as lower BCs with the extrapolation model.
2.2.1 Configuration of the lower boundary
In order to establish network-like magnetic patches we assume a strong concentration of magnetic flux of Mx in the middle of the horizontally periodic computational box, extending 14 Mm 14 Mm horizontally. This is then basically the same setup as in Schrijver & Title (2003), who considered 55 magnetic patches to achieve some periodicity.
Surrounding the central patch about 200 smaller charges of equal size were randomly positioned to constitute the internetwork field. Each of these small patches carries the same absolute value of magnetic flux, but half of them has one, the other half the opposite magnetic polarity, i.e. the net flux from the background, viz. the internetwork, is zero.
We generated the magnetic field distribution at the lower boundary by placing magnetic charges for the strong network patch as well as for the smaller patches just below the surface (internetwork km & network km) and mirror charges at +100 Mm. Then we could compute the magnetic field by summing up the magnetic potential at . In this way we ensured to have a lower boundary condition closely matching the study of Schrijver & Title (2003). This results in a horizontal extension of the central network patch at the photospheric level (full width at half maximum, FWHM) of about 170 km. The surrounding weak internetwork patches have a FWHM of about 100 km. One can think of this lower BC for the magnetic field as a magnetogram that should resemble a magnetic network patch surrounded by a salt-and-pepper-like weak internetwork field.
We constructed several of such synthetic magnetograms to simulate diverse flux distributions in the internetwork. They all have the same central network patch carrying Mx, but they differ with respect to the spatial distribution and the magnetic flux of the weak internetwork patches. We carried out experiments with the (absolute value of the) magnetic flux for each weak internetwork patch ranging from 1015 Mx to 81017 Mx. Please note that in each of the synthetic magnetograms all internetwork patches carry the same (absolute) flux. The internetwork thus has an unsigned mean flux density ranging from 0.1 to 80 Mx/cm2 (while the total flux is zero). The overall net flux density is always 1.5 Mx/cm2, since only the central magnetic concentration contributes to the net flux. (See Table 1).
| network | internetwork | ||
|---|---|---|---|
| size of magnetic patches | |||
| fwhm | [km] | 169 | 96 |
| flux of magnetic patches | |||
| [Mx] | |||
| unsigned total flux | |||
| [Mx] | |||
| unsigned mean flux density | |||
| [Mx/cm2] | 1.5 | ||
| net flux | |||
| [Mx] | 0 | ||
Concerning the spatial distribution we constructed 22 sets of randomly distributed internetwork patches. We then calculated a magnetogram for each of the 22 spatial distributions with each of the 19 sets of internetwork fluxes. Together with the 4 conditions discussed in the next subsection this adds up to a total of 1672 configurations.
Through this we can study independently (1) the impact of the strength of the magnetic flux in the internetwork and (2) the role of the spatial distribution of magnetic patches in the internetwork, both at the bottom boundary, i.e. the photospheric level.
2.2.2 Configuration of the upper boundary
In contrast to the work of Schrijver & Title (2003) we will also investigate the role of the upper boundary on the flux budget from the network patches into the corona. To explore this we employed four different upper BCs for the magnetic field extrapolation outlined in Sect. 2.1. These are partly carried to the extreme (especially item 4) and are not necessarily realistic, but have been chosen to illustrate possible effects of the upper boundary.
(1) In the first case we assume the field to be stretching to infinity (in the same way as e.g. Alissandrakis, 1981), i.e. in (5).
(2) The next case uses a configuration at Mm extracted from the extrapolation method used also by Schrijver & Title (2003) as an upper BC. By this we match the -component at Mm with their work for a reliable comparison.
(3) In a third case we applied a 2D Gaussian curve on top of a constant field at a height of Mm at the upper boundary, i.e. a broad (FWHM 6 Mm wide) maximum just above the central network patch. In order to have a realistic variation at the upper boundary, we examined an actually observed magnetogram (obtained with MDI) for a region that showed a magnetic configuration similar to what we have considered the quiet Sun in this work. Applying a standard potential field extrapolation, with an upper boundary as for case (1), we derived a variation of some 5.5% at Mm. This we used for the amplitude of the Gaussian above the background.
(4) For the last case we deployed a very unrealistic magnetic configuration at Mm to see what effect a really extreme upper boundary might have. For this we used the same Gaussian as in case (3), but now with 50% variation, i.e. with the magnetic field strength being depressed by a factor of 2 at the upper boundary directly above the central network patch.
2.3 Budget of magnetic flux
Once three-dimensional grids of complete sets were computed through the extrapolation as described above we determined field lines by tracing paths of monopolar test particles through the box.
2.3.1 Field line tracing
Schrijver & Title (2003) traced field lines starting in random directions from the central network patch in the plane. Their method then follows magnetic field lines until they either connect back onto the source plane or reach a maximum height, i.e. an upper boundary.
One of the main goals of our work is to find the fraction of magnetic flux from the strong network patch, that has made its way into the corona, i.e. to the upper boundary. Therefore we start our field line tracing at the top boundary ( Mm). Once lines reach the plane, we count them either as connecting the network or the internetwork to the corona, depending whether or not they are coming down on the central network patch.
We start tracing field lines from a regular grid at the upper boundary with a spacing of 100 km. By this reverse approach we achieve a high precision when answering the question where the source of coronal magnetic flux is located.
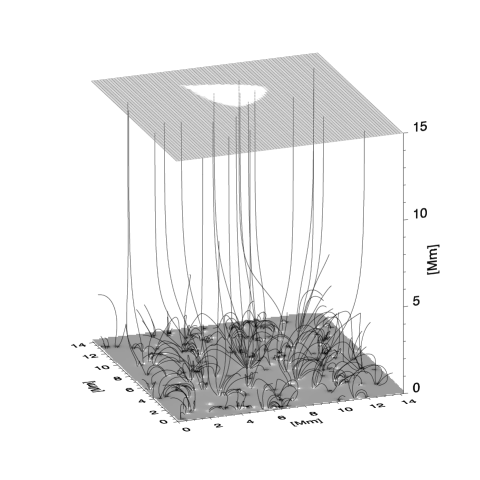
For the purpose of plotting the filed line configurations as shown in Fig. 1 and 3 we trace the field lines also from the bottom boundary, of course. Fig. 1 shows the field lines for a sample potential field extrapolation. At the bottom of the figure the distribution of the (vertical) magnetic field is displayed, while the upper part of the plot shows a mask, where the area at a height of 15 Mm connected to the central strong network magnetic field patch is plotted in white, while the area connected to the weak surrounding internetwork patches is shaded gray.
2.3.2 Connecting network and corona
The equivalent flux carried by each field line counts either towards the network or the internetwork flux contingent. The amount of magnetic flux associated with a given field line is calculated through
where denotes the area of the resolution element at the top boundary to which the field line is connected to, i.e. the grid spacing of 100 km 100 km. Respectively is the field strength at that resolution element.
The sum of those fluxes associated with the field lines connecting the network patch to the upper boundary gives the flux in the corona originating from the magnetic network element. Comparing this to the total magnetic flux of the network patch , i.e.
| (6) |
yields the fraction of magnetic flux from the network which is connected to the corona.
3 Results and Discussion
We applied the extrapolation method and the calculation of the flux budget from the network patch into the corona for all of the 1672 sets of boundary conditions, viz. photospheric magnetograms. As a subset these also include the approach used by Schrijver & Title (2003).
The fraction of magnetic flux that expands from the network patch to reach the corona was calculated for four distinct -configurations at the upper boundary (cf. Sect. 2.2.2) combined with 22 different (random) distributions of magnetic patches in the internetwork field (cf. Sect. 2.2.1). Each of these 88 configurations was repeated for 19 different unsigned mean magnetic flux densities of the internetwork field ranging from 0.1 to 80 Mx/cm2 (cf. Sect. 2.2.1).
In the following we compare our results with those presented by Schrijver & Title (2003) in Sect. 3.1, investigate the impact of the upper boundary (Sect. 3.2) and study the role of the lower boundary (Sect. 3.3).
3.1 Comparison to previous work
Recalculating the models of Schrijver & Title (2003) including an evaluation of the flux budget enabled us to positively verify their results. As they perform the extrapolation using a distribution of magnetic charges, their study might be called “point charge model”. Based on such a model we calculated the average value of the fraction defined in (6) of magnetic flux from the network patch being connected to the corona for the various distributions of internetwork flux at the lower boundary (Sect. 2.2.1). The dot-dashed line in Fig. 2 shows the average fraction as a function of the unsigned mean internetwork flux density. We find the same roughly exponential decrease of the fraction as Schrijver & Title (2003), differing by 0.05 to 0.08 as compared to their results. This deviation basically stems from using either field line tracing starting from above (Sect. 2.3.2) as done in this work or the method of Schrijver & Title (2003) starting from below.

We can now also compare the point charge model with a potential field extrapolation utilizing a Fourier transformation (FT) technique as outlined in Sect. 2.1 with a upper BC as given in case 2 of Sect. 2.2.2, i.e. which has the same magnetic field distribution at the upper boundary as the point charge model. The result for the average fraction for this experiment is plotted as a thick solid line in Fig. 2. The thin solid lines indicate the scatter of the values derived for the different spatial distributions of the weak internetwork flux patches. The difference of the point charge model (dot-dashed) and the FT technique (solid) is rather small, which shows that the two methods give similar results. Thus we regard it as justified that both methods are likewise suitable to tackle the problem at hand. In our work we proceed using the extrapolation model in order to be able to determine the possible impact of the upper boundary, which could not be handled by the point charge model.
3.2 Impact of the lower corona on the network coupling
We first turn to the impact of the coronal configuration on the connectivity from the chromosphere into the corona, i.e. the role of the upper boundary. Depending on the large-scale structures in the corona one might imagine different magnetic configurations at the low corona. For example, while one might expect a rather constant magnetic field at a height of some 15 Mm in a more or less unipolar coronal hole, one could expect a rather strong variation in a network patch located near an active region. To explore this we employ four different sets of upper BCs (see Sect. 2.2.2).
For these cases we evaluated the fraction of magnetic flux from the network element reaching the corona in the same way as in the previous section. We find that for all (!) cases of the upper BC the resulting fractions are practically the same. In other words, comparing the budget of magnetic flux connecting the network patch and the corona for substantially diverse -configurations at the upper boundary, we find no evidence of an impact of the magnetic field distribution in the low corona on the magnetic connection from the chromosphere to the corona. This is true even for the quite “pathological” case 4 outlined in Sect. 2.2.2, with a very strong (unrealistic) depression of the magnetic field above the network patch by a factor of 2.
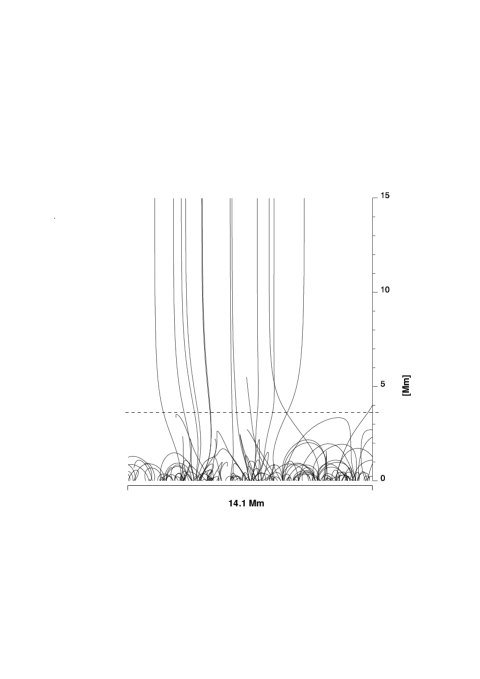
This result can be illustrated by a display of magnetic field lines when looking at the computational domain from the side (see Fig. 3). Above an altitude of about 5 Mm the magnetic field is basically open, i.e. all the field lines found above that magnetic transition are connected to the corona (the dashed line in Fig. 3 shows the height of the highest-reaching closed field line in that selection). Above this magnetic transition the small scale “salt and pepper” structure of the internetwork magnetic field is cleared and a more or less vertical -component dominates. The height of that magnetic transition is, of course, related to the mean distance of the magnetic polarities in the photosphere, which is for the distributions of the present work as well as on the real Sun of the order of a couple of Mm.
The good news of this little experiment is, that any physically reasonable assumption for the magnetic field at the upper boundary is sufficient, supposing it is assigned at an altitude above the magnetic transition, i.e. above some 5 Mm. This is of special interest, as we are not really able to measure coronal magnetic fields as of yet, except for some special cases (e.g. Lin et al., 1999; Lagg et al., 2004; White, 2005). Thus even without a proper information on the magnetic field in the low corona we can study the magnetic connectivity from the chromosphere into the corona by means of magnetic field extrapolations in a meaningful way on a granular and super-granular scale.
3.3 Impact of the photospheric field distribution on the magnetic connectivity
We will now turn to the role of the lower boundary, i.e. the photospheric magnetic field for the magnetic connectivity into the corona. As emphasized by Schrijver & Title (2003) a sizable fraction of the corona is connected not to the strong network patches, but to the weak internetwork fields. Thus when trying to relate coronal phenomena to chromospheric events, one cannot simply look for e.g. a correlation of the corona with a network patch below, but coronal events can also be triggered by processes in the internetwork. The basic question is here if we can use the magnetic field extrapolations to derive which coronal structures are connected to which areas in the photosphere and chromosphere, no matter if in the network or internetwork.
To tackle this question we will investigate the spatial distribution of the weak internetwork magnetic field patches in our simulated magnetograms, which are hardly resolved by current instrumentation. For example MDI onboard SOHO (Scherrer et al., 1995) has a sensitivity of some 20 Gauss (if being optimistic) and a spatial resolution in the high-resolution modus of 1 arcsec (0.5 arcsec pixels) corresponding to 725 km. Thus this instrument, which is often used to study the relations of magnetic field and coronal phenomena, can detect magnetic flux concentrations down to some Mx. Therefore most of the small internetwork flux patches ranging from to Mx as used in this study (cf. Sect. 2.2.1) are not detectable with MDI. And even for todays most sophisticated high-resolution spectro-polarimeters this is a difficult task, especially at the low flux end. For example Polis at the German VTT in Tenerife (Beck et al., 2005) can go down to some 5 Gauss with a resolution of 0.5 arcsec, if seeing conditions permit, i.e. down to fluxes of some Mx.

In conclusion, especially the small internetwork flux concentrations we inverstigatetd here are hard to resolve; with some Mx they correspond to a 1000 G flux tube with 36 km diameter. As there is no real reason to belive that such small structures do not exist, e.g. they are found in numerical simulation of magneto-convection (e.g. Vögler et al., 2005), it is an interesting task to investigate the influence of such small salt-and-pepper-like flux concentrations to the magnetic connectivity into the corona.
3.3.1 Connectivity and flux distribution
To investigate the role of the actual spatial distribution of magnetic flux at the bottom, viz. the photosphere, it is instructive to study individual examples of the random distributions of the internetwork flux patches.
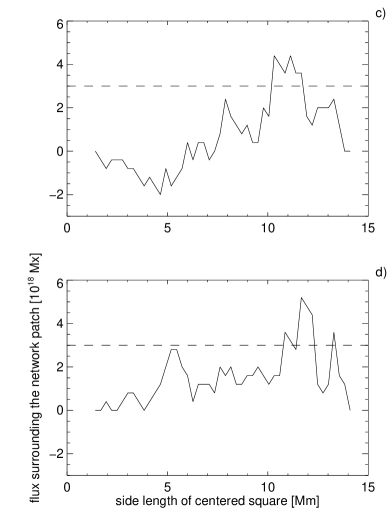
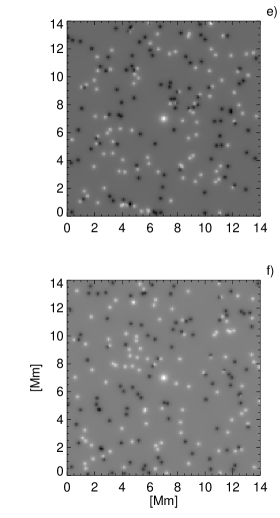
Two examples are shown in Fig. 4. The right column shows the lower boundary conditions for both cases, i.e. the magnetograms constructed from the random distributions of flux patches of the internetwork and the network patch in the middle. The images display the vertical component of the magnetic field on a grey scale, with black and white representing opposite polarities. As outlined in Sect. 2.3.2 we calculated the fraction of flux from the network patch reaching the corona for various values of the flux of the internetwork patches (but respectively always for the same spatial distribution).
The resulting fraction as a function of unsigned mean internetwork flux density is shown in the respective graphs in the left column of Fig. 4. As can be easily seen the fraction of network flux reaching the corona is quite different in the two sample spatial distribution. While in one case (top row in Fig. 4) basically all coronal flux is originating from the internetwork (!) for average unsigned internetwork fluxes above some 50 Mx/cm2, in the other case always more than some 20% of the network flux reach the corona, even for very strong internetwork fields (bottom row). On average, i.e. when considering a large number of random spatial distributions of the internetwork patches, one ends up with a fraction somewhere between the two extremes shown in Fig. 4, and this average result was already discussed in Sect. 3.1 and Fig. 2. Of course, this is simply due to the distribution of flux directly surrounding the central strong network patch. The middle column of Fig. 4 shows the total internetwork flux surrounding the network patch in a square with a length of a side , i.e. excluding the network patch. In one case (top row) the surroundings of the central (positive) network patch are dominated by negative charges, in the other case (bottom row) the opposite is true. Thus depending on the dominating sign of magnetic flux near the network patch one will get a very low or a very high fraction of the network flux being connected to the corona.
In a way, there is a chance for special configurations of the internetwork flux patches to “neutralize” the strong network patch, so that most of the coronal magnetic field actually originates from the internetwork.
The intriguing part of this (in principle obvious) result is as follows. If the internetwork field patches are hardly resolvable by observations, but still can significantly alter the amount of flux from the network reaching the corona, we are confronted with a clear limitation for current investigations of the interaction between the chromosphere and the corona.
3.3.2 Mapping the corona back to the photosphere
So far we have examined the connectivity between the photospheric field and the corona only quantitatively through the fraction of network flux reaching the corona. We will now turn to mapping coronal regions back to the photosphere and vice versa.
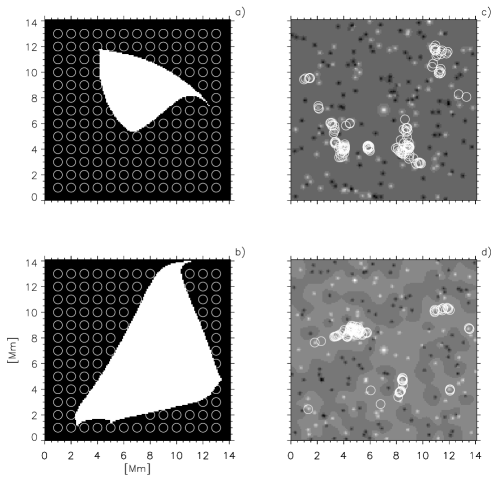
The masks in the left panels of Fig. 5 show in white the areas in the corona at a height of 15 Mm which are connected to the central network patch in the photosphere, i.e. at the lower boundary. Here we used the same sample distributions of weak internetwork magnetic flux patches as in the previous subsection and Fig. 4.
This reveals that the corona is quite sensitive to the structure of the weak internetwork fields: the coronal volume which is connected to the strong magnetic network patches changes significantly, if a different distribution of weak internetwork field patches is prescribed. Our computations show that this is valid even down to very low flux concentrations (– Mx) in the internetwork, which are hardly resolvable at the current state of observational capabilities.
It is not only problematic to derive the coronal area(s) connected to the network patch, but also to identify which parts of the internetwork are connected to the corona seems hardly possible when using current instrumentation. This is illustrated also by Fig. 5, where the intersections with the top and bottom boundary of the fieldlines connecting the internetwork with the corona are indicated by circles. From the right panels it is evident, that the internetwork footpoints of the fieldlines connecting to the corona cluster at completely different regions, depending on the distribution of the photospheric internetwork flux.
These results have serious implications for studies of the relation of the photospheric field to the coronal structures, e.g. as been done in the context of solar wind acceleration and its relation to the chromospheric magnetic network (e.g. Xia et al., 2004; Tu et al., 2005). When using data from the MDI instrument, as mostly done in studies relating the corona to the photosphere in recent years, one is not able to resolve the weak internetwork fields as modeled in the present paper. This implies, that in those studies one cannot definitely pin down which areas in the low corona are in fact connected to which parts of the photosphere. Certainly, under the presence of weak fields, the connection from the coronal features down to the photosphere will not be nice and funnel-type, but more spaghetti-type with a lot of connections from the coronal patches to the internetwork. Better future instrumentation with superior sensitivity for measuring photospheric fields will hopefully provide the necessary information to allow advanced studies of the connectivity from the photosphere to the corona.
4 Conclusions
In the present paper we investigated the role of the magnetic field distribution in the photosphere and the low corona for the mapping from the chromospheric magnetic network into the corona utilzing magnetic field extrapolations. The classic picture was that the field fans out from strong network concentrations in the chromosphere creating an often called canopy (Gabriel, 1976), which could be seen as a more or less stable foundation of the coronal magnetism. Extending the work of Schrijver & Title (2003), who are challenging this scenario, we manipulate the boundary conditions of a potential field extrapolation at the top and bottom of a computational box stretching from the photosphere to the low corona at some 15 Mm height. This allows us to investigate the mapping from the photosphere into the corona in great detail.
The good news are that the photosphere–corona connectivity is very stable against changes of the top boundary, i.e. the magnetic field in the lower boundary at heights of around 15 Mm. This is very reassuring when studying different regions on the Sun, such as coronal holes, active region patches or quiet Sun, where one might expect different magnetic field structures in the low corona: when investigating the connection e.g. of coronal Doppler shifts and photospheric fields to study the driving of coronal dynamics, a magnetic field extrapolation from an observed high-quality magnetogram seems to be sufficient to identify the respective areas in the photosphere and the corona which are magnetically connected (cf. Sect. 3.2).
However, the reliability of the magnetic connection derived from the field extrapolation hinges on the quality of the information about the weak small-scale magnetic field in the photosphere. Changes in the distribution of the weak internetwork magnetic flux patches, which are hardly observable with current instrumentation, can lead to dramatic differences in the connectivity from the photosphere into the chromosphere, qualitatively as well as quantitatively. Especially the mapping from the photosphere into the corona, i.e. which photospheric regions are magnetically connected to which coronal areas, is quite sensitive to the distribution of weak internetwork flux. With current instrumentation only beginning to resolve the structure of the internetwork magnetic field, one has to be careful when drawing conclusions on magnetic connections from network patches to the corona, as one cannot really tell about the role of the internetwork (cf. Sect. 3.3).
It will be exciting to investigate the polarimetric studies with new high-resolution instruments from space as well as from the ground, e.g. the soon to be started Solar B mission or the 1.5 m solar telescope Gregor with their sensitive full Stokes polarimeters. Such studies will be of great importance to better understand the driving of the corona through the underlying photospheric convection.
References
- Alissandrakis (1981) Alissandrakis. 1981, A&A, 100, 197
- Beck et al. (2005) Beck, C., Schmidt, W., Kentischer, T., & Elmore, D. 2005, A&A, 437, 1159
- Domínguez Cerdeña et al. (2003) Domínguez Cerdeña, I., Kneer, F., & Sánchez Almeida, J. 2003, ApJ, 582, L55
- Faurobert et al. (2001) Faurobert, M., Arnaud, J., Vigneau, J., & Frisch, H. 2001, A&A, 378, 627
- Gabriel (1976) Gabriel, A. H. 1976, Phil. Trans. Roy. Soc. Lond., A 281, 339
- Giovanelli (1980) Giovanelli, R. G. 1980, Solar Phys., 68, 49
- Lagg et al. (2004) Lagg, A., Woch, J., Krupp, N., & Solanki, S. K. 2004, A&A, 414, 1109
- Lin et al. (1999) Lin, H., Penn, M. J., & Tomczyk, S. 1999, ApJ, 541, L83
- Lin & Rimmele (1999) Lin, H. & Rimmele, T. 1999, ApJ, 514, 448
- Livingston & Harvey (1975) Livingston, W. C. & Harvey, J. W. 1975, BAAS, 7, 346
- Sánchez Almeida et al. (2004) Sánchez Almeida, J., Emonet, T., & Cattaneo, F. 2004, ApJ, 585, 536
- Scherrer et al. (1995) Scherrer, P. H., Bogart, R. S., Bush, R. I., et al. 1995, Solar Phys., 162, 129
- Schrijver & Title (2003) Schrijver, C. J. & Title, A. M. 2003, ApJ, 597, L165
- Schrijver et al. (1997) Schrijver, C. J., Title, A. M., Hagenaar, H. J., & Shine, R. A. 1997, Solar Phys., 175, 329
- Socas-Navarro & Sánchez Almeida (2002) Socas-Navarro, H. & Sánchez Almeida, J. 2002, ApJ, 565, 1323
- Tu et al. (2005) Tu, C.-Y., Zhou, C., Marsch, E., et al. 2005, Science, 308, 519
- Vögler et al. (2005) Vögler, A., Shelyag, S., Schüssler, M., et al. 2005, A&A, 429, 335
- White (2005) White, S. M. 2005, in Chromospheric and Coronal Magnetic Fields (ESA SP–596)
- Xia et al. (2004) Xia, L. D., Marsch, E., & Wilhelm, K. 2004, A&A, 424, 1025