Search for Associations Containing Young stars (SACY) ††thanks: Based on observations made under the ON-ESO agreement for the joint operation of the 1.52 m ESO telescope, on two 2.2 m ESO telescope runs, and at the Observatório do Pico dos Dias MCT/Laboratório Nacional de Astrofísica (LNA/MCT), Brazil, ††thanks: Tables 3, 4 and 5 are only available in electronic form at the CDS via anonymous ftp to cdsarc.u-strasbg.fr (130.79.128.5) or via http://cdsweb.u-strasbg.fr/cgi-bin/qcat?J/A+A/
We report results from a high-resolution optical spectroscopic survey aimed to search for nearby young associations and young stars among optical counterparts of ROSAT All-Sky Survey X-ray sources in the Southern Hemisphere. We selected 1953 late-type (), potentially young, optical counterparts out of a total of 9574 1RXS sources for follow-up observations. At least one high-resolution spectrum was obtained for each of 1511 targets. This paper is the first in a series presenting the results of the SACY survey. Here we describe our sample and our observations. We describe a convergence method in the (UVW) velocity space to find associations. As an example, we discuss the validity of this method in the framework of the Pic Association.
Key Words.:
stars: pre-main sequence – stars: formation – stars: kinematics – stars: rotation – stars: abundances – open clusters and associations: individual: Pic Association1 Introduction
Post-T Tauri Stars (pTTS), and its prototypical example FK Ser (Herbig, 1973), were introduced as a new, systematic, category by Herbig (1978) as T Tauri stars (TTS) that follow classical and weak line TTS (cTTS and wTTS) in an evolutionary sequence. The pTTS were expected to outnumber the cTTS and wTTS populations by far, but their discovery and identification remained difficult for a long time. The relation of pTTS to ”isolated” TTS (Quast et al., 1987) (young, low-mass pre-main sequence stars found spatially far away from any apparent dark or parental molecular cloud) remained an open problem. Interestingly, Herbig’s catalog of pTTS, and the suggested list of isolated TTS produced independently by the Brazilian group are actually quite similar. An intriguing case is TW Hya, a high Galactic latitude object, confirmed as TTS (Rucinski & Krautter, 1983), with a distance of at least 13 from the nearest dark clouds. Its origin remained enigmatic for a long time.
A systematic search for more isolated TTS was pursued with the optical spectroscopic Pico dos Dias Survey (PDS) among optical counterparts of the IRAS Point Source Catalog (Gregorio-Hetem et al., 1992; Torres et al., 1995; Torres, 1999). One of the first results of the PDS was the discovery of four additional TTS around TW Hya (de la Reza et al., 1989; Gregorio-Hetem et al., 1992). They concluded that this group was likely a very young association relatively close to the sun.
The putative TW Hya association was actually a very odd result. In fact, in a recent review, Zuckerman & Song (2004) reminded us that until the late 1990 the Hyades and the UMa clusters (with an age about 600 Myr and 300 Myr, respectively) were the only coeval, co-moving concentrations of stars known within 60 pc from Earth. Thus, the closest place to find very young stars (typically about 10 Myr) was in the nearby classical star forming regions, such as Sco-Cen, Taurus, Oph (at 150 pc) and Orion somewhat farther at 450 pc.
Later, Kastner et al. (1997) confirmed that TW Hya forms a physical association of about 20 Myr and at a distance of 40 to 60 pc from Earth – the TW Hya Association (TWA), based on the similarity of the X–ray fluxes, radial velocities, astrometry (Hipparcos) and their spectroscopic characteristics. Even additional members were found later (Webb et al., 1999; Sterzik et al., 1999; Zuckerman et al., 2001a; Song et al., 2003).
Only very few good candidates for isolated TTS were found with the PDS. But while the IR-excess selection criteria effectively finds young stellar objects embedded in their placental material or with circumstellar disks, it fails to signal older objects whose disks have been dissipated. Hence most stars with ages between Myr (i.e. wTTS and pTTS) escaped the discovery by this method.
Due to the enhanced X-ray activity of young stars (Walter, 1986) more efficient selection criteria for post and isolated TTS candidates were developed. The high sensitivity and full sky coverage of the ROSAT all-sky survey (Truemper, 1982) revealed thousands of new X–rays sources projected in the direction of nearby star forming regions (Guillout et al., 1998). Ground-based spectroscopic studies showed that a large fraction of these X–rays sources were indeed wTTS together with older pTTS and ZAMS stars. (e.g. Alcalá et al., 2000). Surprisingly, many of the newly found weak-line TTS were not obviously connected to any molecular cloud region which again raised many questions about their origin (Sterzik et al., 1995).
Young, nearby associations, and in particular TWA, are of great importance to understand the local star forming history, and they reveal samples of stars that allow to study the transition phase of disk dispersal and planet formation in great detail. Therefore several groups have started to look for similar nearby young associations hidden among the ROSAT X–ray sources. Shortly after the discovery of TWA eight more young nearby associations have been announced (see Torres et al. (2003) and the review by Zuckerman & Song, 2004), namely, Cha ( pc and age Myr; Mamajek et al., 1999; Lyo et al., 2004); Cha ( pc and age Myr; Mamajek et al., 2000; Feigelson et al., 2003); the Horologium Association (HorA) ( pc; age Myr; Torres et al., 2000) and the adjacent and very similar Tucana Association (TucA) simultaneously discovered by Zuckerman et al. (2001b); the Pic Association (BPA) ( pc; age Myr; Barrado y Navascués, 1998; Zuckerman et al., 2001a); the AB Dor Association ( pc; age Myr; Zuckerman et al., 2004; Torres et al., 2003, - calling it as AnA); and finally two less well defined associations, the Argus Association ( pc; age Myr; Torres et al., 2003) and the Octans Association ( pc; age Myr; Torres et al., 2003).
The similarity between the adjacent TucA and HorA motivated us to start SACY (Search for Associations Containing Young stars)111Sacy is a mythological Brazilian being, a little black boy with only one leg, that frightens night travelers. survey in 2000. Some early obsevations, obtained in 1999 for other purposes, were also included in the SACY, whose initial goal was to examine the physical relation between these two associations. Later, SACY was enlarged in order to look for other, hitherto undiscovered, nearby young associations among the optical counterparts of the ROSAT X–ray sources.
Preliminary results of the SACY have been presented in different conference contributions (Torres et al., 2003, and references therein), where we have suggested eleven potential nearby associations using the preliminary data (including components of the Sco-Cen Association). One of those first results was the existence of two somewhat superposed associations which we called GAYA1 and GAYA2222GAYA stands for Great Austral Young Association.. GAYA1 is so similar to the Tucana/Horologium Association proposed by Zuckerman & Song (2004) that we can adopt this designation, although some of their proposed members seem to match better with GAYA2 ( pc; age Myr), as we will present in a forthcoming paper. In fact, the present paper is the first one of a series that aims to present the results of the SACY. Here, we present the survey, the observed sample and the observing strategy (Sec. 2). In the associated catalog, we give the spectroscopic properties (radial velocity, , spectral type, Lithium 6708 Å and equivalent widths) as well as the photometry of the observed stars. Our kinematical approach is presented and exemplified with the known BPA (Zuckerman et al., 2001a) for which we propose new members.
2 The sample and observations
The ROSAT All-Sky Bright Source Catalogue (1RXS) (Voges et al., 1999) was used as a starting point to build an initial sample containing young star candidates. Therefore, 1RXS was cross-correlated with the Hipparcos and Tycho-2 Catalogues. We followed an approach similar to that described by Guillout et al. (1999). Within an error radius of 2.6 times the ROSAT positional error one (or more) possible optical counterparts were selected for each 1RXS source. Only stars having (from Hipparcos or Tycho-2) were considered. This cut-off is justified by the lithium depletion behavior. For young stars with spectral types later than mid-G (i.e., ) the strength of the Li 6708 Å line can be used as an youth indicator (Martin, 1997). Our cut-off (0.6) corresponds approximately to a G0 dwarf, in order not to loose interesting objects close to this boundary. We exclude hotter stars, because they lack of a similar youth indicator and due to the difficulty to obtain precise radial velocities necessary for the convergence method later employed in SACY.
We also excluded all Hipparcos stars having , because for our color limit young stars older than 5 Myr must be less luminous than . There is some subjectivity in our final list, as the positions, velocities, parallaxes, colors, and magnitudes are all affected by different errors, and we had to decide on a case by case basis about inclusion in our final list. For example, some late F stars were included and some early G may have been excluded, but these cases are not very important as we use a conservative color limit.
| RA interval | Declination |
|---|---|
| (h) | |
From an initial list containing 9574 1RXS sources in the Southern Hemisphere, we found 1953 of them having counterparts in the Tycho-2 and Hipparcos Catalogues using the above criteria. During the last seven years, 1511 stars were observed at least once. Data from the literature for 115 objects were used to complement the observed sample. (Other 153 objects were observed that do not fulfill the SACY criteria.)
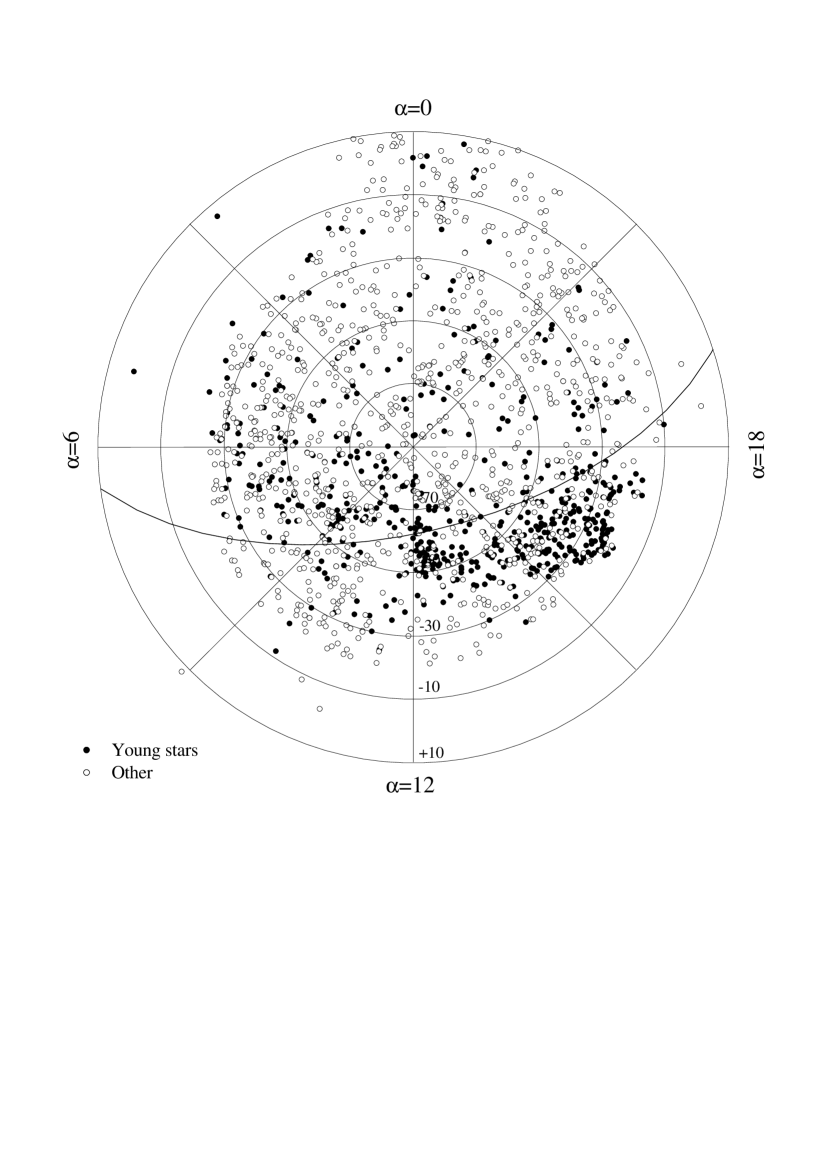
In Figure 1 we show the observed sample and in Table 1 we give the completeness of SACY as a function of right ascension. Only 3 selected sources were not observed within this area and there are also 29 stars observed outside this area, mainly near the limits defined in the table. Some of the holes seen in Figure 1 may be due to incompleteness of 1RXS. The concentration of young stars between RA h to h, corresponding to the Sco-Cen Association, is clearly visible in Figure 1.
2.1 The rejected sample
Whenever available, SIMBAD information was used to exclude stellar counterparts of the 1953 southern sources being well known RS CVn, W UMa, giant stars or any other contamination showing ab initio clear signs that they are not young late type stars. Within the area defined in Table 1 we rejected 51 sources and they are presented in Table 2.
In such way, we have covered of the 1953 sources.
| 1RXS | Ident | Type | Other |
|---|---|---|---|
| (1) | (2) | (3) | (4) |
| J005307.5-743903 | Hip 4157 | RS | CF Tuc |
| J010945.2-201300 | Hip 5452 | WUMa | CT Cet |
| J011143.2-255720 | T6425-1882 | K0III+ | BZ Scl |
| J014852.7-205340 | Hip 8447 | WUMa | TW Cet |
| J015951.5-380725 | Hip 9336 | K2III | HD 12320 |
| J023401.2-653634 | Hip 11934 | WUMa | WY Hor |
| J024208.5-463121 | Hip 12611 | K1III | HD 17006 |
| J024326.2-375540 | Hip 12716 | RS | UX For |
| J035941.3-584028 | Hip 18659 | K0III | UY Ret |
| J040729.6-523413 | Hip 19248 | RS | AG Dor |
| J041425.3-204921 | T5889-1407 | K1III SB2 | HD 26917 |
| J044145.7-471540 | Hip 21843 | G8III | HD 30042 |
| J050135.3-444955 | Hip 23381 | K0III | HD 32517 |
| J051833.2-681328 | T9162-0347 | WUMa | RW Dor |
| J082401.6-694149 | T9198-0008 | A2 | HD311345 |
| J085943.2-274850 | Hip 44164 | RS | TY Pyx |
| J091756.4-372350 | Hip 45623 | G3III | HD 80332 |
| J100352.1-561134 | T8603-1735 | K1III | HD 87525 |
| J103733.8-564757 | T8609-1385 | XB | 4U1036-56 |
| J110952.1-762909 | T9410-2627 | A7V | CD-75 522 |
| J111510.2-611540 | Hip 54948 | Cl | NGC3603 |
| J112545.4-763035 | T9411-1577 | K0III | HD 99558 |
| J112557.8-401547 | T7743-1091 | G6II | HD 99409 |
| J113616.1-380210 | T7740-0698 | RS | V858 Cen |
| J113922.1-392315 | Hip 56851 | RS | V829 Cen |
| J114929.5-504849 | T8228-0126 | K1III | HD102726 |
| J125850.0-365827 | Hip 63347 | WUMa | V839 Cen |
| J132711.7-245126 | T6717-0230 | Gal Sey | |
| J135155.7-363726 | Hip 67682 | WUMa | V757 Cen |
| J140710.6-510131 | T8276-0897 | Gal | |
| J160546.1-395032 | T7855-0905 | D2”(A5V+?) | A:HD144118 |
| J162804.7-491150 | T8320-2046 | XB | 4U1624-49 |
| J163528.5-480556 | T8329-1465 | B8 | HD330993 |
| J172446.8-341224 | T7383-0007 | Cl | Pr 24 |
| J172509.3-341117 | T7383-0162 | Cl | Pr 24 |
| J173728.0-290759 | T6839-0472 | Gal Sey | |
| J175620.0-721850 | T9297-0956 | F2IV D0.8” | HD162128 |
| J180108.7-250444 | T6846-0633 | XB | 4U1758-25 |
| J180847.7-260037 | T6847-3167 | B9 | HD315209 |
| J181806.3-121439 | Hip 89681 | Cl | NGC 6604 |
| J181842.3-134706 | T5689-1381 | Cl | NGC 6611 |
| J182030.8-161022 | T6265-1255 | Cl | NGC 6618 |
| J182615.1-145034 | T5702-1197 | XB O7V | V4138 Sgr |
| J192240.0-203840 | Hip 95244 | K2III | V4138 Sgr |
| J202052.5-300213 | T7442-0726 | Gal Cl | ACO 3674 |
| J213949.1-160018 | Hip 106961 | RS | AD Cap |
| J214906.4-304157 | T7488-0390 | Gal Cl | ACO 3814 |
| J220036.3-024433 | Hip 108644 | G5III+sdOB | FF Aqr |
| J231324.1+024028 | Hip 114639 | K1III | SZ Psc |
| J232748.5+045126 | Hip 115819 | WUMa | VZ Psc |
| J234351.0-151655 | Hip 117054 | M4III | R Aqr |
2.2 Spectroscopic observations
Most of the spectroscopic observations () were performed with the high-resolution () FEROS échelle spectrograph (Kaufer et al., 1999) at the 1.5 m/ESO telescope at La Silla (Chile) between January 1999 and September 2002 (ON-ESO agreement and ESO program identification 67.C-0123). In October 2002, FEROS was moved to the 2.2 m telescope. After that, two more runs (ESO program identifications 072.C-0393, 077.C-0138) were carried out aimed mainly to collect additional radial velocity points to resolve the orbits of the previously identified spectroscopic binaries. We noticed no relevant changes in the zero-point and/or in the spectrograph resolution (see below). The FEROS observations were taken in the OS (Object-Sky) mode. The reduction of the spectra was performed by the FEROS pipeline including flat-fielding, background subtraction, removal of cosmic rays, wavelength calibration and barycentric velocity correction, yielding as the final product a 1D re-binned spectrum.
Another set of data () was collected at the coudé spectrograph attached to 1.60 m telescope at the Observatório do Pico dos Dias (OPD), LNA, Brazil. The setup used was centered at 6500 Å covering a spectral range of 450 Å with a resolution of . These observations were reduced with standard IRAF packages.
A few observations were collected using the two-fiber-fed high-resolution spectrograph CORALIE () (Queloz et al., 2000) attached to the Swiss Euler Telescope, also at La Silla, Chile. As for FEROS, all observations were taken in the OBJ2 mode, i.e., one fiber centered on the target star and the other fiber illuminated by the background sky. Similarly to FEROS, CORALIE also has an on-line reduction system which processes the raw frames following the same steps as described above for FEROS pipeline.
2.3 Photometric data
photometry for part of the sample was obtained using FOTRAP (Jablonski et al., 1994) at the 0.60 m Zeiss telescope of the OPD. When a star was not observed photometrically by us we try to obtain some useful photometric data in the Hipparcos and Tycho Catalogues or in the available literature in the SIMBAD. For multiple stars, magnitudes and colors were corrected in order to account for the presence of the companion. We will use in the paper preferentially the color. If no observed value is available we use one deduced from the when or otherwise from the spectral type.
3 The SACY Catalog
The SACY Catalog contains the objects studied in our survey. The tables are only available in electronic form. The Table 3 (The SACY sample) contains the data for 1626 stars, 1511 observed by us and 115 objects with information from the literature. In the Table 4 (Other observed stars) we list 153 observed stars that do not fulfill the SACY criteria. The structure of both tables is identical, and they contain astrometrical data, radial and rotational velocities, photometric and spectroscopic data. Bibliographic sources used in the catalog are given in the Table 5 (The bibliographic sources).
4 Analysis
The primary goal of the SACY is to derive space motions for all young 1RXS sources in the Southern Hemisphere. Thus, our main effort was to obtain reliable radial velocities from the spectroscopic observations. Combined with Hipparcos parallaxes and proper motions, they allow us to compute the (UVW) components of the Galactic space velocity vector which, in turn, is the key ingredient to find young associations (see below). The spectroscopic observations also enable us to obtain the spectral types and to measure both the Li 6708 Å and the equivalent widths, which are used as youth indicators.
4.1 Radial and rotational velocities
Radial velocities were derived by cross-correlating our FEROS and coudé spectra with the spectrum of the radial velocity standard Tau Cet (HD 10700) observed at the same night and used as template. During the periods where Tau Cet was not visible, 3 other radial velocity standards from the CORALIE Extra-Solar planet Survey were kindly provided by the Swiss Team and used as reference. In very few nights no template could be observed. In these unfortunate cases, the template observed in an adjacent night was used. As we have not used very red templates, our radial velocities for red dwarfs may be less precise.
In order to spot eventual errors, radial velocities were computed by two of us independently using the task fxcor from IRAF and the method described in Melo et al. (2001). This latter makes use of K0 CORAVEL-type binary mask (Baranne et al., 1979) as cross-correlation template. In both methods, the resulting cross-correlation function (CCF) can be approximated by a Gaussian function whose center readily gives the radial velocity and the width is related to the broadening mechanism such as turbulent motions, gravity pressure and rotation.
The photon noise errors on the radial velocity measurements computed as described in Melo et al. (2001) are very low thanks to our good which is always better than 30-50. Thus the uncertainties on the radial velocities are dominated by the spectrograph drift during the night due to changes in the air index and atmospheric pressure. These shifts are of the order of a few hundreds m s-1 per night. A more realistic idea of our overall precision can be obtained by measuring the dispersion of the radial velocity standard Tau Cet measured almost every night during our observing runs. The mean radial velocity and its r.m.s are respectively -16.316 km s-1 and 0.320 km s-1 spanning over 1050 days of interval.
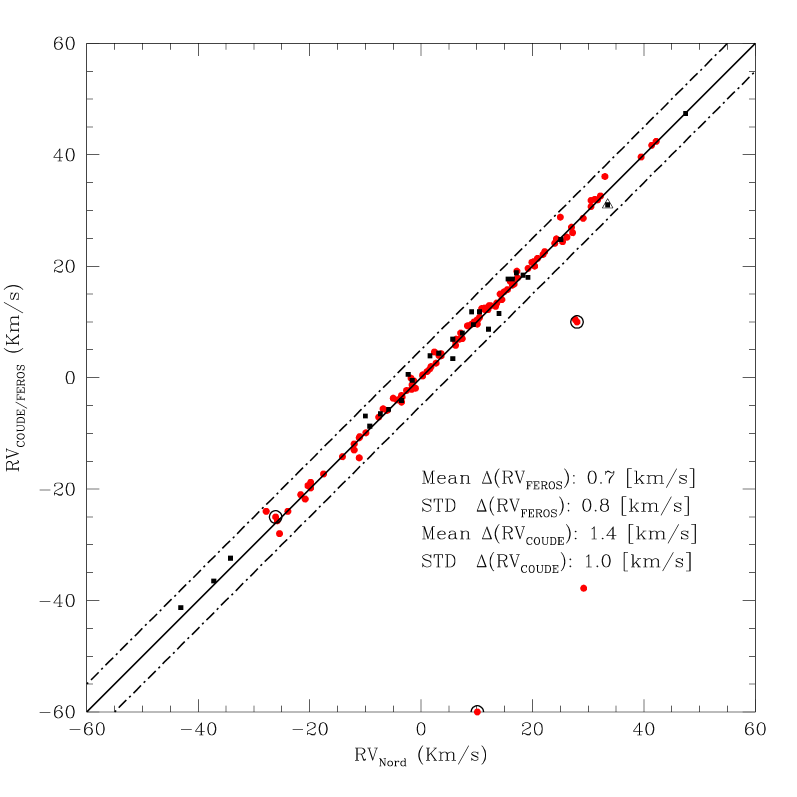

In Figure 2 (top) we compare our radial velocity measurements with those from Nordström et al. (2004). Radial velocities obtained with FEROS are shown as filled circles whereas those obtained with the coudé are seen as filled squares. The continuous line is the one-to-one relation and the two dashed-dotted lines delimit a 5 km s-1 region around the continuous line. We have used the mean radial velocity error () and the dispersion of the radial velocity measurements () given by Nordström et al. (2004) to exclude as much as possible bad quality radial velocity measurements or multiple systems out of Figure 2. In this sense, objects with km s-1 or with were excluded. The remaining known binaries not excluded by these criteria are overploted by circles and triangles, respectively for FEROS and coudé observations. Thus, excluding the known binaries and one point whose km s-1 we have a systematic difference 700 m s-1 and a r.m.s around the one-to-one relation of 800 m s-1 for the FEROS radial velocities. For the coudé measurements the mean difference is about 1.4 km s-1 and the r.m.s about 1 km s-1. These results show the very good agreement of our radial velocities with those obtained with CORAVEL by Nordström et al. (2004) and also that the FEROS and coudé measurements can be combined since the systematic shift between the two instruments is within the errors.
As a byproduct of the radial velocity measurements, projected rotational velocities were computed for the FEROS spectra using the calibration of Melo et al. (2001). For fast rotators ( km s-1) the final rotational velocities were derived as in Melo (2003). In Figure 2 (bottom) we compare our rotational velocities with those from Nordström et al. (2004). Multiple stars are shown as encircled symbols. Again, the one-to-one relation is shown as a continuous line whereas the dashed-dotted lines mark the errors of 2 km s-1 for km s-1 and of the observed for km s-1. A closer investigation of the 6 deviant points (those several km s-1 away from the one-to-one relation) show that based on the high given by Nordström et al. (2004), these objects are likely to be multiple stars seen in blend.
4.2 Spectral type, Li and


Spectral classification was carried out for the observed spectra using a combination of three different procedures: i) comparison with the Montes et al. (1997) spectral library, ii) calibrations of Tripicchio et al. (1997, 1999) for the Na I D and K I 7699 Å lines and, iii) the method developed by Torres (1999) in the region. The good quality of the obtained spectral types can be seen in Figure 3 where we plot the against our spectral types for dwarf stars. We estimate the error in our spectral type classifcation to be about one sub-class. Part of the spread in Figure 3 is real, as we are dealing with young stars, having distinct color excess, due to cool stellar spots, circumstellar material, etc.
Equivalent widths of the Li 6708 Å and the lines were measured from the FEROS or coudé spectra using IRAF splot task. We estimate for low rotators ( km s-1) observed with FEROS an error of Å and twice for stars observed with the coudé. The distribution of the Li equivalent width as a function of the is given in Fig. 4. The large spread seen in Fig. 4 is expected and it reflects the spread in age of the X-ray stars (Neuhäuser, 1997). The combination of the Li equivalent widths and the color indexes was used to discriminate the sub-samples of young stars, the Pleiades age stars and the old stars, as can be seen in the figure.
But in the search for young associations we will consider ”young star” if the Li equivalent width is at least 90% of that observed for the Pleiades members for a given . The few stars later than M0 with undetectable Li were included in this young sub-sample as the Li may be completely depleted for M stars already in the PMS phase (Martin et al., 1994).
In summary, from a sample of 1626 stars (1511 stars observed by us and 115 stars taken from the literature), we classified 255 as giants stars and 1371 as dwarf stars. We considered as dwarfs also the subgiant stars (many of the young stars are spectroscopically classified as subgiants), and 22 stars for which we did not obtain a luminosity class (mainly fast rotators or young stars taken from the literature). Among these 1371 dwarfs, 565, 282 and 524 are considered respectively younger, having similar age or older than the Pleiades.

5 Finding associations: the kinematical method
Intuitively one can consider an association as a group of stars appearing concentrated together in a small area in the sky sharing some common properties such as age, chemical composition, distance and kinematics. However, if such a group is close enough to the Sun, its members will appear covering a large extent in the sky (as an example, Orion at 50 pc would cover almost the whole sky). Thus, to find a group, projected spatial concentration (i.e., in terms of right ascension and declination only) and proper motions may not be enough. A better criterion is to look for objects sharing similar space motions (UVW) all around the sky (U positive towards the Galactic center, V positive in the direction of Galactic rotation). To obtain space velocities, proper motions (, ), radial velocities and parallaxes are needed. Since most of the young stars observed in the SACY have no parallaxes, a convergence method to dynamically estimate their distances has been developed. This method is described below and applied to the BPA in the next section.
5.1 The kinematical convergence method
As an initial step before applying the convergence method, we search for an initial point (UVW)0 in the UVW–space around which a concentration of objects is observed indicating the existence of a possible association. This can be done basically in three different ways:
i) considering only stars with known parallaxes; ii) considering all stars with and without measured parallaxes; iii) using reliable information from the literature.
i) In the first case, visual inspection of the distribution of objects in the UVW–space can already reveal clustering around some points of the UVW–space. These points may furnish a starting point, (UVW)0, for the convergence method.
ii) In the second case, all stars are considered regardless whether they have parallaxes or not. For those without parallaxes a distance is found assuming a common age for all objects. (UVW) velocity components are then computed for all stars and as above, any observed concentrations in UVW–space can be used as starting point.
iii) A third source for the (UVW)0 may be the literature. For instance, the starting point for the BPA, presented in Section 6, can be found either applying (i) or taking the (UVW) given by Zuckerman & Song (2004).
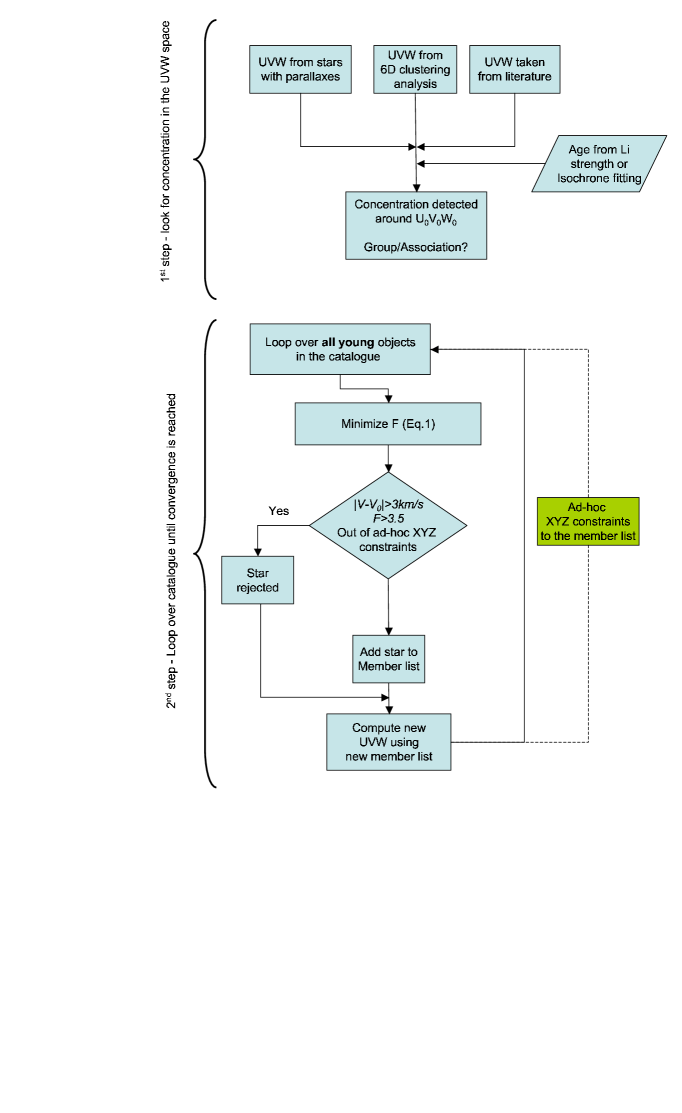
An additional ingredient needed to start the convergence method is the age which is estimated by the Li 6708 Å strength and the isochrone fitting. Once we have an (UVW)0 and an age assigned we loop over all young stars of our sample. For each star we search the distance which minimizes the quantity . The function is a quadratic combination of the evolutionary distance (i.e., distance in magnitudes of a given star to the adopted isochrone) and the kinematic distance which is the Cartesian distance in of the (UVW) of a star to the starting point (UVW)0:
where is a constant weighting the importance of the evolutionary distance with respect to the kinematic distance. The kinematic distance is, in other words, the modulus of the velocity vector
| (2) |
A limit of 3 km s-1 (i.e., ) corresponding to 3 times the typical velocity dispersion of open clusters is set as kinematical criterion along with which corresponds approximately to an evolutionary distance of less than 2 mag. If both conditions are observed the star is classified as possible member.
The procedure is then repeated until the convergence in the mean (UVW) is reached and the member list does not change any further.
As the main concentrations in UVW–space are also spatially localized, albeit some of them covering large areas in the sky, the distribution of the objects in physical space (XYZ) is used as an additional constraint. In some cases similar concentrations in (UVW) split up completely in the XYZ-space (Torres et al., 2003).
In general, ad-hoc limits in (XYZ) have to be imposed to avoid spurious stars and, for nearby associations in UVWXYZ–space, mutual contaminations. In these cases, the procedure is repeated with the new spatial constraints. A summary of the description given above is schematically presented as a flow-chart in Figure 5.
It is worth noticing that due to the way our starting sample was defined (c.f., Sec. 2) the members of the associations found by the SACY are a sub-sample (or a lower limit) of the full list of members.
5.2 Membership probabilities
We apply an alternative, objective, method to assess membership probabilities of the stars in associations suggested by the kinematical convergence analysis. We employ a predictive classification scheme that assumes group membership a priori for a certain sub-sample of objects, the so-called training set. For example, we can assume a training set derived by the kinematical convergence method.
Our method works as follows: For each object, we standardize all 6 variables UVWXYZ by subtracting a mean value and dividing by a standard deviation in order to guarantee similar weighting of each component in the 6-dimensional space. Means and standard deviations are derived from the training set only. Next, we apply a distribution free k-NN (k nearest neighbors) analysis to the entire sample to assign probabilities for each object. This approach dispenses with the need to introduce a probability density function. probabilities are calculated by defining euclidean spheres around each object in the 6 dimensional space that contains exactly objects. These objects contain objects from the training set, and (trivially) other objects. The membership probability is then simply defined as . is defined for each point in the 6-dimensional UVWXYZ–space, and changes discontinuously in steps of . This method is, for example, used to analyze the large-scale spatial distribution of X-ray selected TTS from the ROSAT survey (Sterzik et al., 1995), and more details can be found in Murtagh & Heck (1987).
The use of the convergence method to define a bona-fide list of members is independent of the assessment of membership probability described here. Therefore, potential members suggested by other works whose radial velocity and/or parallaxes have been collected from the literature might be tested in similar way to those selected by the convergence method.
6 Results: the Pic Association
As a test case for the convergence method described in the previous section, we look for the known BPA. As a starting point, only young stars with trigonometric parallaxes are taken into account. Their UVW velocities show a concentration at U=-10 km s-1, V=-16 km s-1, W=-9 km s-1 which is very close to the space motions found for the BPA defined by Zuckerman & Song (2004).
A few proposed BPA members in Zuckerman & Song (2004) not a priori in the SACY sample (mainly A-F stars excluded predominantly due to the temperature criterion) were also included in our present analysis in order to test the consistence of the association as a whole, i.e., early- and late-type members. In addition, membership of a few ad-hoc stars not in Zuckerman & Song (2004) or in the SACY sample were also tested, for example, the case of the isolated cTTS V4046 Sgr. For all faint members of visual binaries, even wide, with no Hipparcos or Tycho-2 data we used the proper motions and/or parallaxes of the primary star.
In the convergence method we do not use the Hipparcos parallaxes when the errors are larger than 2 mas, as this may indicate unreliable parallaxes. Anyway, these stars coud be used to check the resulting kinematical parallax.
6.1 Observational isochrone

According to Zuckerman et al. (2001a), the BPA is 12 Myr old, and Feigelson et al. (2006) estimate the age of the BPA member GJ 3305 to be 13 Myr. This is consistent with the 11 Myr obtained by the dynamical tracing back models (Ortega et al., 2002, 2004).
The color-magnitude diagram with the isochrone of 10 Myr of Siess et al. (2000) is shown in Figure 6. In contrast to low mass stars which agree with the position of the isochrone, stars earlier than about G5 are up to 2 magnitudes off from the theoretical predictions. This discrepancy was already noticed by Zuckerman et al. (2001a) who overcame the problem by adopting observational isochrones based on stellar populations with well defined ages. If on one hand isochrones are an important element to the convergence method applied here, entering in the estimation of the evolutionary distance (see equation 5.1), on the other hand, the temperature region where the differences between theory and observations seems more severe, is mainly beyond the temperature cut-off applied to the SACY sample.
In spite of that, in order to be able to use the convergence method in future works covering a broader temperature range, we adopted a similar strategy as Zuckerman et al. (2001a) and use the BPA members of Table 6 to define an ad-hoc isochrone of around 15Myr. Our best fit gives (shown as a thick dot-dashed line in Figure 6):
| (3) |
for
Eq. 3 is then the isochrone used in the convergence method. At a first glimpse, the way this observational isochrone was defined seems to lead to a circular argument, namely, the use Eq. 3 into the convergence method to find the members which are going in turn to be used to refine Eq. 3. It is worth noticing that the objects used to set the early-type side of the observational isochrone all have determined parallaxes and are anchored in the UVW space and on the color-magnitude diagram. The intrinsic assumption is that these early-type objects are indeed members of BPA. According to our membership probabilities given in Table 6, all but one A and F stars taken from Zuckerman & Song (2004) have a membership probabilities higher than 85% and are considered to be bona-fide members which validates our approach to define the observational isochrone.
6.2 Evidence for expansion

  
|
  
|
A plot of the velocity component U of the space velocity vector against the space direction X is seen in Figure 7. The farthest components show a larger U-component velocity suggesting that the association is actually expanding. A quick check of whether this effect is an artifact of our convergence method can be carried out looking for the objects whose parallaxes were taken from Hipparcos and not derived by the convergence method. These objects are overplotted with squares in Figure 7. It is clear that the correlation does exist, even if the members are restricted to 50 pc as is the case of the Zuckerman & Song (2004) analysis. A linear least-squares fit gives:
| (4) |
Such a correlation seems to be a common trend observed among the young stars (i.e., ) of the SACY sample in contrast to the older sample where no correlation is seen. In addition, no significant correlation seems to exist either between Y and V or W and Z, regardless of the age of the objects. Interpretation of what caused the trend seen in Figure 7 and its possible links to star formation and early dynamic interaction is postponed for a future paper.
6.3 The Pic Association membership probabilities
We estimated the membership probabilities of all possible members to the BPA as discussed in Sec. 5.2. We assume the training set as derived by the kinematical convergence method, given in Table 6.
For the BPA analysis we assume . All members of the training set have probabilities in the range of 0.7-1.0, i.e. they are already well confined and clustered in the UVWXYZ–space. Thus,bona-fide members in this list have membership probability of, at least, 0.75. These probabilities are displayed in the last column in Table 6.
We do find four stars above this probability threshold which are not given in Table 6. Three of them have magnitude differences with respect to the observational isochrone (Eq. 3) larger than 1.4 mag and therefore were discarded. The other is Hip 88726, having (X, U) values (42.3pc, -13.0 km s-1), not compatible with the observed trend seen in Fig. 7 (or Eq. 4). We rejected it as a BPA member in spite of a membership probability of 90% and an acceptable magnitude. Song et al. (2003) also considered it as an outlier.
The final list of high probability proposed members is the same as that obtained by the convergence method.
6.4 The SACY Pic Association
The final results for the BPA are summarized in Table 6, where the magnitudes and colors are corrected by the presence of companions as explained in Section 2.2.
Table 6 contains 41 highly probable members, that could be used to define the main properties of the BPA and 2 possible members.
Zuckerman & Song (2004) proposed a list of 33 members333Actually their list has 34 entries, but 2 entries are for both members of the SB2 V824 Ara. to the BPA including stars hotter than the SACY limit of and in both hemispheres. Only one very faint star proposed as member by Zuckerman & Song was not used in our analysis as it lacks the kinematical data needed to be injected in the convergence method.
| Name | Vsini | V-IC | SpT | ELi | F | Prob | notes | ||||||||||||||
| 2000 | 2000 | mas yr-1 | km s-1 | mÅ | mas | mas | km s-1 | pc | |||||||||||||
| Hip 10679 | 02 17 24.7 | +28 44 31 | 86.7 | -76.7 | 5.00.4 | 8 | 7.75 | 0.69 | G2V | 160 | 29.4 | 25.5 | -12.3 | -16.2 | -8.6 | -27.6 | 19.5 | -19.8 | 1.03 | 1.00 | Z,s,N,H,3 |
| HD 14082 | 02 17 25.2 | +28 44 43 | 84.3 | -77.6 | 4.60.3 | 45 | 6.99 | 0.59 | F5V | 140 | 25.42.8 | 25.3 | -11.7 | -16.4 | -8.8 | -27.9 | 19.7 | -20.1 | 1.05 | 1.00 | Z,N,H,3 |
| BD+30 397B | 02 27 28.1 | +30 58 41 | 79.5 | -70.1 | 4.71.3 | 12.44 | 2.33 | M2Ve | 110 | 23.3 | -12.5 | -16.4 | -7.9 | -31.6 | 21.2 | -19.8 | 1.39 | 1.00 | Z,s,3,5,6 | ||
| AG Tri | 02 27 29.3 | +30 58 25 | 79.5 | -70.1 | 7.01.1 | 5 | 10.12 | 1.34 | K6Ve | 220 | 23.72.0 | 23.3 | -14.2 | -15.3 | -8.9 | -31.6 | 21.2 | -19.8 | 1.81 | 1.00 | Z,s,H,3,4 |
| BD+05 378 | 02 41 25.8 | +05 59 19 | 82.3 | -55.1 | 10.0 SB1 | 10.37 | 1.59 | K6Ve | 450 | 24.72.4 | 25.5 | -11.9 | -15.9 | -6.6 | -25.7 | 6.5 | -28.9 | 2.62 | 0.85 | Z,S,3,7 | |
| HD 29391 | 04 37 36.1 | -02 28 25 | 43.3 | -64.2 | 21.0 | 95 | 5.22 | 0.34 | F0V | 0 | 33.60.9 | -14.0 | -16.2 | -10.1 | -24.3 | -8.2 | -15.2 | 1.95 | 0.90 | Z,2,1 | |
| GJ 3305 | 04 37 37.5 | -02 29 28 | 46.1 | -64.8 | 20.1 | 10.59 | 1.98 | M1Ve | 120 | 33.60.9 | -13.2 | -16.0 | -9.6 | -24.3 | -8.2 | -15.2 | 1.01 | 0.90 | Z,9,10,11 | ||
| V1005 Ori | 04 59 34.8 | +01 47 02 | 37.2 | -93.9 | 18.7 | 14 | 10.05 | 1.84 | M0Ve | 270 | 37.52.6 | 41.5 | -12.2 | -15.8 | -9.2 | -21.0 | -6.7 | -9.7 | 0.53 | 0.90 | S,H,10,13 |
| CD-57 1054 | 05 00 47.1 | -57 15 26 | 35.6 | 72.8 | 19.40.3 | 5.4 | 10.00 | 1.79 | M0Ve | 360 | 38.11.1 | -10.8 | -16.7 | -9.2 | -1.5 | -20.8 | -15.9 | 0.91 | 0.90 | Z,S | |
| Hip 23418 | 05 01 58.8 | +09 59 00 | 17.2 | -82.0 | 17.3 SB2 | 11.95* | 2.46 | M3Ve | 0 | 31.28.6 | 29.1 | -12.2 | -15.2 | -10.3 | -32.0 | -5.9 | -11.1 | 1.77 | 0.90 | Z,s,3,22,8 | |
| HD 35850 | 05 27 04.7 | -11 54 03 | 17.2 | -49.3 | 22.8 SB2 | 50 | 6.56* | 0.58 | F7V | 191 | 37.30.8 | -13.2 | -17.1 | -9.9 | -20.2 | -13.8 | -10.9 | 1.97 | 0.90 | Z,N,H,14 | |
| Pic | 05 47 17.1 | -51 04 00 | 4.7 | 82.0 | 20.20.4 | 139 | 3.77 | 0.16 | A3V | 0 | 51.90.5 | -10.9 | -16.2 | -9.2 | -3.3 | -16.2 | -9.8 | 0.55 | 0.90 | Z,1 | |
| AO Men | 06 18 28.2 | -72 02 42 | -8.1 | 71.4 | 16.3 | 16.4 | 9.80 | 1.32 | K4Ve | 420 | 25.90.9 | -9.8 | -16.3 | -8.8 | 7.5 | -33.2 | -18.3 | 1.45 | 0.90 | Z,S,21 | |
| HD139084B | 15 38 56.8 | -57 42 19 | -52.9 | -106.0 | 0.12.0 | 14.80 | 2.90 | M5Ve | 460 | 25.21.1 | -11.9 | -15.9 | -10.1 | 32.0 | -23.4 | -1.3 | 2.71 | 0.85 | Z,S,3 | ||
| V343 Nor | 15 38 57.6 | -57 42 26 | -52.9 | -106.0 | 4.21.4 | 16.6 | 7.97 | 0.90 | K0V | 292 | 25.21.1 | -8.6 | -18.3 | -10.2 | 32.0 | -23.4 | -1.3 | 2.85 | 0.80 | Z,S | |
| V824 Ara | 17 17 25.5 | -66 57 02 | -21.8 | -136.5 | 5.9 SB2 | 31 | 7.23* | 0.84 | G7IV | 250 | 31.80.7 | -8.1 | -17.5 | -9.3 | 24.7 | -17.4 | -8.8 | 2.43 | 0.85 | Z,S,15,19 | |
| HD155555C | 17 17 31.3 | -66 57 06 | -21.8 | -136.5 | 2.7 | 6 | 12.82 | 2.73 | M3Ve | 20: | 31.80.7 | -10.6 | -15.8 | -8.4 | 24.7 | -17.4 | -8.8 | 1.11 | 0.90 | Z,S,20 | |
| CD-54 7336 | 17 29 55.1 | -54 15 49 | -7.0 | -63.1 | 1.61.4 | 35.3 | 9.55 | 0.95 | K1V | 360 | 15.1 | -7.1 | -16.5 | -8.7 | 59.7 | -25.5 | -12.5 | 1.14 | 0.85 | S | |
| HD 161460 | 17 48 33.8 | -53 06 43 | -3.9 | -56.4 | 1.4 SB2 | 13.6 | 9.32* | 0.86 | K0IV | 320 | 13.6 | -6.8 | -16.6 | -8.3 | 67.1 | -25.4 | -16.2 | 1.34 | 0.80 | S | |
| HD 164249 | 18 03 03.4 | -51 38 56 | 3.5 | -86.5 | 0.50.4 | 20 | 7.01 | 0.53 | F6V | 107 | 21.30.9 | -7.0 | -15.5 | -9.1 | 43.2 | -14.4 | -11.4 | 1.95 | 0.95 | Z,H,1 | |
| HD 164249B | 18 03 04.1 | -51 38 56 | 3.5 | -86.5 | -2.41.3 | 12.5: | M2Ve | 70 | 21.30.9 | -9.7 | -14.6 | -8.4 | 43.2 | -14.4 | -11.4 | 1.90 | 0.95 | ||||
| V4046 Sgr | 18 14 10.5 | -32 47 33 | 2.1 | -54.5 | -6.9 SB2 | 13.8 | 10.94* | 1.33 | K6Ve | 440 | 13.8 | -8.1 | -16.2 | -8.4 | 72.0 | -0.4 | -9.1 | 1.13 | 0.90 | 16 | |
| G7396-0759 | 18 14 22.1 | -32 46 10 | 2.1 | -54.5 | -5.7 SB? | 3.0 | 12.78 | 2.14 | M1Ve | 200 | 13.8 | -6.9 | -16.2 | -8.6 | 72.0 | -0.4 | -9.2 | 0.99 | 0.85 | ||
| HD 168210 | 18 19 52.2 | -29 16 32 | 2.8 | -47.2 | -7.02.6 | 102.7 | 8.89 | 0.78 | G5V | 290 | 13.31.4 | -7.1 | -14.9 | -7.8 | 74.5 | 4.4 | -8.8 | 1.78 | 0.85 | S | |
| HD 172555 | 18 45 26.9 | -64 52 15 | 32.7 | -148.7 | 3.8 | 116 | 4.78 | 0.20 | A6IV | 0 | 34.20.7 | -9.5 | -16.4 | -10.0 | 23.3 | -13.2 | -11.8 | 1.08 | 0.85 | Z,H,17 | |
| CD-64 1208 | 18 45 36.9 | -64 51 48 | 32.7 | -148.7 | 1.03.0 | 100: | 9.54 | 1.54 | K5Ve | 490 | 34.20.7 | -11.8 | -15.2 | -8.8 | 23.3 | -13.1 | -11.8 | 2.04 | 0.95 | Z,1 | |
| T9073-0762 | 18 46 52.6 | -62 10 36 | 18.1 | -76.6 | 2.40.1 | 9.9 | 12.08 | 2.09 | M1Ve | 332 | 18.6 | -9.3 | -15.2 | -9.5 | 44.2 | -22.1 | -21.2 | 1.01 | 0.90 | S | |
| T7408-0054 | 18 50 44.5 | -31 47 47 | 10.6 | -77.8 | -6.01.0 | 49.7 | 11.20 | 1.76 | K7Ve | 492 | 19.8 | -7.0 | -16.6 | -8.1 | 49.0 | 3.4 | -12.0 | 1.95 | 0.90 | S | |
| PZ Tel | 18 53 05.9 | -50 10 49 | 16.6 | -83.5 | -3.40.7 | 69.0 | 8.29 | 0.85 | G9IV | 287 | 20.11.2 | -10.6 | -15.4 | -7.9 | 45.2 | -11.1 | -17.6 | 2.34 | 0.95 | Z,S | |
| T6872-1011 | 18 58 04.2 | -29 53 05 | 16.1 | -47.2 | -4.91.0 | 33.8 | 11.78 | 1.80 | M0Ve | 483 | 12.8 | -6.3 | -14.5 | -10.8 | 75.4 | 8.5 | -19.6 | 2.68 | 0.75 | S | |
| CD-26 13904 | 19 11 44.6 | -26 04 09 | 18.9 | -44.2 | -8.10.3 | 9.8 | 10.27* | 1.18 | K4V | 320 | 12.6 | -8.7 | -14.6 | -10.4 | 75.1 | 15.0 | -21.6 | 2.50 | 0.85 | S | |
| Tel | 19 22 51.2 | -54 25 25 | 25.6 | -83.0 | 0 D4.1” | 330: | 5.02 | -0.02 | A0V | 0 | 21.00.7 | -9.0 | -15.4 | -8.2 | 40.8 | -12.6 | -21.0 | 1.17 | 0.95 | Z,3,18 | |
| HD 181327 | 19 22 58.9 | -54 32 16 | 23.8 | -81.8 | -0.7 | 16 | 7.03 | 0.53 | F6V | 120 | 19.80.8 | -9.9 | -16.0 | -7.9 | 43.3 | -13.4 | -22.3 | 1.75 | 0.90 | Z,H,1 | |
| AT MicN | 20 41 51.1 | -32 26 07 | 269.3 | -365.7 | -4.5 | 10.1 | 10.99* | 2.99 | M4Ve | 0 | 97.84.7 | 105.1 | - 9.8 | -15.9 | -9.6 | 7.5 | 1.5 | -5.6 | 1.12 | 0.90 | Z,S |
| AT MicS | 20 41 51.1 | -32 26 10 | 269.3 | -365.7 | -5.2 | 15.8 | 11.09* | 3.03 | M4Ve | 0 | 97.84.7 | 105.1 | -10.3 | -16.0 | -9.2 | 7.5 | 1.5 | -5.6 | 0.56 | 0.90 | Z,S |
| AU Mic | 20 45 09.5 | -31 20 27 | 280.4 | -360.1 | -6.01.7 | 9.3 | 8.73 | 2.09 | M1Ve | 80 | 100.61.4 | -11.3 | -16.7 | -9.6 | 7.8 | 1.7 | -6.0 | 1.15 | 0.90 | Z,S | |
| AZ Cap | 20 56 02.7 | -17 10 54 | 59.3 | -63.0 | -6.9 D2.2” | 15.6 | 10.62* | 1.49 | K6Ve | 420 | 21.6 | -9.3 | -14.8 | -10.1 | 32.7 | 19.1 | -26.6 | 1.65 | 0.90 | Z,S | |
| CP-72 2713 | 22 42 49.0 | -71 42 21 | 94.1 | -54.4 | 8.60.5 | 7.5 | 10.60 | 1.73 | K7Ve | 440 | 27.3 | -9.9 | -16.4 | -8.1 | 19.6 | -18.9 | -24.5 | 1.18 | 0.80 | S | |
| WW PsA | 22 44 57.9 | -33 15 02 | 183.1 | -118.9 | 2.2 | 12.1 | 12.07 | 2.80 | M4Ve | 0 | 42.43.4 | 49.0 | -10.7 | -15.5 | -9.8 | 9.3 | 2.1 | -18.0 | 0.86 | 0.95 | Z,S |
| TX PsA | 22 45 00.0 | -33 15 26 | 183.1 | -118.9 | 2.4 | 16.8 | 13.36 | 3.09 | M5Ve | 450 | 49.0 | -10.7 | -15.4 | -10.0 | 9.3 | 2.1 | -18.0 | 1.18 | 0.90 | Z,S | |
| BD-13 6424 | 23 32 30.9 | -12 15 52 | 138.1 | -83.2 | 1.80.7 | 8.8 | 10.54 | 1.98 | M0Ve | 185 | 35.7 | -10.6 | -15.7 | -10.1 | 4.2 | 10.4 | -25.7 | 1.00 | 0.90 | S | |
| possible members | |||||||||||||||||||||
| HD 203 | 00 06 50.0 | -23 06 27 | 97.3 | -47.1 | 9.72.0 | 155 | 6.19 | 0.46 | F3V | 87 | 25.60.8 | -10.4 | -14.5 | -13.3 | 4.5 | 5.8 | -38.4 | 4.53 | 0.45 | Z,H,1 | |
| HD 199143 | 20 55 47.7 | -17 06 51 | 59.2 | -61.6 | -4.52.1 | 155 | 7.35* | 0.60 | F7V | 150 | 21.01.0 | -7.8 | -13.9 | -11.8 | 33.7 | 19.7 | -27.3 | 3.72 | 0.60 | Z,H,12 | |
Data in italic were taken from the literature; (*) photometric data for SB2 or close visual binaries are corrected taken into account the companions (Hip 23418, CD-26 13904 and HD 199143 have faint visual companions at ) Z = proposed member by Zuckerman & Song (2004); s = within SACY definition, but in the Northern Hemisphere, and not observed by us; S = observed in the SACY program; H = photometry from Hipparcos; N = radial velocity and/or from Nordström et al. (2004); (1) Zuckerman et al. (2001a); (2) Barbier-Brossat & Figon (2000); (3) Song et al. (2003); (4) Cutispoto et al. (2000); (5) Weis (1991b); (6) Ianna (1979); (7) Robertson & Hamilton (1987); (8) Koen et al. (2002) (9) Weis (1991a); (10) Gizis et al. (2002); (11) Feigelson et al. (2006); (12) Christian & Mathioudakis (2002); (13) Favata et al. (1995); (14) Wichmann et al. (2003); (15) Strassmeier & Rice (2000); (16) Quast et al. (2000); (17) Erspamer & North (2003); (18) Gray & Garrison (1987); (19)Cutispoto (1998); (20) (Eggen, 1978); (21) Cutispoto et al. (1999); (22) Delfosse et al. (1999); (19)Cutispoto (1998); (20) (Eggen, 1978).
Four stars of their list are not proposed as probable members:
-
•
Hip 88726 and Hip 79881 - they do not fit into the expansion relation (Hip 79881 has a membership probability of 65%) and they were also rejected by Song et al. (2003).
-
•
HD 203 and HD 199143 - they are high rotational velocity F stars ( = 155 km s-1) and their radial velocities are less reliable. Both stars would be considered as good members with radial velocity values within one sigma of the mean used values or if we have used published radial velocities. We consider them as possible members.
From the 13 new members proposed in this paper only two have Hipparcos parallaxes (HD 168210 and Hip 23200 = V1005 Ori). Another one is the new visual companion of HD 164249, and we use the Hipparcos parallax of the primary.
In Figure 8 we show different projections in UVWXYZ–space. In all panels a well defined clustering in both spatial and kinematical coordinates is seen which gives confidence of the solution obtained by the convergence method. The clustering has an oblate shape along the X and U directions, as discussed in section 6.2.
According to Table 6, the association has a mean (UVW) of ( km s-1, km s-1, km s-1), and a mean (XYZ) of (pc, pc, pc). It spreads over a 100 pc interval in X, 50 pc in Y and 30 pc in Z. The distances of the proposed members of the BPA to the Sun range from 10 pc up to 80 pc. If only stars later than G0 (28 stars) are considered the mean (UVW) would barely change ( km s-1, km s-1 and km s-1). The distances would change less than 1%.
It is evident that the solar position is almost inside the BPA and thus it could have members spread over all the sky, and there may exist members undetected by our survey due to its partial sky coverage. Nevertheless, the distribution of the members in XZ-plane seems to indicate that the BPA is an association mainly in the Southern skies. Even a very high negative X value, if we extrapolate the expansion using the mean Y and Z, would imply in stars near 05H and . To be sure where BPA ends at negative X direction it is essential to extend SACY at this region. The gap near X = -10 in Figure 7 comes from the incomplete sky coverage in this region. Nevertheless, an extreme positive X value would fall within our sample.
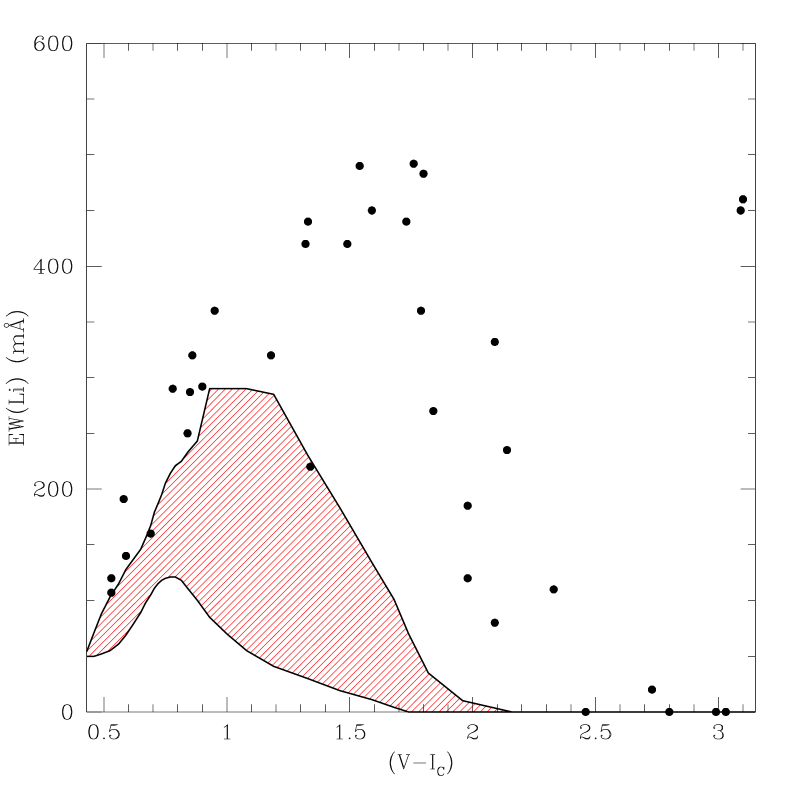
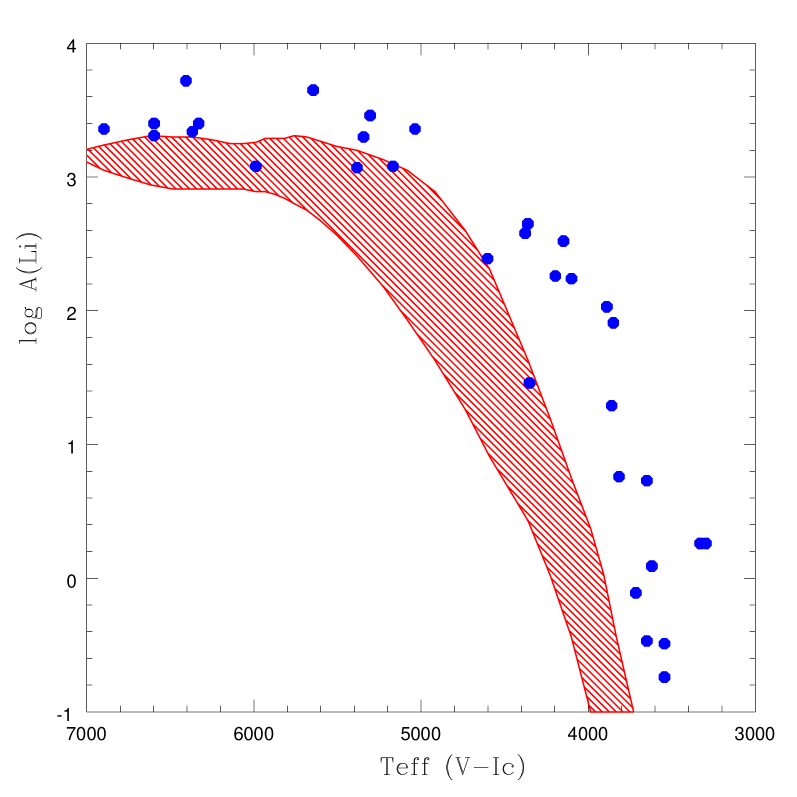
Figure 9 shows the Li equivalent width as a function of color index for all proposed members of Table 6. As seen in Figure 9, they lie above the upper envelope set by the Pleiades members, as expected from the fact that by definition the young sample contains only stars showing a considerable Li. Nevertheless, it is worth noticing that for the G-K dwarfs (where the Li-age correlation is stronger) the observed equivalent widths are much higher than the Pleiades upper envelope indicating a much younger age for these objects relative to the Pleiades. We tested the convergence method including the Pleiades age sample without finding new members.
To obtain the Li abundances, presented in Table 7, we used our modified version of the known LTE code made by Monique Spite, of Paris-Meudon Observatory. These Li abundances were determined by comparing the equivalent widths of the synthetic lines to the measured ones, on the observed spectra. The method is very simple: given an equivalent width for a given line, we calculate its theoretical profile for a given element abundance and its corresponding equivalent width. If the theoretical equivalent width is not good, the process is retrieved for an interpolated abundance value, until the difference between both values be acceptable. Our criterion is that this difference be less than 0.2 mÅ. In the computation of the synthetic profile we take in account the 4 components of the resonance line, being the wavelengths and the oscillators strengths given by (Andersen et al., 1984). The used stellar atmospheric models are from Gustafsson and collaborators (Edvardsson et al., 1993). The effective temperatures used for the atmosphere models were determined from color index using the (Kenyon & Hartmann, 1995) calibration. The other atmosphere model parameters were fixed a priori: the metallicity as (Castilho et al., 2005) and , for stars of luminosity class V, or for luminosity class IV. The microturbulence velocity also was fixed as 2 km s-1. The Li abundance is not very sensitive to gravity and the main source of errors is the inaccuracy of the equivalent widths (specially for fast rotating stars) and the effective temperatures.
| IDENT | Teff | EW | A(Li) |
|---|---|---|---|
| (1) | (2) | (3) | (4) |
| HD 203 | 6897. | 87 | 3.36 |
| Hip 10679 | 5988. | 160 | 3.08 |
| HD 14082 | 6368. | 140 | 3.34 |
| BD+30 397B | 3544. | 110 | -0.49 |
| AG Tri | 4351. | 220 | 1.46 |
| BD+05 378 | 4100. | 450 | 2.24 |
| GJ 3305 | 3715. | 120 | -0.11 |
| V1005 Ori | 3816. | 270 | 0.76 |
| CD-57 1054 | 3860. | 360 | 1.29 |
| HD 35850 | 6406. | 191 | 3.72 |
| AO Men | 4377. | 420 | 2.58 |
| HD 139084B | 3310. | 460 | 0.26 |
| V343 Nor | 5168. | 292 | 3.08 |
| V824 Ara | 5383. | 250 | 3.07 |
| HD 155555C | 3413. | 20 | -1.76 |
| CD-54 7336 | 5036. | 360 | 3.36 |
| HD 161460 | 5304. | 320 | 3.46 |
| HD 164249 | 6597. | 107 | 3.31 |
| HD 164249B | 3544. | 70 | -0.74 |
| V4046 Sgr | 4361. | 440 | 2.65 |
| GSC 7396-0759 | 3619. | 200 | 0.09 |
| HD 168210 | 5645. | 290 | 3.65 |
| CD-64 1208 | 4148. | 490 | 2.52 |
| TYC 9073-0762 | 3649. | 332 | 0.73 |
| TYC 7408-0054 | 3889. | 492 | 2.03 |
| PZ Tel | 5344. | 287 | 3.30 |
| TYC 6872-1011 | 3850. | 483 | 1.91 |
| CD-26 13904 | 4602. | 320 | 2.39 |
| HD 181327 | 6597. | 120 | 3.40 |
| AU Mic | 3649. | 80 | -0.47 |
| HD 199143 | 6330. | 150 | 3.40 |
| AZ Cap | 4197. | 420 | 2.26 |
| CP-72 2713 | 3921. | 440 | 1.84 |
| TX PsA | 3316. | 450 | 0.26 |
| BD-13 6424 | 3715. | 185 | 0.20 |
A further evidence for the youth of the BPA members is given by the projected rotational velocities (). They span over a large range from up to km s-1 as typically observed in young clusters of similar age such as IC 2391 and IC 2602 (Stauffer et al., 1997) and the slightly older Per (Bouvier, 1997). This spread is also in good agreement with the theoretical angular momentum evolution tracks and are the result of different time-scales for disk-unlocking which is probably related to the disk life-time itself (e.g. Allain et al., 1997).
6.5 Comments about some proposed members
AT Mic and AU Mic were already classified as young stars by Eggen (1968) whereas their connection with Pic was first proposed by Barrado y Navascués et al. (1999). Errors in the Hipparcos distances for the AT Mic pair are very high and their proper motions have differences larger than usual between Hipparcos, Tycho-2 and UCAC2. The pair has an orbital solution with a period of 209 yr in the Sixth Catalog of Orbits of Visual Binary Stars (Hartkopf & Mason, htpp://ad.usno.navy.mil/wds/orb6.html), thus catalogs with larger time base may have the proper motions contaminated by the orbital motion. Therefore, we prefer to use the proper motions of Hipparcos, as they better reflect the center of mass motion. Our kinematical distance is close to that of the companion AU Mic. The weak Li line of AU Mic was first suspected by de La Reza et al. (1981) in an attempt to explain the odd Li-rich red dwarf V1005 Ori (Hip 23200; Gl 182) by means of Li production by spallation reactions. They discarded this possibility and proposed that V1005 Ori may be a member of a very young kinematical group. These stars may now have their oddities explained as proposed members of the young BPA.
WW PsA and TX PsA form a low mass wide visual binary, the first one being slightly brighter and hotter. TX PsA has a high Li equivalent width (the point around in Figure 9). In contrast, WW Psa has the Li fully depleted. Song et al. (2002) interpreted the pair in the context of Li depletion boundary and concluded that it can give a strong observational constraint to age determinations using the Li depletion boundary. Our kinematical distances put the pair closer to the Sun than the Hipparcos parallax which has a large uncertainty. If our distance is correct, the stars could be fainter, and this should be considered in the discussion of the Li age determinations. The faint companion of HD 139084 is very similar to TX PsA (the spectral type may be somewhat later) and it can help in this context. The given by Song et al. (2003) seems too blue; from 2Mass, the two stars have similar (V-K), and we use in the paper the TX PsA color for it.
HD 199143 (Hip 103311) and AZ Cap (HD 358623) were recently proposed by Kaisler et al. (2004) as members of the BPA. HD 199143 is a fast rotator and its radial velocity has a large spread. If we had used the value given by van den Ancker et al. (2000), the results yielded by the convergence method would support the BPA membership for both HD 199143 and AZ Cap. Our results challenge the existence of the proposed Capricornius moving group (van den Ancker et al., 2000), which is more likely a sub-sample of the BPA.
Tel is a very fast rotator. The in Table 6 was estimated by Gray & Garrison (1987). Thus its radial velocity is unreliable and we used 0 km s-1 as proposed by Song et al. (2003). This value is very close to the radial velocity of its wide companion HD 181327. It has a proposed brown dwarf companion at 4.1 (Lowrance et al., 2000).
There are 5 double line spectroscopic binaries (SB2) in the BPA:
Hip 23418 was found by Delfosse et al. (1999) to be a SB2 with a period near 12 days and mass ratio of 0.57. In Table 6 we used their systemic velocity. The star is also a very close visual double detected by Hipparcos, the secondary star being one magnitude fainter. In Table 6 we try to give the magnitude and color of the primary for this triple system.
HD 35850 was found by Nordström et al. (2004) to be a SB2, who give a mass ratio of 0.72, the systemic velocity, but no rotational velocity. For we use that determined by Wichmann et al. (2003). The star is considered an outlier by Song et al. (2003) since they did not know about the radial velocity variations. It is also a variable star with a period near one day (Budding et al., 2003; Wright et al., 2004).
HD 155555 (V824 Ara) is actually a multiple system that includes a well studied SB2 (G7+K0IV) (Strassmeier & Rice, 2000) and a fainter optical companion, proposed as member by Zuckerman & Song (2004). We observed also this fainter companion, a M4Ve star with no detectable Li line, and our radial velocity is consistent with the value obtained by Pasquini et al. (1991) (3.5 km s-1). In Table 6 we used for its proper motions and parallax the data of the brighter component.
V4046 Sgr is not in the SACY sample, since it is not in 1RXS, but we included it to test if it could belong to some association as it is an isolated classical TTS. It is also a SB2 with a circumbinary disk (Stempels & Gahm, 2004; Quast et al., 2000). The distance obtained by Quast et al. (2000), pc, evolutionary model dependent, agrees well with our kinematical one of 72 pc. The age found by Stempels & Gahm (2004) also agrees well with the age of the BPA. GSC 7396-0759, a nearby young red star and optical counterpart of the ROSAT source 1RXS J181422.6-324622, could be a distant (2.8′) physical companion of the V4046 Sgr system, based on its radial velocity, Li equivalent width and magnitudes. Using for it the V4046 Sgr Tycho-2 proper motions, the star agrees well with a BPA membership. However, the shape of its CCF suggests it may be a SB2 and, in this case, it could not be a BPA member.
HD 161460 is a SB2 (K0IV + K1IV), observed only twice, one near conjunction and in the other spectrum the lines are not very well resolved, but both Li lines are strong. The radial velocity is reliable and the mass relation is near 0.5, implying a later spectral type for the secondary star.
7 Summary and conclusions
In the present paper we present the SACY, a high-resolution optical spectroscopic survey aiming to look for undiscovered nearby associations among the optical counterparts of the ROSAT X-ray sources in the Southern Hemisphere. From an initial list containing 9574 1RXS sources in the Southern Hemisphere, we find 1953 of them having counterparts with in the Tycho-2 or Hipparcos Catalogues. During the last seven years, 1511 objects were observed at least once. Published information for 115 objects was used to complete our measurements. SACY is complete in the Southern Hemisphere.
The main results of this paper are summarized below.
-
•
Radial velocities and . Accurate radial velocities ( km s-1) have been derived for all observed sample using FEROS and/or coudé observations. Good quality were derived from FEROS observations. Both quantities, radial velocities and , were compared to recent measurements obtained with CORAVEL (Nordström et al., 2004) showing a very good agreement.
-
•
Spectral classification. Spectral type classification was carried out using a combination of three different methods: i) comparison with the Montes et al. (1997) spectral library, ii) calibrations of Tripicchio et al. (1997, 1999) for the Na I D and K I 7699 Å lines and, iii) the method developed by Torres (1999) in the region.
-
•
Young stars. Based on our spectroscopic observations Li equivalent width could be measured for the first time for most of the 1256 dwarfs observed in the survey. Using also the information for 115 stars from the literature and based on the Li criterion we consider, 565, 282 and 524 dwarf stars as respectively younger, having a similar age to or being older than the Pleiades.
Since parallaxes exist only for a small part of the sample, we developed a kinematical convergence method to overcome this problem allowing us to derive dynamic parallaxes. As an example, this method is applied to an initial concentration of young stars at U,V,W=-10,-16,-9 km s-1 which is very close to the proposed mean velocities for BPA by Zuckerman & Song (2004).
-
•
Defining the BPA in (UVW). According to Table 6, the association has a mean (UVW) of ( km s-1, km s-1, km s-1).
-
•
New members of the BPA. Our definition of the BPA is close to that of Zuckerman & Song (2004). Using our convergence method and data from the literature we verify that most of their northern and early-type members fit well into our definition of the BPA. According to our results we propose 13 additional members, including the well known active stars V1005 Ori and V4046 Sgr. This latter is not a ”SACY star” and was formally considered as typical isolated TTS. Our results suggest that V4046 Sgr belongs indeed to the BPA, being one of the oldest cTTS known up to now. We propose a wide companion red dwarf star for it. We find also a faint companion for HD 164249. We propose a list of 41 bona-fide BPA members.
- •
-
•
Indication for expansion. We find a positive correlation between the X-direction and the U-component of the space velocity vector for young stars in the SACY sample. This behavior is most clearly seen in the case of the BPA. Analysis of this expansion and its implications will be discussed in a future paper.
-
•
Membership probability. We have developed a membership assessment procedure based on a predictive classification scheme to be used with the convergence method. Both the value of the and membership probability agree well.
Acknowledgements.
C.A.O.Torres was an ESO Visitor Scientist program and thanks CNPq, Brazilian Agency, for the grant 200256/02.0. L. da Silva thanks also the CNPq for the grant 30137/86-7. We thank the Centre de Données Astronomiques de Strasbourg (CDS) and NASA for the use of their electronic facilities, specially SIMBAD and ADS. This research made use of the Washington Double Star Catalog maintained at the U. S. Naval Observatory.References
- Alcalá et al. (2000) Alcalá, J. M., Covino, E., Torres, G., et al. 2000, A&A, 353, 186
- Allain et al. (1997) Allain, S., Queloz, D., Bouvier, J., Mermilliod, J. C., & Mayor, M. 1997, Memorie della Societa Astronomica Italiana, 68, 899
- Andersen et al. (1984) Andersen, J., Gustafsson, B., & Lambert, D. L. 1984, A&A, 136, 65
- Baranne et al. (1979) Baranne, A., Mayor, M., & Poncet, J. L. 1979, Vistas in Astronomy, 23, 279
- Barbier-Brossat & Figon (2000) Barbier-Brossat, M. & Figon, P. 2000, A&AS, 142, 217
- Barrado y Navascués (1998) Barrado y Navascués, D. 1998, Ap&SS, 263, 235
- Barrado y Navascués et al. (1999) Barrado y Navascués, D., Stauffer, J. R., Song, I., & Caillault, J.-P. 1999, ApJ, 520, L123
- Bouvier (1997) Bouvier, J. 1997, Memorie della Societa Astronomica Italiana, 68, 881
- Budding et al. (2003) Budding, E., Heckert, P., Soydugan, F., et al. 2003, Informational Bulletin on Variable Stars, 5451, 1
- Castilho et al. (2005) Castilho, B. V., Torres, C. A. O., Quast, G., et al. 2005, in IAU Symposium 228, ed. V. Hill, P. François, & F. Primas, 83–84
- Christian & Mathioudakis (2002) Christian, D. J. & Mathioudakis, M. 2002, AJ, 123, 2796
- Cutispoto (1998) Cutispoto, G. 1998, A&AS, 131, 321
- Cutispoto et al. (2000) Cutispoto, G., Pastori, L., Guerrero, A., et al. 2000, A&A, 364, 205
- Cutispoto et al. (1999) Cutispoto, G., Pastori, L., Tagliaferri, G., Messina, S., & Pallavicini, R. 1999, A&AS, 138, 87
- de La Reza et al. (1981) de La Reza, R., Torres, C. A. O., & Busko, I. C. 1981, MNRAS, 194, 829
- de la Reza et al. (1989) de la Reza, R., Torres, C. A. O., Quast, G., Castilho, B. V., & Vieira, G. L. 1989, ApJ, 343, L61
- Delfosse et al. (1999) Delfosse, X., Forveille, T., Beuzit, J.-L., et al. 1999, A&A, 344, 897
- Edvardsson et al. (1993) Edvardsson, B., Andersen, J., Gustafsson, B., et al. 1993, A&A, 275, 101
- Eggen (1968) Eggen, O. J. 1968, ApJS, 16, 49
- Eggen (1978) Eggen, O. J. 1978, Informational Bulletin on Variable Stars, 1426, 1
- Erspamer & North (2003) Erspamer, D. & North, P. 2003, A&A, 398, 1121
- Favata et al. (1995) Favata, F., Barbera, M., Micela, G., & Sciortino, S. 1995, A&A, 295, 147
- Feigelson et al. (2003) Feigelson, E. D., Lawson, W. A., & Garmire, G. P. 2003, ApJ, 599, 1207
- Feigelson et al. (2006) Feigelson, E. D., Lawson, W. A., Stark, M., Townsley, L., & Garmire, G. P. 2006, AJ, 131, 1730
- Gizis et al. (2002) Gizis, J. E., Reid, I. N., & Hawley, S. L. 2002, AJ, 123, 3356
- Gray & Garrison (1987) Gray, R. O. & Garrison, R. F. 1987, ApJS, 65, 581
- Gregorio-Hetem et al. (1992) Gregorio-Hetem, J., Lépine, J. R. D., Quast, G. R., Torres, C. A. O., & de la Reza, R. 1992, AJ, 103, 549
- Guillout et al. (1999) Guillout, P., Schmitt, J. H. M. M., Egret, D., et al. 1999, A&A, 351, 1003
- Guillout et al. (1998) Guillout, P., Sterzik, M. F., Schmitt, J. H. M. M., et al. 1998, A&A, 334, 540
- Herbig (1973) Herbig, G. H. 1973, ApJ, 182, 129
- Herbig (1978) Herbig, G. H. 1978, in Problems of Physics and Evolution of the Universe, Edited by L. V. Mirzoyan. Erevan: Armenian Acad. Sci., 171
- Ianna (1979) Ianna, P. A. 1979, AJ, 84, 127
- Jablonski et al. (1994) Jablonski, F., Baptista, R., Barroso, J., et al. 1994, PASP, 106, 1172
- Kaisler et al. (2004) Kaisler, D., Zuckerman, B., Song, I., et al. 2004, A&A, 414, 175
- Kastner et al. (1997) Kastner, J. H., Zuckerman, B., Weintraub, D. A., & Forveille, T. 1997, Science, 277, 67
- Kaufer et al. (1999) Kaufer, A., Stahl, O., Tubbesing, S., et al. 1999, The Messenger, 95, 8
- Kenyon & Hartmann (1995) Kenyon, S. J. & Hartmann, L. 1995, ApJS, 101, 117
- Koen et al. (2002) Koen, C., Kilkenny, D., van Wyk, F., Cooper, D., & Marang, F. 2002, MNRAS, 334, 20
- Lowrance et al. (2000) Lowrance, P. J., Schneider, G., Kirkpatrick, J. D., et al. 2000, ApJ, 541, 390
- Lyo et al. (2004) Lyo, A.-R., Lawson, W. A., & Bessell, M. S. 2004, MNRAS, 355, 363
- Mamajek et al. (1999) Mamajek, E. E., Lawson, W. A., & Feigelson, E. D. 1999, ApJ, 516, L77
- Mamajek et al. (2000) Mamajek, E. E., Lawson, W. A., & Feigelson, E. D. 2000, ApJ, 544, 356
- Martin (1997) Martin, E. L. 1997, A&A, 321, 492
- Martin et al. (1994) Martin, E. L., Rebolo, R., Magazzu, A., & Pavlenko, Y. V. 1994, A&A, 282, 503
- Melo (2003) Melo, C. H. F. 2003, A&A, 410, 269
- Melo et al. (2001) Melo, C. H. F., Pasquini, L., & De Medeiros, J. R. 2001, A&A, 375, 851
- Montes et al. (1997) Montes, D., Martin, E. L., Fernandez-Figueroa, M. J., Cornide, M., & de Castro, E. 1997, A&AS, 123, 473
- Murtagh & Heck (1987) Murtagh, F. & Heck, A. 1987, Multivariate data analysis (Astrophysics and Space Science Library, Dordrecht: Reidel, 1987)
- Neuhäuser (1997) Neuhäuser, R. 1997, Science, 276, 1363
- Nordström et al. (2004) Nordström, B., Mayor, M., Andersen, J., et al. 2004, VizieR Online Data Catalog, 5117, 0
- Ortega et al. (2002) Ortega, V. G., de la Reza, R., Jilinski, E., & Bazzanella, B. 2002, ApJ, 575, L75
- Ortega et al. (2004) Ortega, V. G., de la Reza, R., Jilinski, E., & Bazzanella, B. 2004, ApJ, 609, 243
- Pasquini et al. (1991) Pasquini, L., Cutispoto, G., Gratton, R., & Mayor, M. 1991, A&A, 248, 72
- Quast et al. (2000) Quast, G. R., Torres, C. A. O., de la Reza, R., da Silva, L., & Mayor, M. 2000, in Birth and Evolution of Binary stars, ed. B. Reipurth, & H. Zinneker, Poster Proc., IAU Symp. 200, 28
- Quast et al. (1987) Quast, G. R., Torres, C. A. P. C. O., de la Reza, R., & Mello, G. F. P. 1987, Revista Mexicana de Astronomia y Astrofisica, 14, 360
- Queloz et al. (2000) Queloz, D., Mayor, M., Naef, D., et al. 2000, in From Extrasolar Planets to Cosmology: The VLT Opening Symposium, Edited by Jacqueline Bergeron and Alvio Renzini. Berlin: Springer-Verlag, 548
- Robertson & Hamilton (1987) Robertson, T. H. & Hamilton, J. E. 1987, AJ, 93, 959
- Rucinski & Krautter (1983) Rucinski, S. M. & Krautter, J. 1983, Revista Mexicana de Astronomia y Astrofisica, 7, 200
- Siess et al. (2000) Siess, L., Dufour, E., & Forestini, M. 2000, A&A, 358, 593
- Song et al. (2002) Song, I., Bessell, M. S., & Zuckerman, B. 2002, ApJ, 581, L43
- Song et al. (2003) Song, I., Zuckerman, B., & Bessell, M. S. 2003, ApJ, 599, 342
- Stauffer et al. (1997) Stauffer, J. R., Hartmann, L. W., Prosser, C. F., et al. 1997, ApJ, 479, 776
- Stempels & Gahm (2004) Stempels, H. C. & Gahm, G. F. 2004, A&A, 421, 1159
- Sterzik et al. (1999) Sterzik, M. F., Alcalá, J. M., Covino, E., & Petr, M. G. 1999, A&A, 346, L41
- Sterzik et al. (1995) Sterzik, M. F., Alcala, J. M., Neuhaeuser, R., & Schmitt, J. H. M. M. 1995, A&A, 297, 418
- Strassmeier & Rice (2000) Strassmeier, K. G. & Rice, J. B. 2000, A&A, 360, 1019
- Torres (1999) Torres, C. A. O. 1999, Publicação Especial do Observatório Nacional, 10, 1
- Torres et al. (2000) Torres, C. A. O., da Silva, L., Quast, G. R., de la Reza, R., & Jilinski, E. 2000, AJ, 120, 1410
- Torres et al. (2003) Torres, C. A. O., Quast, G., de la Reza, R., et al. 2003, in Open Issues in Local Star Formation, Eds. Jacques Lépine & Jane Gregorio-Hetem, Vol. 299, Kluwer Academic Publishers, 83–90
- Torres et al. (1995) Torres, C. A. O., Quast, G., de la Reza, R., Gregorio-Hetem, J., & Lépine, J. R. D. 1995, AJ, 109, 2146
- Tripicchio et al. (1999) Tripicchio, A., Gomez, M. T., Severino, G., et al. 1999, A&A, 345, 915
- Tripicchio et al. (1997) Tripicchio, A., Severino, G., Covino, E., Terranegra, L., & Garcia Lopez, R. J. 1997, A&A, 327, 681
- Truemper (1982) Truemper, J. 1982, Advances in Space Research, 2, 241
- van den Ancker et al. (2000) van den Ancker, M. E., Pérez, M. R., de Winter, D., & McCollum, B. 2000, A&A, 363, L25
- Voges et al. (1999) Voges, W., Aschenbach, B., Boller, T., et al. 1999, A&A, 349, 389
- Walter (1986) Walter, F. M. 1986, ApJ, 306, 573
- Webb et al. (1999) Webb, R. A., Zuckerman, B., Platais, I., et al. 1999, ApJ, 512, L63
- Weis (1991a) Weis, E. W. 1991a, AJ, 102, 1795
- Weis (1991b) Weis, E. W. 1991b, AJ, 101, 1882
- Wichmann et al. (2003) Wichmann, R., Schmitt, J. H. M. M., & Hubrig, S. 2003, A&A, 399, 983
- Wright et al. (2004) Wright, J. T., Marcy, G. W., Butler, R. P., & Vogt, S. S. 2004, ApJS, 152, 261
- Zuckerman & Song (2004) Zuckerman, B. & Song, I. 2004, ARA&A, 42, 685
- Zuckerman et al. (2004) Zuckerman, B., Song, I., & Bessell, M. S. 2004, ApJ, 613, L65
- Zuckerman et al. (2001a) Zuckerman, B., Song, I., Bessell, M. S., & Webb, R. A. 2001a, ApJ, 562, L87
- Zuckerman et al. (2001b) Zuckerman, B., Song, I., & Webb, R. A. 2001b, ApJ, 559, 388