Gas-phase CO2 emission toward Cepheus A East:
the result of shock activity?11affiliation: Based on observations with the Spitzer Space Telescope.
Abstract
We report the first detection of gas-phase CO2 emission in the star-forming region Cepheus A East, obtained by spectral line mapping of the bending mode at 14.98 m with the Infrared Spectrograph (IRS) instrument onboard the Spitzer Space Telescope. The gaseous CO2 emission covers a region about 35′′ 25′′ in extent, and results from radiative pumping by 15 m continuum photons emanating predominantly from the HW2 protostellar region. The gaseous CO2 exhibits a temperature distribution ranging from 50 K to 200 K. A correlation between the gas-phase CO2 distribution and that of H2 S(2), a tracer of shock activity, indicates that the CO2 molecules originate in a cool post-shock gas component associated with the outflow powered by HW2. The presence of CO2 ice absorption features at 15.20 m toward this region and the lack of correlation between the IR continuum emission and the CO2 gas emission distribution further suggest that the gaseous CO2 molecules are mainly sputtered off grain mantles – by the passage of slow non-dissociative shocks with velocities of 15-30 km s-1 – rather than sublimated through grain heating.
1 Introduction
Cepheus A is a well-known site of star formation that has been studied extensively. Previous results have shown that it contains a series of heavily embedded far-infrared and radio-continuum sources, one of which dominates the luminosity of the entire region (HW2 with 2.5104 ; Hughes & Wouterloot 1984; Evans et al. 1981). Ground- (e.g. Goetz et al. 1998) and space-based observations (e.g. Hartigan et al. 1996; Wright et al. 1996; van den Ancker et al. 2000) revealed that the multipolar outflow existing in this region consists of complex structures of shock-excited atomic and molecular gas. H2 emissions and line emissions from ionized species were detected along high-velocity (HV) and extra-high-velocity (EHV) outflows, indicating the presence of both dissociative (J-type) and non-dissociative (C-type) shocks, likely resulting from successive episodes of activity (Narayanan & Walker 1996). The protostellar object HW2 was determined to be the dominant powering source of the EHV outflow, while the source of the HV jet is still under debate (Goetz et al. 1998; Hiriart et al. 2004). The cavities carved into the surrounding molecular gas by the quadrupolar outflow are clearly seen in the NH3 maps obtained by Torrelles et al. (1993).
In this Letter, we focus on new observations of Cepheus A East obtained with the Infrared Spectrograph (IRS) onboard the Spitzer Space Telescope (SST). The benefit of the SST data lies in the much greater sensitivity and the significantly better spatial resolution offered by the IRS compared to the Infrared Space Observatory (ISO). Such advances allow for the detection and spectral mapping of variations in the molecular and atomic line intensities on scales of a few arcsec instead of the previous few tens of arcsec or few arcmin scales, thus enabling our understanding of shock physics and chemistry at much finer scales. Detections of H2 S(1) through S(7), C2H2, [Ne II], [Ne III], [S I], [S III] and [Fe II] emissions as well as absorption from CO2 and H2O ices will be discussed in a future paper. The present work will focus on the first detection of gas-phase CO2 emission toward Cepheus A East. Section 2 describes the observations and data analysis. Sections 3 & 4 discuss our new results as well as the spatial distributions of gas-phase CO2 and H2 S(2) in the context of shock chemistry and outflow activity.
2 Observations and data reduction
Spectral maps of two overlapping 1′ 1′-square fields were obtained toward Cepheus A East with the IRS instrument onboard the Spitzer Space Telescope (SST) as part of Guaranteed Time Observer (GTO) program 113. The Short-Low (SL, both orders), Short-High (SH) and Long-High (LH) modules allowed for wavelength coverage from 5.2 to 25 m. Most of the data longward of 25 m suffer severe detector saturation as a result of very strong continuum emission and were not used. Continuous spatial coverage in the overlapping fields was obtained by stepping the slit perpendicular and parrallel to its long axis in steps of one-half its width and 4/5 its length, respectively.
The data were processed at the Spitzer Science Center (SSC) using version 12 of the IRS pipeline. The Spectroscopy Modeling Analysis and Reduction Tool (SMART) software (Higdon et al. 2004) was used to extract wavelength-calibrated spectra at each spatial position in the maps. We used a set of locally-developed IDL routines specifically designed to remove bad pixels in the high resolution modules, to calibrate the fluxes for extended sources, and to generate spectral line maps from the extracted spectra (Neufeld et al. 2006).
3 Results
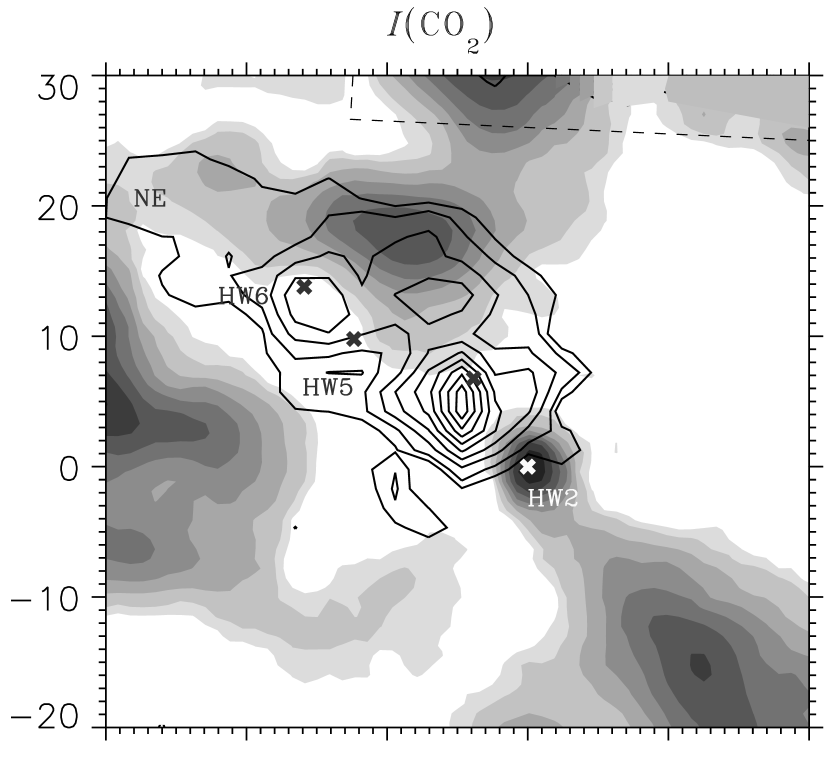
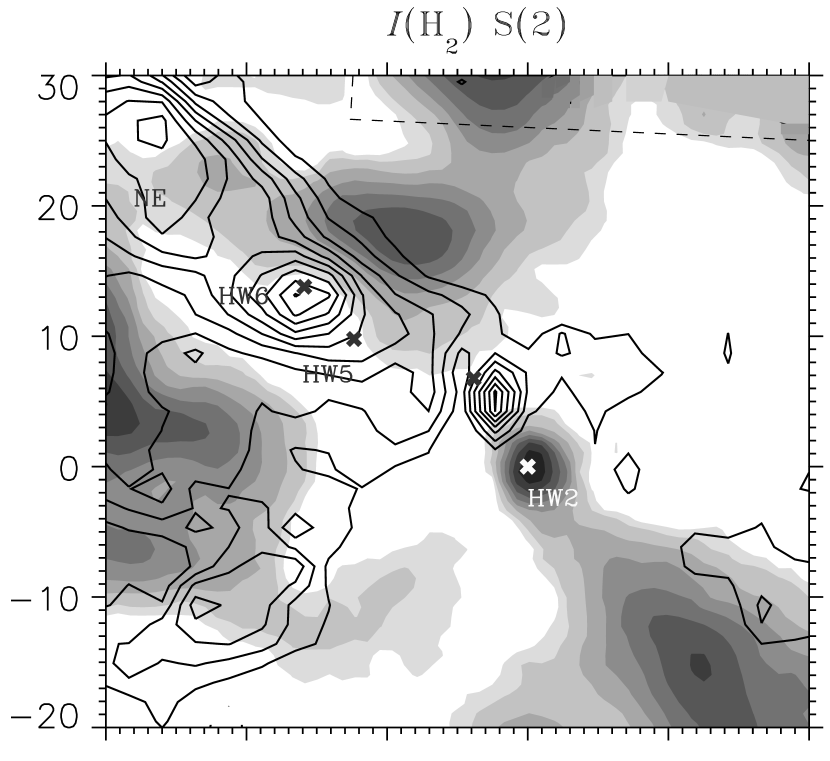
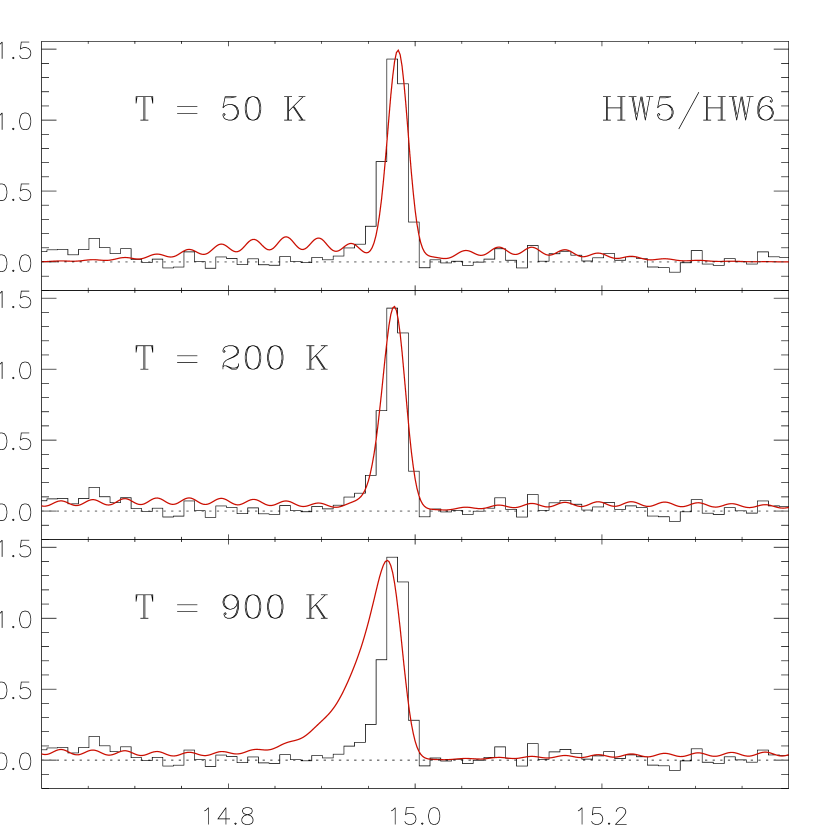
Figure 1 shows two examples of spectral line intensity maps we obtained using the SH data alone to allow direct comparison of the H2 S(2) and gaseous CO2 spatial distributions. The right panel displays the spatial distribution of the H2 S(2) intensity (12.28 m), while the left panel shows the intensity distribution for gas-phase CO2 (-branch of the bending mode at 14.98 m). The H2 and the CO2 emissions mainly arise at the surfaces of the NH3-free cavities carved by the outflows. These emissions thus seem to result from interactions between the EHV outflow and the quiescent molecular gas traced by NH3 (Gómez et al. 1999). Figure 2 (left panel) displays examples of summed spectra in the wavelength range relevant for this study.
To constrain the physical conditions in the CO2-containing gas, we generated synthetic profiles of the CO2 band for temperatures ranging from 50 K to 900 K and compared them with the observed spectra (Fig. 2, right panel). We find that temperatures between 50 and 200 K best fit the observed CO2 -branch emission (14.98 m) over the entire CO2-emitting region. Our observations, therefore, reveal the presence of a post-shock gas component much cooler than that measured with H2 pure rotational line transitions (e.g. van den Ancker et al. 2000, 730 K from H2 S(1)–S(5) over the ISO Short Wavelength Spectrometer beam sizes 14′′20′′ and 14′′27′′).
To determine the column density associated with the gas-phase CO2 emission, one needs to identify the excitation mechanism. Prior studies (e.g., González-Alfonso & Cernicharo 1999; Boonman et al. 2003) showed that gaseous CO2 molecules can be excited: 1) by collisions with H and H2; 2) by radiative pumping into the 4.27 m band; 3) by radiative pumping due to 15 m continuum photons emitted by dust local either to the CO2 gas component or to HW2.
For collisions to dominate, densities in excess of 108 cm-3 would be required. However, prior observations indicate densities from few103 to few107 cm-3 in the outflow region (Codella et al. 2005). Radiative pumping into the 4.27 m band and subsequent cascade can be disregarded because the relaxation to the 15 m band would produce detectable emission at 13.9 m and 16.2 m that we do not observe. Resonant scattering by 15 m continuum photons is, therefore, the most likely mechanism to excite the observed gaseous CO2 molecules. Continuum maps obtained from our data also indicate that the radiation field is dominated by dust emission close to HW2 – from a reflection nebula (Casement & McLean 1996; Goetz et al. 1998, Martín-Pintado et al. 2005)– rather than by dust emission local to the CO2 gas component. We, hence, conclude that the gas-phase CO2 molecules detected toward Cepheus A East are predominantly excited via radiative pumping by 15 m continuum photons emanating from the protostellar region HW2. Resonant scattering in the CO and H2O vibrational bands, through continuum photons emanating from IRc2/BN, was also found toward the shock region Orion Peak 1/2 (González-Alfonso et al. 2002).
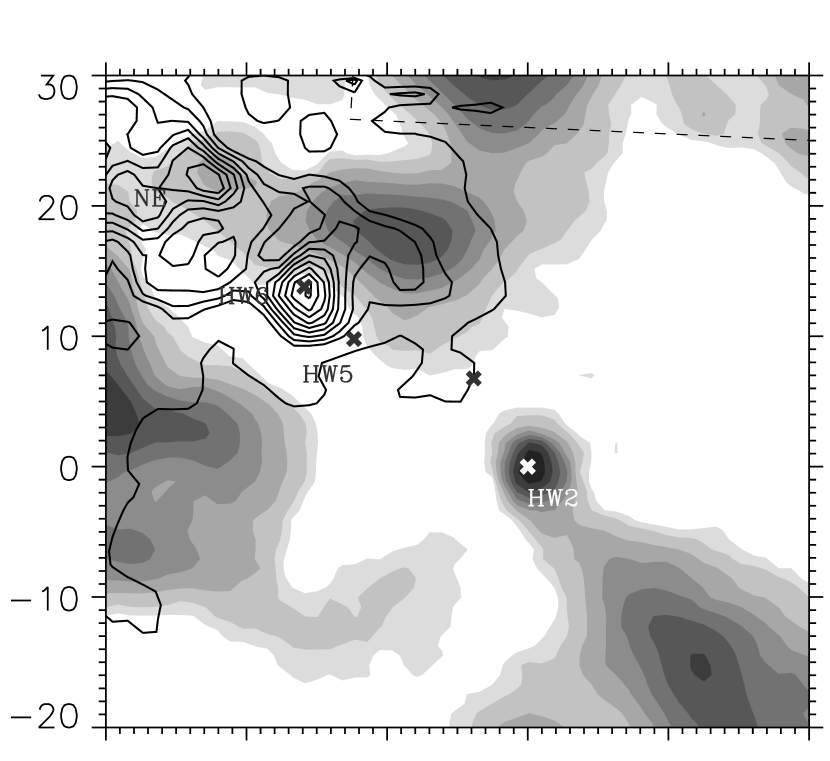
To compute (CO2), we adopted the total luminosity and source effective temperature from Lenzen et al. (1984), as well as a distance of 690 pc for the Cepheus A East region, and we assumed that the projected distance of each spatial position is equal to its true distance from HW2. Under that assumption, the inferred CO2 column density is proportional to the measured intensity and to the square of the angular separation from the exciting source HW2. We also corrected the CO2 intensity measurements for extinction caused by the CO2 ice absorption. A comparison of the (CO2) map (Fig. 3, left panel) with the intensity distribution of the H2 S(2) line ((H2) S(2), Fig. 1, right panel) indicates that – like H2 S(2) – CO2 peaks at the NE position, coincident with the NH3 bridge between Cep-A2 and Cep-A3 (Torrelles et al. 1993) and at the HW5/HW6 positions. These striking similarities again strongly suggest that the CO2 emission arises in post-shock gas, traced by the warm H2 emission, and results from interactions between the EHV outflow and the ambient medium. The right panel of Fig. 3 displays the derived, extinction corrected, column density measurements of gas-phase CO2 H2 S(2) for spatial positions where the CO2 line intensity (-branch) is greater than 0.7510-4 erg s-1 cm-2 sr-1. Our estimate of the Spearman coefficient ( 0.42 and significance level 1%) indicates that the column densities of the two species tend to increase together with spatial position.
4 Discussion
The presence of CO2 ice absorption features at most spatial positions in the gaseous CO2-emitting region, their progressive weakening along the EHV outflow axis, as well as the localization of the gaseous CO2 emission into a cool post-shock component, all pose the question of the origin of the gas-phase CO2 molecules in Cepheus A East. Was CO2 injected into the gas-phase by sublimation from CO2-rich dust mantles after substantial grain heating or by grain sputtering caused by the passage of slow non-dissociative shocks known to exist in this active region?
We searched for evidence of a correlation between the dust continuum emission, a tracer of grain heating, and the gaseous CO2 distribution in the CO2-emitting region by comparing the CO2 column density measurements with measurements of the dust continuum emission at 7.3 m, 14.8 m and 18.0 m. We found no obvious relation between (CO2) and the dust continuum emission at these wavelengths. Furthermore, we determined that the dust temperature is never greater than the CO2 sublimation temperature ( 90 K) at the locations of the CO2 column peaks. While grain heating likely occurs in the active region close to HW2, CO2-rich grain mantle sublimation is not the dominant source of gaseous CO2 in Cepheus A East. Sputtering off CO2-rich ice mantles is, therefore, the most likely scenario in the present case. Our measurements of the CO2 ice column density range from 1017 to few 1018 cm-2 over the region exhibiting CO2 gas emission, indicating that only a few percent of the material has passed through mantle-destroying shocks.
To derive the abundance of gaseous CO2, an estimate of (H2) in the CO2 gas component is needed. Because the gas-phase CO2 molecules arise from a post-shock component much cooler than that containing the H2 gas we detected, we cannot directly measure the total column density of the gas at 50-200 K from our data. Our abundance estimate will, hence, rely on previous indirect measures. Gómez et al. (1999) derived (H2) 1.5 1022 cm-2 in the outflow using HCO+ emission measurements; a similar estimate was obtained by van den Ancker (2000) using far-infrared CO emission at the ISO/Long Wavelength Spectrometer angular resolution (75′′ beam size). Adopting this H2 column density yields an average gas-phase CO2 abundance of few 10-7.
This value should be regarded as a lower limit since the (CO2) might be underestimated if the true distance from HW2 is greater than the projected distance we assumed. A small fraction of the gaseous CO2 might arise from CO2 ice sublimation since some CO2 ice profiles, especially close to HW2, show substructures characteristic of grain heating (Gerakines et al. 1999). A fraction of the gas-phase CO2 emission might also come from quiescent gas associated with Cep-A2 (knot at [R.A., Dec]= [7′′,18′′] in Fig. 1). While these additional sources of gaseous CO2 certainly contribute to the scatter seen in the right panel of Fig. 3, none of these sources can account for the correlation we observe between (CO2) and (H2) S(2) over such a large spatial extent.
The low gas-phase CO2 abundances detected by ISO (10-7 instead of the expected few10-6) toward active star-forming regions with large CO2 ices reservoirs (e.g. van Dishoeck et al. 1996) fostered theoretical efforts to investigate the effects that shocks might have on CO2 chemistry. Charnley & Kaufman (2000) showed that for shocks faster than a critical shock speed, which is a function of preshock gas density, CO2 molecules sputtered off grain mantles are expected to be efficiently destroyed in the shock through reactions with H and H2. On the other hand, a shock speed higher than 15 km s-1 is necessary to allow efficient sputtering.
Comparison of our results with the Charnley & Kaufman (2000) shock-model predictions indicates that slow C-type shocks with speeds of at least 15 km s-1 interacted with the ambient gas over the extent of the CO2-emitting region (see Fig 1). Adopting a pre-shock density of 105 cm-3 (Goetz et al. 1998), our abundance limit further indicates that the shock speed is no greater than 30 km s-1 since, at this density, higher shock speeds would efficiently remove CO2 from the gas phase, mainly through reactions with hydrogen atoms (see Fig. 3 of Charnley & Kaufman 2000). The CO2 emission might arise at the flanks of the bow shock modeled by Froebrich et al. (2002). The average gas phase CO2 abundance derived above (few 10-7) is consistent with a scenario in which a few percent of the grain material has been subject to shocks fast enough to sputter CO2 ice mantles (with CO2(ice)/H2 few 10-5).
References
- Boonman et al. (2003) Boonman, A. M. S., van Dishoeck, E. F., Lahuis, F, Doty, S. D., Wright, C. M., & Rosenthal, D. 2003, A&A, 399, 1047
- Casement & McLean (1996) Casement, L. S., & McLean, I. S. 1996, ApJ, 462, 797
- Codella et al. (2005) Codella, C., Bachiller, R., Benedettini, M., Caselli, P., Viti, S., & Wakelam, V. 2005, MNRAS, 361, 244
- Charnley & Kaufman (2000) Charnley, S. B., & Kaufman, M. J. 2000, ApJ, 529, 111
- Evans et al. (1981) Evans, N. J., II, et al. 1981, ApJ, 244, 115
- Froebrich et al. (2002) Froebrich, D., Smith, M. D., & Eislöffel, J. 2002, A&A, 385, 239
- Gerakines et al. (1999) Gerakines, P. A., et al. 1999, ApJ, 522, 357
- Goetz et al. (1998) Goetz, J. A., et al. 1998, ApJ, 504, 359
- Gómez et al. (1999) Gómez, J. F., Sargent, A. I., Torrelles, J. M., Ho, P. T. P., Rodríguez, L. F., Cantó, J. & Garay, G. 1999, ApJ, 514, 287
- González-Alfonso & Cernicharo (1999) González-Alfonso, E., & Cernicharo, J. 1999, ESA SP-427: The Universe as Seen by ISO, 325
- González-Alfonso et al. (2002) González-Alfonso, E., Wright, C. M., Cernicharo, J., Rosenthal, D., Boonman, A. M. S., & van Dishoeck, E. F. 2002, A&A, 386, 1074
- Hartigan et al. (1996) Hartigan, P., Carpenter, J. M., Dougados, C., & Strutskie, M. F. 1996, AJ, 111, 1278
- Higdon et al. (2004) Higdon, S. J. U., et al. 2004, PASP, 116, 975
- Hiriart et al. (2004) Hiriart, D., Salas, L. & Cruz-González, I. 2004, AJ, 128, 2917
- Hughes & Wouterloot (1984) Hughes, V. A., & Wouterloot, J. G. A. 1984, ApJ, 276, 204
- Lenzen et al. (1984) Lenzen, R., Hodapp, K.-W., & Solf, J. 1984, A&A, 137, 202
- Martin-Pintado et al. (2005) Martín-Pintado, J., Jímenez-Serra, I., Rodríguez-Franco, A., Martín, S., & Thum, C. 2005, ApJ, 628, 61
- Narayanan & Walker (1996) Narayanan, G., & Walker, C. F. 1996, ApJ, 466, 844
- Neufeld et al. (2006) Neufeld, D. A., et al. 2006, ArXiv Astrophysics e-prints, arXiv:astro-ph/0606232
- Torrelles et al. (1993) Torrelles, J. M., Verdes-Montenegro, L., Ho, T. P., Rodríguez, L. F., & Cantó, J. 1993, ApJ, 410, 202
- van den Ancker et al. (2000) van den Ancker, M. E., Tielens, A. A. G. M., & Wesselius, P. R. 2000, A&A, 358, 1035
- van Dishoeck et al. (1996) van Dishoeck, E. F., Helmich, F. P., de Graauw, Th. et al. 1996, A&A, 315, L349
- Wright et al. (1996) Wright, C. M., Drapatz, S., Timmermann, R., van der Werf, P. P., Katterloher, R., & de Graauw, T. 1996, A&A, 315, L301