Shock processing of interstellar dust and polycyclic aromatic hydrocarbons in the supernova remnant N132D
Abstract
We observed the oxygen-rich Large Magellanic Cloud (LMC) supernova remnant N132D (SNR 0525–69.6), using all instruments onboard the Spitzer Space Telescope, IRS, IRAC, and MIPS (Infrared Spectrograph, Infrared Array Camera, Multiband Imaging Photometer for Spitzer). The 5–40 IRS spectra toward the southeastern shell of the remnant show a steeply rising continuum with [Ne III] and [O IV] as well as PAH emission. We also present the spectrum of a fast moving ejecta knot, previously detected at optical wavelengths, which is dominated by strong [Ne III] and [O IV] emission lines. We interpret the continuum as thermal emission from swept-up, shock-heated dust grains in the expanding shell of N132D, which is clearly visible in the MIPS 24 image. A 15–20 emission hump appears superposed on the dust continuum, and we attribute this to PAH C-C-C bending modes. We also detect the well-known 11.3 PAH C-H bending feature, and find the integrated strength of the 15–20 hump about a factor of seven stronger than the 11.3 band in the shell of the remnant. IRAC 3–9 images do not show clear evidence of large-scale, shell-like emission from the remnant, partly due to confusion with the ambient ISM material. However, we identified several knots of shocked interstellar gas based on their distinct infrared colors. We discuss the bright infrared continuum and the polycyclic aromatic hydrocarbon features with respect to dust processing in young supernova remnants.
I. Introduction
Supernovae influence the chemistry and physics in the interstellar medium (ISM) from galactic scales down to the atomic level. Primarily, it is the energy input of supernova explosions that drives important processes in the ISM: strong shock waves accelerate, heat, and compress interstellar gas, destroy dust grains, accelerate cosmic rays, and affect interstellar chemistry (cf. Draine & McKee, 1993).
The role that supernovae play in the formation, destruction, and processing of polycyclic aromatic hydrocarbons (PAHs) is largely unexplored. PAHs are believed to be the carrier of the unidentified infrared (UIR) bands, well-studied emission features near 3.3, 6.2, 7.7, 8.6, and 11.3 attributed to the C-C and C-H stretching and bending modes of these molecules (Allamandola et al., 1989; Puget & Léger, 1989). It is established that interstellar grains are readily destroyed by strong shock waves (e.g. Tielens et al., 1994), and it was suggested that grain destruction through shocks may be a source of PAH molecules (Jones et al., 1996). Although PAH features have been observed in a wide variety of sources (cf. Van Diedenhoven et al., 2004), no PAH emission has yet been detected in SNRs as far as we are aware, however, Reach et al. (2006) identified four SNRs whose infrared colors suggest emission from PAHs.
More recently, spectral features at 15–20 including broad plateaus and distinct, narrower features, most notably near 16.4 and 17.4, were detected in conjunction with the well-known PAH features (Moutou et al., 2000; Van Kerckhoven et al., 2000; Armus et al., 2004; Morris et al., 2004; Smith et al., 2004; Werner et al., 2004, and see Peeters et al., 2004 for a summary). The 15–20 features are generally attributed to C-C-C bending modes of large PAH molecules (cf. Allamandola et al., 1989; Van Kerckhoven et al., 2000; Peeters et al., 2004). The relatively narrow observed widths of the discrete 16.4 and 17.4 bands suggest that they arise from individual PAH molecules in the gas phase (Peeters et al., 2004). There is also evidence that the appearance, relative strengths, and profiles of the PAH features are coupled to the local physical conditions (Hony et al., 2001; Peeters et al., 2002; Van Diedenhoven et al., 2004; Werner et al., 2004).
In this paper, we report the detection of weak PAH features near 6.2 and 7.7–8.6, at 11.3, and a prominent, broad hump at 15–20 from the young supernova remnant N132D (SNR 052569.6) in the Large Magellanic Cloud (LMC). The age of N132D determined from the ejecta kinematics is 2500 yr (Morse et al., 1995), and its spatial extent is about 100″, or 25 pc assuming a LMC distance of 50 kpc. N132D belongs to the small class of young, oxygen-rich SNRs that are presumably the product of core-collapse supernovae, with the most famous Galactic example being Cas A. For the progenitor of N132D, Blair et al. (2000) suggested a W/O star of 30–35 based on relative elemental abundances and comparisons to stellar nucleosynthesis models, which may have exploded as a Type Ib supernova. N132D shows a radio spectral index of (Dickel & Milne, 1995), consistent with its overall shell-like morphology. It is one of the brightest X-ray sources in the LMC (Hughes, 1987; Hwang et al., 1993; Favata et al., 1997; Hughes et al., 1998), and has also been investigated in great detail in the UV/optical (Blair et al., 1994; Morse et al., 1995; Sutherland & Dopita, 1995; Morse et al., 1996; Blair et al., 2000). The large-scale morphology of the gas in N132D shows three types of line-emitting regions in the optical (Morse et al., 1996): (1) red- and blueshifted oxygen-rich ejecta filaments in the center, with a total velocity range 4400 (Morse et al., 1995), (2) shocked interstellar clouds within the remnant perimeter and in the outer rim, and (3) a photoionized precursor around the outer edge of the remnant.
We observed N132D in the infrared with the Spitzer Space Telescope (Werner et al., 2004). In Section II, we describe our observations and the data reduction procedure. We took particular care of the background subtraction in order to avoid confusion with foreground and background emission (Section II.2). We present our results from the imaging and the spectroscopy in Section III, and give a detailed discussion of the IR emission features and a comparison to PAH features observed in other astronomical objects in Section IV.
II. Observations and data analysis
We observed N132D with all instruments onboard the Spitzer Space Telescope: IRS (Infrared Spectrograph, Houck et al., 2004) 2004 December 13, IRAC (Infrared Array Camera, Fazio et al., 2004) 2004 November 28, and MIPS (Multiband Imaging Photometer for Spitzer, Rieke et al., 2004) 2004 November 7 (Spitzer aorkeys 11019776, 11018496, and 11022336, respectively). We used the IRS in its low resolution setting, yielding a wavelength coverage of 5.2–8.7/7.4–14.5 with the short-low (SL2/SL1) and 14.0–21.3/19.5–38.0 with the long-low (LL2/LL1) modules. The nominal spectral resolution is –128 as a function of wavelength for each module and order, e.g. at 18. The spatial sampling of the IRS is 5.1/1.8″ per pixel in the LL/SL modules, and the spatial resolution is diffraction limited by the 85 cm primary mirror. The four IRAC bands cover the wavelength ranges 3.2–4.0, 4.0–5.0, 5.0–6.4, and 6.4–9.4, respectively, with a pixel size of 1.2″. The three MIPS detector bands cover 20.8–26.1, 61–80, and 140–174, with respective pixel sizes of 2.6, 5.2, and 17″ in our configuration. The approximate total exposure times are 270 s for each IRAC band, 48, 38, and 25 s for the MIPS bands, 280 s for each IRS SL, and 360 s for each LL module.
II.1. General data reduction procedure
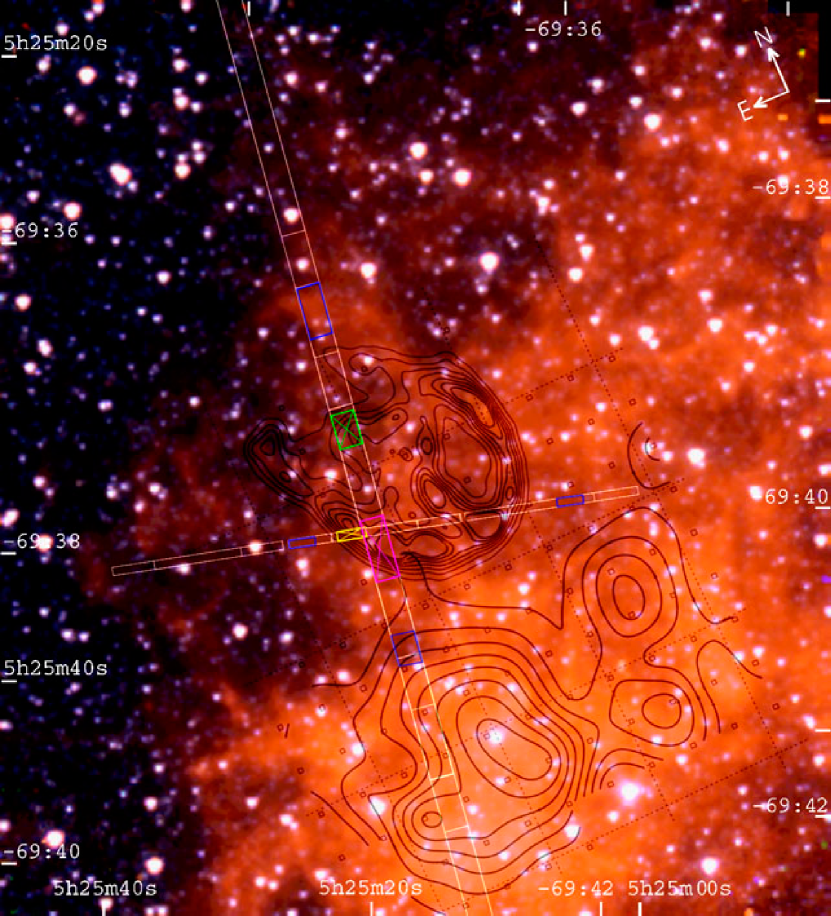
The pipeline processed MIPS and IRAC image mosaics were of good quality, and we used them without further processing. The analysis of the IRS spectra is complicated by the fact that N132D is a non-uniform, extended source superposed with a complex background adjacent to a molecular cloud (see Fig. 1). Moreover, the Spitzer science pipeline is optimized for point sources, and the extraction of extended sources from the default pipeline products results in biased spectra. Our principal data reduction strategy for the IRS spectra consists therefore of the following steps:
(1) starting from the S13.2.0 pipeline products, we interpolated bad pixels flagged by the pipeline, and removed rogue pixels by subtracting nearby sky positions taken from the Spitzer archive for each SL/LL module (see Sect. II.2 for details). Any remaining rogues were removed with the IRSCLEAN111available through the Spitzer Science Center at Caltech, see http://ssc.spitzer.caltech.edu/archanaly/contributed/; IRSCLEAN is developed by Jim Ingalls with contributions from the Cornell IRS instrument team. tool. Rogue pixels are single detector pixels that show time-variable and abnormally high flux values.
(2) we extracted the spectra with SPICE222Spitzer IRS Custom Extraction software available through the Spitzer Science Center at Caltech, see http://ssc.spitzer.caltech.edu/postbcd/spice.html v.1.3beta1 using the default extraction widths, and imported the spectra into SMART333The Spectroscopy Modelling Analysis and Reduction Tool was developed by the IRS Team at Cornell University, and is available through the Spitzer Science Center at Caltech. (Higdon et al., 2004) for postprocessing;
(3) subtraction of a local background spectrum (see Sect. II.2);
(4) basic aperture and slit loss correction assuming a uniform, extended source, to account for the bias introduced by the point source optimized Spitzer science pipeline. We derived a correction function by modelling the Spitzer point-spread-function (PSF) for a range of wavelengths with the software STINYTIM1 developed by John Krist, and then dividing the fraction of the PSF admitted by the slit as defined by the slit-width and wavelength dependent extraction aperture by the sum over the whole PSF. The resulting flux correction functions have wavelength dependent values of 0.8–0.6 for SL and 0.85–0.65 for LL. Further division of the corrected flux density by the extracted area given by the slit-width and the extraction aperture yields spectra in surface brightness units, i.e. flux density per steradian, which can be directly compared to the IRAC and MIPS fluxes. Note that IRAC fluxes are calibrated for point sources, but established point-to-extended source flux correction factors are available (Reach et al., 2005);
(5) we removed fringes that appear in LL1 at 19.5–24.0 with the SMART defringing tool, averaged multiple spectra of the same region, and finally merged SL and LL spectra. Note that we extracted the SL and LL spectra of the southeastern rim from two slightly offset positions, because the small overlap region covered by both slits is positioned just outside the brightest regions in the southeastern rim (cf. Fig. 1). The two extracted regions are separated by about 10″, and the MIPS 24 fluxes in both regions differ by only 10 percent, whereas the IRAC channel 3 and 4 fluxes are comparable.
II.2. Background removal
A meaningful background subtraction of the spectra is one of the most critical and difficult tasks, and of major importance for this work. Commonly, either a spatially close spectral nod or a dedicated off-source position are subtracted to remove the background. Both of these methods are problematic in our case, since we are facing a complex, non-uniform background (cf. Fig. 1).
As a first step, we subtracted archival off-source sky exposures from all spectral modules (cf. Sect. II.1, item 1). The selected sky positions are devoid of continuum and line emission, and were observed close in time and position with respect to our observations ( 3 hrs, 10′). The sky position Spitzer aorkeys are 10964224, 12935424, and 12936960 for SL2, 12936960 for SL1, and 12935424 for LL2/LL1. The sky subtraction removes rogue pixels, zodiacal light emission, and flat-field imperfections, which are particularly noticeable in the SL modules.
In a subsequent step, we subtracted a rogue-cleaned local background spectrum from the extracted source spectra for each spectral module (cf. Sect. II.1, item 3). We selected positions that lie close enough to the source to represent the local background but sufficiently far from the rim to avoid the influence of the radiative precursor that extends noticeably beyond the edge of the remnant (see Sect. III.1). The background positions are depicted as blue boxes in Fig. 1. We averaged two background positions from opposite sides of N132D for SL2 and LL2/LL1, while ensuring that both positions show similar spectra. For SL1, we only have slit coverage east of the remnant, and we adopted the same background position as for SL2. The overall background spectrum extracted from these positions is shown in Fig. 4. We estimate a 30 percent uncertainty in this background spectrum due to spatial variations by using slightly different extraction positions (approximately ″; blue boxes in Fig. 1) and two background positions on opposite sides of the remnant.
II.3. Analysis of emission lines
We measured emission line fluxes, central wavelengths, and full-widths at half-maximum (FWHM) from line fitting with the IRAF ‘spectool’ package444IRAF (Image Reduction and Analysis Facility) and ‘spectool’ are maintained by the IRAF programming group at the National Optical Astronomy Observatory (NOAO) in Tucson, Arizona.. Due to the low resolution of the IRS spectrograph in our setting, at 18, the lines are usually unresolved or marginally resolved, and represent a convolution of the true line profile with the instrumental profile. We used Gaussians to fit the line profiles of atomic lines/ and Lorentzians for discrete PAH features. Our quoted FWHM are not deconvolved from the instrumental IRS profile.
We also extracted spectra from different spatial positions at ″ intervals along the LL spectrograph slit in order to study the spatial variation of line fluxes across the supernova remnant and the molecular cloud to the south (see Sect. III.3, Fig. 9). For this particular task, we employed a slightly different data extraction strategy. In order to improve the spatial resolution, we narrowed the default SPICE extraction aperture by a factor of two, giving extraction widths of about 12″ for LL2 and 20″ for LL1 near the central wavelengths of each module. This procedure systematically reduces measured fluxes by about a factor of two compared to the calibrated default extractions, which is of no concern as long as we compare only relative fluxes of extended emission extracted in that same fashion. We subtracted the continuum by fitting a low-order Legendre polynomial using spectral regions that are free of emission lines, usually below 15 and above 19. For the southeastern rim of N132D, this method gives a similar continuum fit for the LL2 14–21 region than the modified-blackbody fit shown in Fig. 5. We did not apply a local background subtraction here, which means that we compare emission line fluxes including fore- and background for each spatial position along the LL slit.
III. Results
III.1. IRAC and MIPS imaging
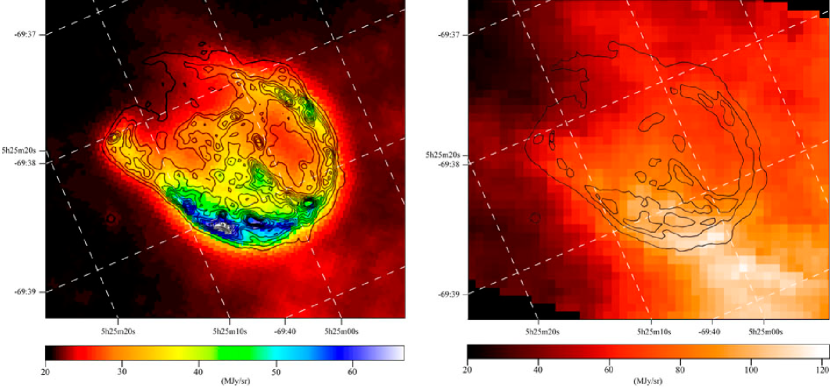
N132D shows strong emission in the MIPS 24 band with a background subtracted peak surface brightness of 50 in the southeastern rim. The total, background subtracted MIPS 24 flux integrated over the whole remnant is Jy. The surface brightness distribution follows the X-ray contours very well (cf. Fig. 2, left panel), although note that the MIPS 24 emission visibly extends beyond the edge of the remnant as defined by the X-ray contours, particularly along the western, southern, and eastern edges. This is a clear sign of the radiative precursor also seen in the optical (Morse et al., 1996), and is most likely continuum emission from heated dust and/or line emission from ionized oxygen caused by hard photons from the remnant; it cannot solely be explained by the wider MIPS point-spread-function (cf. point source in Fig. 2, left panel). The remnant is also marginally detected in the MIPS 70 band with about 60 background subtracted peak surface brightness and a total integrated flux of Jy, but the background confusion is much stronger (Fig. 2, right panel). There is no conclusive detection in the MIPS 160 band, with an upper limit of 5 peak surface brightness.
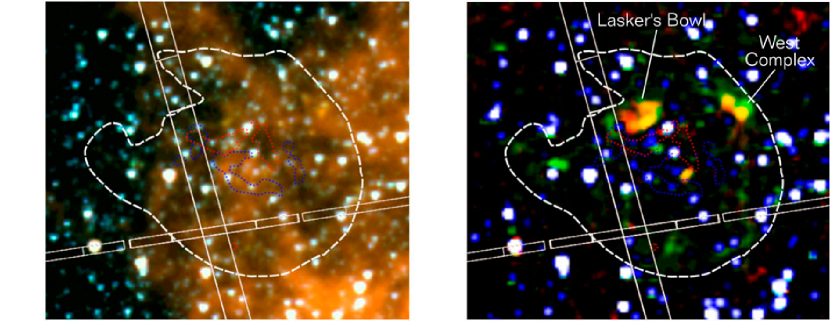
The four IRAC bands do not show clear evidence of emission spatially correlated with the remnant as seen in MIPS nor with the ejecta seen in the optical (cf. Fig. 3, left panel). This is partly due to confusion with the foreground and background ISM material. The IRAC emission within the remnant perimeter is clumpy and shows voids that may have been created by the passing shockwave of N132D. The IRAC color ratios measured at different positions within the remnant are consistent with PAH emission (cf. Reach et al., 2006, Fig. 2). We also detected several small emission knots that show IRAC colors different from the surroundings. In order to remove background stars and confusing PAH emission, we subtracted a scaled IRAC 3.6 image from the 4.5 image, and a scaled IRAC 3.6 and 8.0 image from the 5.6 image (cf. Fig. 3, right panel). We determined the optimal scaling factors empirically to produce a generally flat background. The emission knots have been observed previously in the optical with HST WFPC2 (Morse et al., 1995, 1996), and were identified as clumps of shocked, interstellar/circumstellar material (cf. Sect. IV.1 for a more detailed discussion). Generally, the strongest emission in all four IRAC bands is associated with the molecular cloud/H II-region located south of the remnant (cf. CO contours in Fig. 1).
III.2. IRS spectroscopy
Figure 4 compares the IRS spectrum extracted from the southeastern rim of N132D with the local background spectrum.
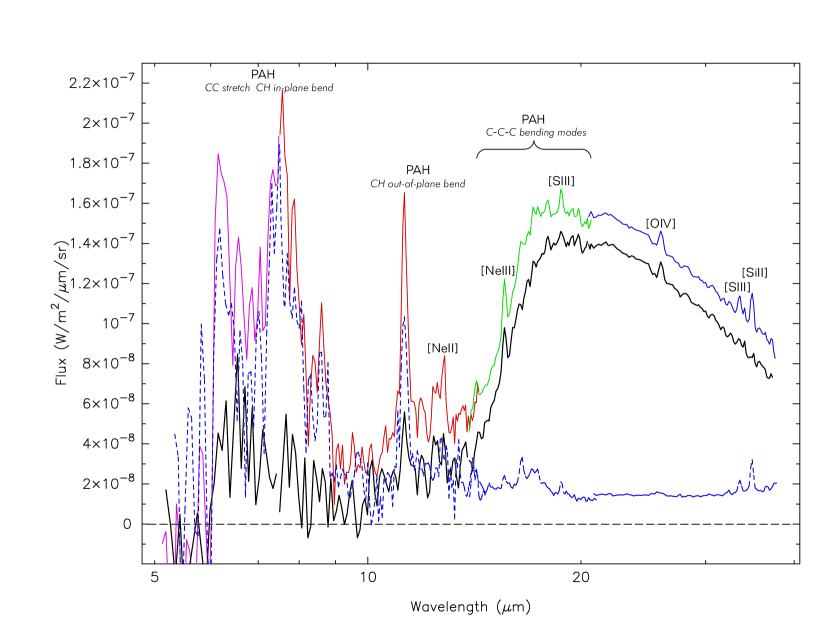
Figure 5 shows the background subtracted IRS spectrum from the southeastern rim of N132D together with a two-component modified-blackbody fit.
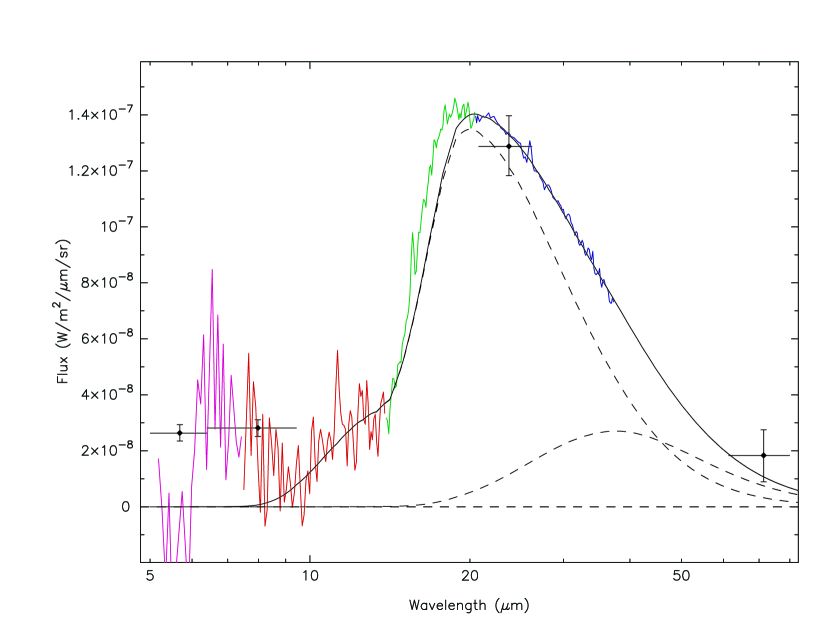
Given the difficult background removal and the slightly offset extractions of SL and LL spectra (cf. Sect. II.2), it is worthwhile to note that the spectra from all modules seamlessly connect, and the fluxes are consistent with background subtracted flux estimates based on the calibrated IRAC and MIPS data.
The modified-blackbody fit to the continuum uses an emissivity for 0.1 silicate/graphite particles with a silicate-to-graphite ratio of 0.2, following the ISM silicon and carbon elemental abundances derived for N132D by Blair et al. (2000) and silicon abundances derived from X-ray data by Hughes et al. (1998) and Favata et al. (1998). The shape of this simple emissivity function is very similar to the emissivity from the general LMC dust model of Weingartner & Draine (2001) in the 5–35 range. Note the shoulder near 10 in the modified-blackbody fit due to the silicate part of the emissivity, which reproduces the continuum flux of our spectrum and therefore provides direct evidence that the heated dust in N132D contains at least some fraction of silicates. Modelling of the UV to near-IR extinction curve for LMC sightlines (Pei, 1992; Maccioni & Perinotto, 1994; Clayton et al., 2003; Cartledge et al., 2005) generally seems to indicate a larger silicate content in dust grains, i.e. favouring larger silicate to graphite abundance ratios. For comparison, we also used the emissivity from the LMC dust model by Weingartner & Draine (2001) and alternative silicate-to-graphite abundance ratios of 1 and 4 for our 0.1 silicate/graphite dust emissivity. The original emissivity data for silicate and graphite particles are taken from Draine & Lee (1984) and Laor & Draine (1993)555Emissivity data files are available from the homepage of Bruce T. Draine, http://www.astro.princeton.edu/draine. We deliberately excluded the PAH component from the emissivity in order to analyze these features later in the continuum subtracted spectrum (Fig. 6). The SMART package uses a modified-blackbody fitting function of the form
| (1) |
where is the normalized emissivity scaled by the factor , and is the Planck function at temperature scaled by the factor , which accounts for the size of the emissive region. With the fitted free parameters , , and , all emissivity functions mentioned above produce nearly equally good fits to the spectral data, and the fitted values for and are similar for all models. For a two-component fit with a silicate-to-graphite ratio of 0.2, we obtain temperatures of K and K, and a ratio .
III.2.1 PAH features from the supernova blast wave
Figure 6 shows the IRS spectrum of the southern rim. The foreground/background and the fitted dust continuum have been subtracted (cf. Sect. II.2 and III.2). The quoted total error consists of the pipeline-delivered statistical ramp uncertainties, combined with an estimate of the error due to the local background variation (cf. Sect. II.2).
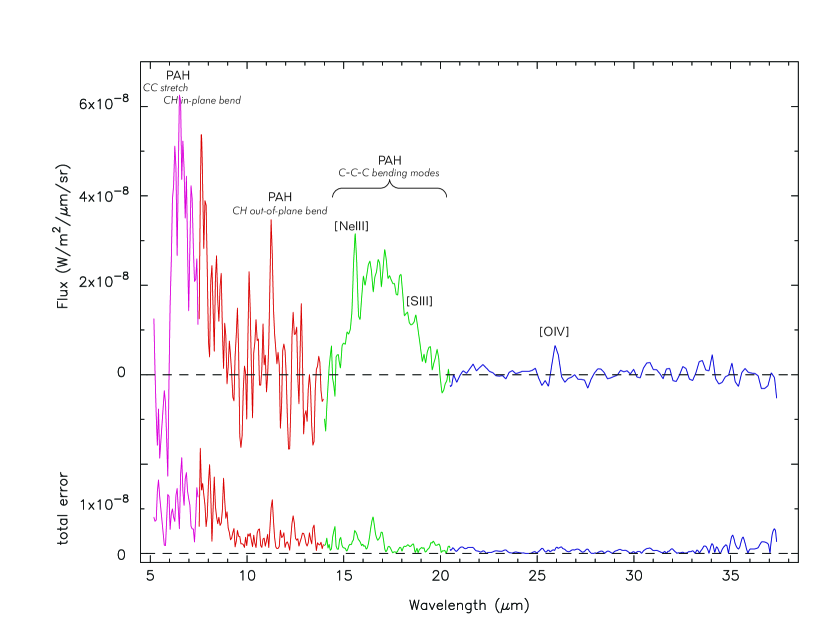
We detect several emission lines from atomic ions, tentative weak PAH features near 6.2 and 7.7–8.6, a weak PAH 11.3 feature, and a prominent, broad hump at 15–20. The ionic emission lines are from Ne2+, O3+, and S2+ ions. We can not distinguish between [O IV] 25.91 and [Fe II] 25.99 in our low-resolution spectra, but argue that most of the emission is from O3+ (cf. Sect. III.3). The PAH features at 6.2, between 7.7 and 8.6, and at 11.3 are the well-studied PAH C-H in-plane and out-of-plane bending modes (e.g. Hony et al., 2001; Peeters et al., 2002; Van Diedenhoven et al., 2004). The presence of discrete 6.2 and 7.7–8.6 bands is uncertain due to the low quality of our spectra in that region (cf. total error in Fig. 6). There is probably an underlying emission plateau at 6–9, which has been observed in other sources and is probably associated with broad continua due to large PAHs, clusters of small PAHs, or very small grains (e.g. Allamandola et al., 1989; Peeters et al., 2002; Rapacioli et al., 2005).
The broad hump at 15–20 is presumably due to PAH C-C-C in- and out-of-plane bending modes (Allamandola et al., 1989; Van Kerckhoven et al., 2000; Peeters et al., 2004). Figure 7 shows the prominent emission hump between 15 and 20 in detail. The spectrum without background subtraction clearly shows the 16.4 PAH feature (cf. Moutou et al., 2000; Van Kerckhoven et al., 2000), and additional features near 17.1 and 17.9. These distinct bands with widths 0.5 may arise from smaller PAHs in the gas phase. However, the individual bands are hardly distinguishable after background subtraction, indicating that these features are primarily due to the background (cf. background spectrum in Fig. 4).
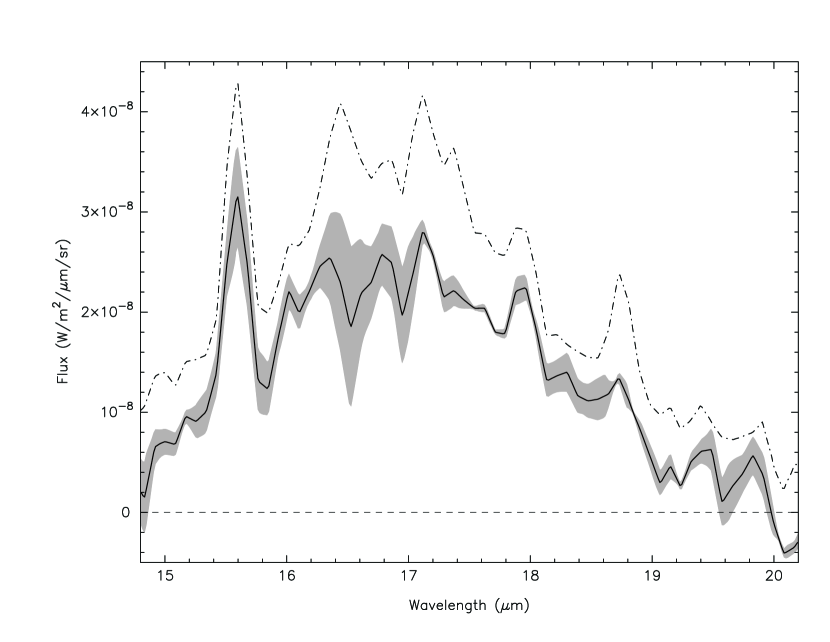
Table 1 lists the fit parameters for all detected ionic lines and PAH features in the rim, the local background, and the molecular cloud/H II-region near N132D. For the local background spectrum, we assumed a flat continuum of .
| ID | Flux | FWHM | ||||
|---|---|---|---|---|---|---|
| [m] | [] | [m] | ||||
| N132D southeastern rim | ||||||
| PAH 6.2 | 1.8 | |||||
| PAH 11.3 | 11.28 | (0.01) | 1.06 | (0.12) | 0.20 | (0.05) |
| [Ne iii] | 15.60 | (0.01) | 0.81 | (0.01) | 0.27 | (0.03) |
| PAH 15–20 | 7.47 | (0.67) | ||||
| [S iii] 2–1 | 18.74 | (0.01) | 0.49 | (0.04) | 0.40 | (0.03) |
| [O iv] | 25.96 | (0.01) | 0.30 | (0.02) | 0.36 | (0.02) |
| N132D local background | ||||||
| PAH 6.2 | 5.8 | |||||
| PAH 11.3 | 11.26 | (0.01) | 4.28 | (0.15) | 0.28 | (0.02) |
| [Ne iii] | 15.58 | (0.01) | 0.30 | (0.02) | 0.23 | (0.01) |
| PAH 15–20 | 3.20 | (0.68) | ||||
| [S iii] 2–1 | 18.74 | (0.01) | 0.24 | (0.02) | 0.30 | (0.03) |
| [S iii] 1–0 | 33.52 | (0.01) | 0.34 | (0.01) | 0.46 | (0.02) |
| [Si ii] | 34.86 | (0.01) | 0.77 | (0.01) | 0.43 | (0.01) |
| Molecular cloud/H II-region near N132D (LL only) | ||||||
| [Ne iii]? | 15.63 | (0.02) | 0.16 | (0.04) | 0.24 | (0.06) |
| PAH? | 15.92 | (0.01) | 0.25 | (0.05) | 0.23 | (0.05) |
| PAH 16.4 | 16.46 | (0.01) | 1.67 | (0.08) | 0.29 | (0.01) |
| PAH? | 16.75 | (0.01) | 0.83 | (0.13) | 0.35 | (0.04) |
| S(1) | 17.06 | (0.01) | 1.02 | (0.01) | 0.27 | (0.01) |
| PAH 17.4 | 17.38 | (0.01) | 1.57 | (0.11) | 0.41 | (0.02) |
| PAH 17.8 | 17.76 | (0.01) | 0.48 | (0.07) | 0.32 | (0.04) |
| PAH? | 18.27 | (0.03) | 0.14 | (0.04) | 0.30 | (0.09) |
| [S iii] 2–1 | 18.77 | (0.01) | 0.68 | (0.01) | 0.26 | (0.01) |
| S(0) | 28.25 | (0.01) | 0.26 | (0.01) | 0.38 | (0.01) |
| [S iii] 1–0 | 33.52 | (0.01) | 0.71 | (0.01) | 0.41 | (0.01) |
| [Si ii] | 34.86 | (0.01) | 0.97 | (0.01) | 0.38 | (0.01) |
The detected PAH features in the southeastern rim of N132D are the first evidence of PAH molecules surviving a supernova blast wave to our knowledge. PAH features also appear in lines-of-sight outside the remnant perimeter, and it is necessary to make certain that the PAH emission originates from the blast wave, and not from foreground, background, or ambient ISM material. There are three points of evidence that the PAH emission is indeed originating from material associated with the blast wave. Firstly, we removed the foreground and background emission by subtracting the flux from lines-of-sight just outside the blast wave perimeter (Sect. II.2). Secondly, we analyzed the spatial variation of emission line fluxes along the LL spectrograph slit (cf. Sect. III.3, Figure 9), which shows that the PAH features between 15 and 20 have a well-defined local flux maximum at the position of the rim. This is expected for material that has been swept up by the blast wave and is not yet completely destroyed by the shock. If the majority of the flux would be from unrelated foreground or background emission, there would be no local maximum at the position of the rim. Some fraction of the detected PAHs may reside in the radiative precursor (cf. Sect. III.1), where they would be excited/processed by energetic photons emanating from the supernova remnant. Finally, the 15–20 PAH emission changes notably when comparing features from the supernova remnant to the adjacent molecular cloud/H II-region and the local background (cf. Fig. 8 and 11), which we interpret as PAH/grain processing in N132D (cf. Sect. IV.3 and IV.3.1).
III.3. Spatial variation of the emission features
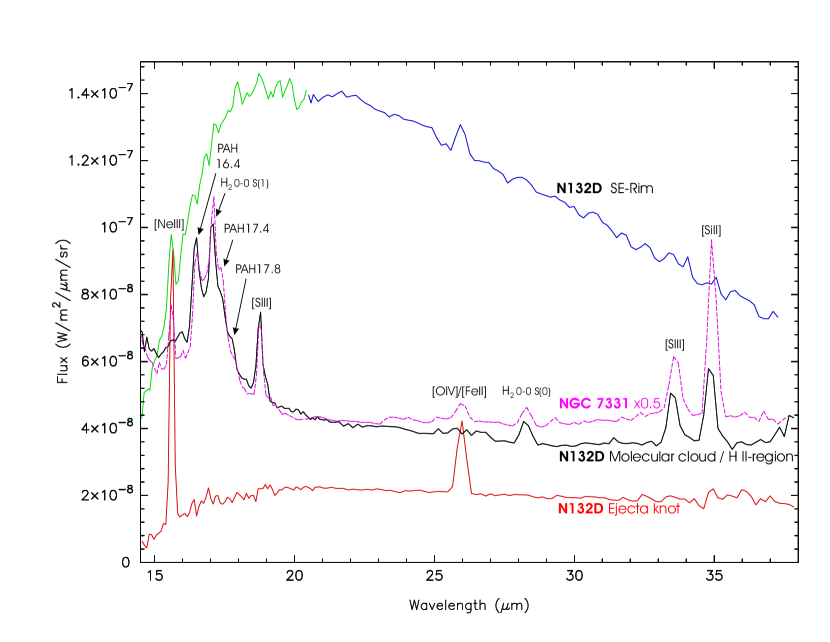
In Figure 8, we show the spectrum of the southeastern rim of N132D in comparison to the ejecta knot detected in the LL spectra, the molecular cloud/H II-region south of N132D, and the average spectrum of the galaxy NGC 7331. The characteristic features of the rim spectrum have been described earlier in this paper. The spectrum of the ejecta knot lacks the steeply rising dust continuum and the 15–20 PAH features, but shows strong ionic emission lines from Ne2+ and O3+, which is consistent with the strong neon and oxygen lines seen in the optical for the same knot (N132D-P3, Blair et al., 2000). The line fluxes and FWHM are (0.15) for the neon and (0.34) for the oxygen line. The spectrum of the molecular cloud/H II-region shows strong PAH bands as well as ionic and lines. The association of the CO emission south of N132D with an H II-region seen in H was noticed by Morse et al. (1995). Banas et al. (1997) estimated the mass of the CO cloud to be about , and argued that its spatial proximity and matching LSR velocity provide strong evidence that this giant cloud is associated with N132D. This provides an opportunity to relate our observations of dust and PAHs in the supernova remnant N132D to the nearby environment its progenitor star probably originated from. Such a comparison will also be useful to interpret spectroscopic observations of star-forming galaxies (e.g. NGC 7331, Smith et al., 2004, see Sect. IV.3.1).
We present a systematic assessment of the PAH 15–20, ionic, and molecular line fluxes from positions across N132D and the nearby molecular cloud in Figure 9. We extracted spectra along the LL slit with separation starting at the northern edge of N132D and ending at the southern edge of the molecular cloud about 3.3′ south of N132D, resulting in a total number of 15 spectra. We converted the spatial distance along the slit into a parsec scale assuming a LMC distance of 50 kpc, and adopted the location of the southeastern rim of N132D as the zero position. Each node in Figure 9 represents a line flux derived from continuum and line fitting, with errors given for the positions covering the supernova remnant (cf. Sect. II.3).
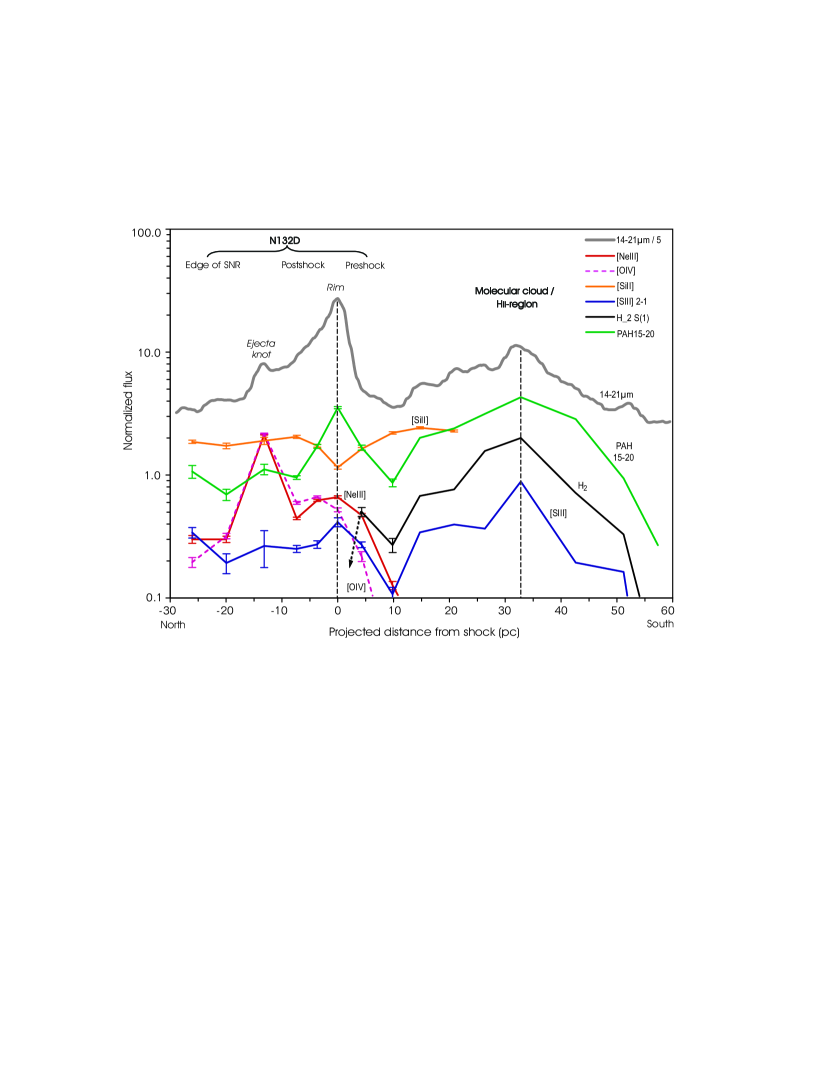
The ionic and molecular lines detected and examined in our spectra are [Ne III] 15.6, [S III] 18.7 and 33.5, [O IV] 25.9, [Si II] 34.8, and 0–0 S(0) 28.2 and S(1) 17.0. The lines from atomic ions, particularly the strong [Ne III] and [S III] transitions, are mostly unblended and straightforward to fit, which makes them excellent references in terms of flux and central wavelengths.
[Ne III] and [O IV] lines only appear across the supernova remnant and in the precursor, and are particulary strong at the position of the ejecta knot. Generally, [Ne III] and [O IV] trace the hot ionized gas of N132D. Note that we can not distinguish between [O IV] 25.91 and [Fe II] 25.99 in our low-resolution spectra, but we argue that most of the flux is likely to be from [O IV] because the flux follows [Ne III] closely (cf. Fig. 9); under the conditions where we observe Ne2+, iron would be mostly present as Fe3+ and Fe4+. There is a weak line near 17.9, which may be [Fe II] 17.9, but possible confusion with the PAH 15–20 features renders this line inconclusive. We do not see [Fe II] 24.5/35.3, [Fe II]/[Fe III] 22.9, and [Fe VI] 19.6, which are probably too weak to be detected in our spectra. However, X-ray emission from Fe16+ and more highly ionized states was detected in the southern rim (Behar et al., 2001).
[S III] is a common line seen in PDRs and H II-regions. Here, it not only appears across the remnant, but also across the molecular cloud tracing the H II-region. The [S III] 1-0 transition at 33.5 follows the same general trend, with the 2-1/1-0 ratio increasing from 0.08 to about 0.2 from the northern edge of the molecular cloud into the remnant.
traces the molecular cloud seen in CO (Fig. 1). We checked for 0-0 S(0) 28.2, S(2) 12.3, and S(3) 9.7, and did not detect these lines across the remnant; weak S(1) 17.0 emission is not detectable because of strong blending with PAH emission. We conclude that is mostly absent across the remnant, where it was probably destroyed by the fast shock and the strong radiation field, but apparently present in the precursor. The S(1)/S(0) ratio increases from about 1.4 at the northern edge of the molecular cloud/H II-region to 11 at the shock precursor of the rim, which implies an increase in the UV radiation field as expected for the presence of a radiative precursor (cf. Sect. III.1).
[Si II] shows a nearly constant flux, except a noticeable minimum at the position of the rim. This is most likely an effect of the increased radiation field and the elevated temperature. Silicon will be much more highly ionized under those conditions, which is confirmed by the detection of X-ray emission from Si12+ in the southern rim by Behar et al. (2001). Unfortunately, this conceals a possibly increased amount of silicon in the gas phase due to the destruction of dust grains.
There are three well-defined PAH components at 16.5, 17.4, and 17.8 in the region of the molecular cloud (Fig. 8 and 11, and Table 1), which have all been previously observed in other sources (see Sect. IV.3.1). The fluxes of these features follow the flux very well as expected if the PAHs are well-mixed with the gas (Fig. 9). The feature at 16.8 is blended with the stronger PAH feature at 16.5 and the strong S(1) line at 17.1, and therefore more uncertain. The situation changes for the supernova remnant, where the discrete 15–20 PAH features all but disappear, and a nearly featureless 15–20 emission hump remains (Fig. 7 and Table 1).
IV. Discussion
IV.1. IRAC emission knots
We detect shocked interstellar clouds with IRAC due to their distinct emission in the IRAC channels (cf. Fig. 3). The IRAC emission knots seen in the northern central part and the northwestern rim of the remnant coincide with previously detected, bright optical [O III] and [S II] emission complexes named “Lasker’s Bowl” and “West Complex”. They were identified as shocked interstellar clouds/circumstellar material based on optical line diagnostics, elemental abundances, and their radial velocities similar to the local ISM surrounding N132D (Morse et al., 1995, 1996; Blair et al., 2000). The small knot visible close to the center of the remnant is probably a smaller analogue of these two complexes. We do not detect the red- and blueshifted, oxygen-rich ejecta of N132D with IRAC (cf. the dotted contours in Fig. 3).
The measured IRAC band ratios for the shocked clouds are roughly consistent with thermal emission from hot silicate/graphite dust grains. In particular, the West Complex shows an IRAC 4.5/8 ratio of 0.18 and a 3.6/5.7 ratio of 0.38. For this region, Blair et al. (2000) presented Hubble FOS spectra that show a broad range of ionization stages as expected from shock heating, e.g. O to O3+ and N to N4+, and elemental abundances consistent with LMC interstellar material. They derive a high electron temperature K, a mean electron density of several thousand per , and a preshock cloud density larger than 100. Their shock models indicate that a shock speed of at least 200 is needed to produce the observed high-ionization species.
Comparing this to shocked dust IR emission models calculated by Dwek et al. (1996), we find that the measured IRAC color ratios are roughly reproduced by models with a preshock density of 100 and a shock speed 400, and models with a preshock density of 10 and a range of shock speeds between 400 and 1000. This suggests that part of the IRAC emission in the West Complex may be due to a population of shock-heated, small dust grains. However, it is likely that the measured IRAC colors represent a mix of dust continuum and ionic emission. The green channel 2 excess emission probably includes H I Br 4.05, since the knots appear in the H image from Morse et al. (1995) and the optical spectrum of the West Complex shows strong hydrogen recombination lines (Blair et al., 2000). The red channel 3 excess emission could also be due to [Fe II] 5.34. If is present in those clouds, the IRAC 4.5 band covers the more highly excited lines, i.e. the (0,0) S(8)-S(11) transitions, whereas the 5.7 and 8 bands cover (0,0) S(4)-S(7).
A different type of IRAC emission is mainly characterized by an excess in channel 2, i.e. it appears as pure green emission in Fig. 3, right panel. The faint green emission aligned along the southwestern rim is spatially coinciding with small clumps of gas seen in the HST WFPC2 images (Morse et al., 1996). Judging solely from the IRAC band fluxes, it is difficult to determine the nature of the IR emission in these clumps. Unfortunately, none of them are covered by our IRS spectra. Many other isolated patches showing channel 2 excess emission do not have a counterpart in the narrow band HST WFPC2 [O III], [S II], nor the H image from Morse et al. (1995). However, the brightest green patches, one near the center of the ejecta, two blended patches near the northeastern edge of the remnant, and one outside the remnant perimeter near the northeastern corner of the image, have optical counterparts visible in archival, broad band HST ACS data (proposal 12001, filters F475W, F550M, F850LP; see the related Hubble Heritage image, STScI-2005-30 news release). All counterparts are structured, extended sources with color variations. The object outside the remnant perimeter is most likely a background galaxy, whereas the nature of the objects within the perimeter of N132D remains unclear.
IV.2. MIPS continuum emission from shock-heated grains
We interpret the steeply rising continuum in the spectrum of the southeastern rim of N132D as thermal emission from dust grains that have been swept up and shock-heated by the supernova blast wave. Most of the MIPS 24 flux is then due to dust continuum flux, since the [O IV] 25.9 line flux is much weaker than the continuum in the wide MIPS 24 bandpass (cf. Fig. 5). The association of the MIPS 24 flux with the blast wave along the remnant perimeter and not with the actual ejecta (cf. Fig. 2 and 3) confirms that the dust is part of the swept-up, ambient interstellar/circumstellar material. This is further supported by the appearance of the brightest MIPS emission along the southeastern rim, where the interstellar gas density is expected to increase due to the presence of a molecular cloud (cf. CO contours in Fig. 1, and Sect. III.3). Generally, the MIPS 24 flux intensity follows the X-ray emission very well. Every peak in the MIPS 24 surface brightness is also an X-ray peak (cf. Fig. 2), which demonstrates the connection between the X-ray emitting plasma and the heated dust grains.
A two-component modified-blackbody fit to the continuum yields temperatures of 110 and 58 K (cf. Sect. III.2). These temperatures can be adopted as average dust temperatures if the grains are in thermal equilibrium, i.e. balanced heating and cooling rates, and if the mean energy per grain heating event is much smaller than the thermal energy content of the grain at the equilibrium temperature (steady vs. stochastic heating, cf. Draine & Li, 2001, and references therein). Under the conditions in the rim of N132D, i.e. an average temperature K and a mean preshock density 3 (cf. Hwang et al., 1993; Morse et al., 1996), gas-grain collisions probably dominate the grain heating (Dwek & Arendt, 1992). If each gas-grain collision transfers an energy of the order of J, i.e. similar to the energy of a 0.6 keV X-ray photon, an individual heating event changes the temperature of a silicate/graphite grain with radius 0.04 by less than 1 K. This estimate assumes spherical, homogenous grains with a density of , and a specific heat capacity of for silicate/graphite grains at K. Small grains 0.04 in size can be heated substantially by a single heating event, and thus do not have a well-defined equilibrium temperature (cf. Li & Draine, 2001). The fact that we observe two different average grain temperatures may indicate two distinct grain size populations and/or emission originating from separate physical regions with different heating conditions (see Sect. IV.3 for a more detailed discussion).
We can estimate the dust mass in those two components using (Whittet, 2003)
| (2) |
and adopting a density for silicate/graphite grains, a distance for N132D, and an average ratio of grain radius over emissivity of . We evaluated the flux density and the Planck function for the fitted dust temperatures at 23.7. Eq. 2 is an approximation assuming spherical dust grains of uniform size, composition, and in thermal equilibrium. We derived the dust masses in the entire southern rim (outlined by the green color in Fig. 2, left panel) by scaling the result from Eq. 2 by the MIPS 24 flux ratio of the southern rim and the IRS slit aperture, which gives and . If we further scale this result to the total MIPS 24 flux of the whole remnant, the total swept-up ISM dust mass in N132D becomes about . These numbers have considerable uncertainty, particularly the low temperature component, because of the assumptions made in Eq. 2 and the measurement uncertainties.
We can compare the derived dust masses with estimates of the swept-up gas mass from X-ray data, which give an approximate upper limit on the total amount of dust. Favata et al. (1997) fitted the BeppoSAX X-ray spectrum of N132D with a two-temperature non-equilibrium ionization model. Using the revised best-fit from Favata et al. (1998), the total mass of the X-ray emitting material is about 380–850, assuming a filling factor between 0.1 and 0.5. Hughes et al. (1998) applied Sedov models to fit ASCA spectra of N132D, and derived a swept-up mass of about 650. Assuming a total swept-up gas mass of 600 for N132D, the amount of swept-up dust is 1.5, if the fraction of dust is 0.25 percent of the gas mass, i.e. about one fourth of the Galactic value. This dust mass represents an approximate upper limit for the case of no dust destruction. Considering the factor-of-ten lower dust mass estimated directly from Eq. 2, we can state that although some portion of the dust in N132D is surviving, as much as 90 percent might have been destroyed by the blast wave shock (cf. Sect. IV.3).
IV.3. Grain processing and destruction in N132D
Strong supernova shock waves compress, heat, and accelerate interstellar material, creating physical conditions that destroy interstellar dust grains. The grains are not instantly following the gas acceleration due to their inertia, but are gradually accelerated via gas-grain collisions, which cause a gradual grain erosion through sputtering (cf. Tielens et al., 1994). Furthermore, the grain population develops velocity differences, and subsequent grain-grain collisions cause shattering and vaporization depending on the relative velocity and grain sizes (Tielens et al., 1994; Borkowski & Dwek, 1995; Jones et al., 1996).
For N132D, Morse et al. (1996) have estimated a mean shock velocity of the X-ray emitting main blast wave of 800, a mean preshock density of 3, and a postshock temperature of K (cf. also Hwang et al., 1993), which is in good agreement with the Sedov model values from Hughes et al. (1998). For such a high-velocity shock, the dominant grain destruction process is thermal sputtering (Dwek & Arendt, 1992; Tielens et al., 1994; Borkowski & Dwek, 1995). The lifetime of silicate/graphite grains against this process was estimated by Draine & Salpeter (1979), and further refined by Tielens et al. (1994),
| (3) |
at a temperature of K. Thus, if the hydrogen density is , silicate/graphite grains with a radius are completely eroded after roughly 1500 yr. Likewise, 0.001 grains only survive 150 yr, whereas 0.1 grains would survive 15,000 yr.
Hughes (1987), Morse et al. (1996), and Hughes et al. (1998) proposed that the supernova of N132D exploded most likely within a low-density cavity in order to reconcile the Sedov age with the dynamical age without invoking large explosion energies. This scenario would allow the blast wave to expand unhindered in the beginning until it encountered the denser material at the boundary of the cavity. If we assume an initial, average expansion velocity of , the shock reached the cavity wall within about 800 years, supposing that the edge of the cavity lies close to the current MIPS 24 rim in the south of N132D and adopting the common center of the oxygen-rich ejecta as the expansion origin (cf. Morse et al., 1995). Since the dynamical age of N132D is 2500 yr (cf. Morse et al., 1995), we can infer that the shock has been interacting with the denser material for maybe 1700 yr. Hence, we would expect that most of the grains 0.01 that were initially present are destroyed by now through thermal sputtering if they were continuously residing in the hot plasma (cf. Eq. 3). Naturally, as the shock wave keeps expanding into new ISM material, the grain population is continually replenished.
In addition to thermal sputtering, shattering and vaporization remove some fraction of the large-size grains upon grain-grain collision. This is limited by the probability of a grain-grain encounter before being brought to rest with respect to the gas, which is of the order of the dust-to-gas mass ratio in the absence of betatron acceleration (Draine & McKee, 1993; Draine, 2004). Therefore, we conclude that thermal sputtering generally dominates the grain destruction in the fast shock of N132D, but shattering may redistribute the grain size distribution appreciably in denser clumps (cf. Jones et al., 1996), where the shock speed may be much lower than the estimated mean value of 800.
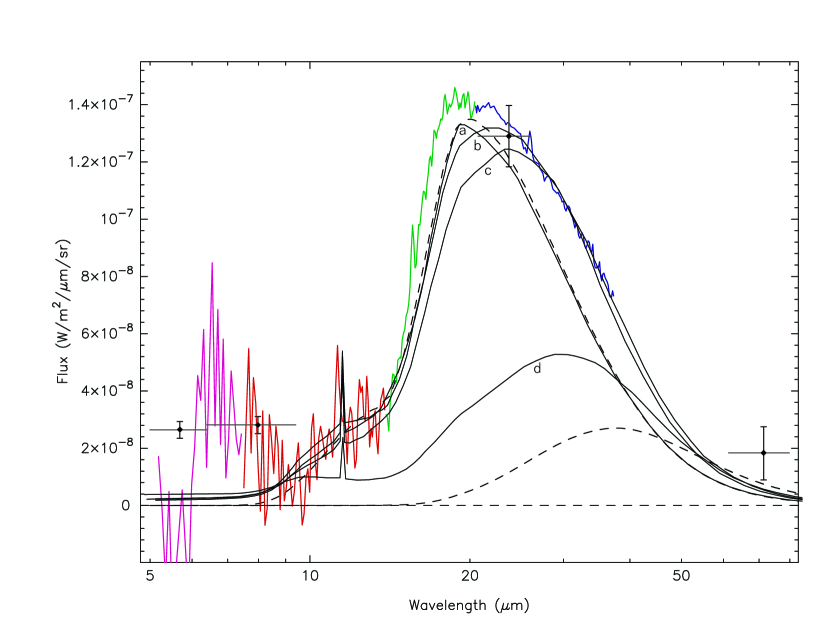
We compare our results to calculated model spectra from dust grains processed in fast, nonradiative shocks by Dwek et al. (1996). Figure 10 shows the spectrum from the southeastern rim of N132D together with our modified-blackbody fit components and a series of calculated shock model spectra adapted from Dwek et al. (1996). Their model assumes silicate/graphite grains in a power-law size distribution after Mathis et al. (1977) and grain destruction solely by sputtering without shattering/vaporization.
Overall, the scaled model spectra reproduce the observed spectrum of N132D remarkably well considering the model parameters are not fitted to the data. The applied scaling factors probably account for the filling factor of the emitting material, and were chosen empirically to match the flux of N132D. The main difference between the observed spectrum and the models is a lack of continuum emission at 6–9 and around 70, although the MIPS 70 flux measurement does not provide a very stringent constraint due to the background confusion. The long-wavelength emission may be due to high density material, e.g. a swept-up dense knot, with a shock velocity lower than 400. The lack of 6–9 flux in the models confirms that this emission is due to PAHs and not from a population of small, heated silicate/graphite grains. Note that the narrow feature near 11.5 in the calculated spectra is not the 11.3 PAH C-H bending mode but an IR active mode of crystalline graphite (cf. Draine, 1984), which would likely be smoothed out in an imperfect polycrystalline sample (Li & Draine, 2001).
Our high-temperature modified-blackbody fit component is very similar to the 1500/10 shock model, which justifies that our continuum fit is physically meaningful, particularly for the PAH C-C-C emission in the 15–20 range (Fig. 6). Generally, however, a single preshock density and/or a single shock velocity are apparently not sufficient to explain the continuum of the observed spectrum. The medium into which the shock wave expands is clumpy (cf. HST WFPC2 images of N132D by Morse et al., 1996), so we expect a combination of different densities and shock speeds.
IV.3.1 Comparison with previous observations
Figure 8 shows the spectrum of the galaxy NGC 7331 (cf. Smith et al., 2004) in comparison to our spectra for N132D. The spectrum of NGC 7331 bears a striking similarity to the spectrum of the molecular cloud/H II-region south of N132D, and also shows [Ne III] and [O IV]/[Fe II] lines. Since it represents an average galactic ISM mixture, the resemblance to our spectra is not surprising. Smith et al. (2004) have fitted the 15–20 PAH features in this spectrum with two Drude profile components at 16.40 () and 17.12 (), and measured a PAH flux of . This fit reproduces the overall shape of the emission in this region together with the S(1) component, but it does not take the blended features near 17.4 and 17.8 into account, which are also observed in other sources (cf. Fig. 11). Smith et al. (2004) reported the strong 17.1 feature as a possible new PAH C-C-C bending mode detection. If we adopt Lorentzian components of narrower width, we find the same PAH components with similar fluxes and widths as seen in our spectra of the molecular cloud/H II-region near N132D (cf. Table 1 and Fig. 11), and no need for a broad feature near 17.1. The 0.2–0.4 widths of these features are plausible for PAH molecules in the gas phase (Peeters et al., 2004). Our refitted, total PAH 15–20 flux in NGC 7331 is , which is a factor of 1.6 larger than observed in the southeastern rim of N132D, whereas the PAH band at 11.3 is about a factor 30 stronger in NGC 7331.
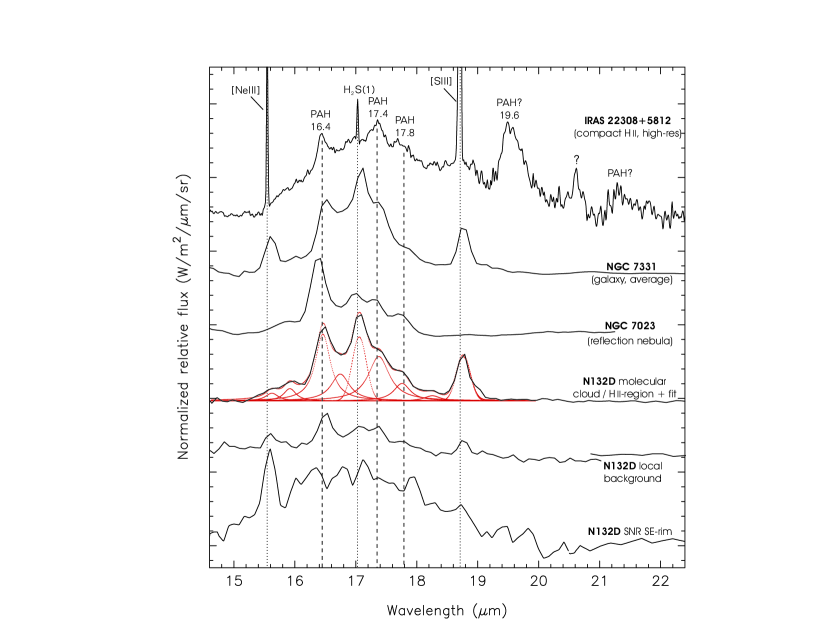
Van Kerckhoven et al. (2000, hereafter VHP) have measured 15–20 PAH plateau strengths as well as the PAH bands at 6.2 and 11.3 for a variety of Galactic sources from ISO SWS spectra. Table 2 shows a comparison of different PAH band ratios from the ISO results by VHP together with reanalyzed Spitzer archival data and our results for N132D. A comparison of the absolute fluxes is hampered by the larger ISO beam and different source distances, so we restrict ourselves to band ratios using units instead. Note also that VHP measured the 16.4 PAH features with a local continuum, i.e. just the excess portion of the feature on top of the 15–20 emission hump, whereas we generally use the mostly emission-free flux below 15 and above 22 to determine the continuum for fitting the 15–20 features. We analyzed Spitzer archival calibration data for two sources in the VHP sample, IRAS 22308+5812 and NGC 7027, in order to test whether the results are comparable. We find that the measured PAH ratios for these two sources match within 30 percent, which is a reasonable agreement given the uncertainties due to the different beam sizes and continuum choices for the fitting.
VHP interpret the observed relative strengths of the broad plateaus and the narrower PAH bands in terms of variations in the size distribution, i.e. the larger PAHs with a few thousand carbon atoms that give rise to the 15–20 emission probably originated from dense cloud cores that formed the massive stars in the H II-regions, whereas smaller PAHs with less than a few hundred carbon atoms give rise to strong 6.2–11.3 bands. They also tentatively attribute the discrete 16.4 band to C-C-C bending modes of pendant benzene ring substructures in smaller PAH molecules (cf. also Moutou et al., 2000, who propose PAH molecules containing pentagonal rings as the carrier of the 16.4 band).
| Source | Type | ||||
| LkH 234 -ridge | PDR | 0.2 | 0.08 | 0.1 | 0.04 |
| NGC 7331 (average) | Galaxy | 0.3 | 0.07 | 0.2 | 0.05 |
| NGC 7023 | RN | 0.3 | 0.14 | 0.1 | 0.06 |
| NGC 7027 (edge) | PN | 0.4 | 0.04 | 1.2 | 0.13 |
| *NGC 7027 | PN | 0.5 | 0.04 | 0.7 | 0.06 |
| *CD-4211721 | YSO | 0.7 | 0.10 | 0.6 | 0.08 |
| *IRAS 03260+3111 | HAeBe | 1.0 | 0.06 | 0.8 | 0.05 |
| *IRAS 23133+6050 | cH ii | 2.2 | 1.5 | ||
| *IRAS 22308+5812 | cH ii | 2.3 | 1.8 | ||
| IRAS 22308+5812 | cH ii | 2.5 | 0.27 | 0.8 | 0.08 |
| *IRAS 18317-0757 | cH ii | 2.5 | 1.2 | ||
| *Sh 2-106 IRS4 | H ii | 5.1 | 3.9 | ||
| N132D SE-rim | SNR | 7.11.0 | 4 | ||
| N132D local backgr. | 0.70.2 | 0.18 | 0.5 | 0.13 |
Table 2 is sorted to show the trend of rising PAH 15–20 to 11.3 ratio. For a diffuse ISM mix of starlight-heated, neutral and ionized PAHs, 15–20 features are efficiently produced by PAH particles in the 8–25 Å size range (300 carbon atoms). The 11.3 feature can be produced by particles as large as about 20 Å or , but more efficiently by particles with radius Å or (Draine & Li, 2006). A direct, quantitative comparison of the observed PAH 15–20 to 11.3 and 6.2, or the 16.4 to 11.3 and 6.2 ratios with model calculations is difficult for a number of reasons. Foremost, there is a unique PAH size distribution, which differs from source to source. Secondly, individual, discrete PAH features may be due to specific substructures in PAH molecules of a certain size (cf. interpretation of the 16.4 feature above). Finally, the specific local physical conditions affect the charge state, the amount of dehydrogenation, and the heating process of the PAH molecules.
Nevertheless, it is illustrative to note some general trends when comparing the observed PAH emission ratios in Table 2 with calculated PAH band radiation efficiencies as function of size for a diffuse ISM mix of neutral/ionized PAHs (cf. Draine & Li, 2006). We approximate the predicted, total emitted power in the 15–20 region by scaling the calculated 17.4 band power with the total integrated absorption cross section per C atom in the 15–20 range divided by the cross section for the 17.4 band. This gives approximately a scale factor of 4, using the cross sections per C atom adopted by Draine & Li (2006). The lowest observed 15–20/11.3, 15–20/6.2, 16.4/11.3, and 16.4/6.2 ratios in Table 2 correspond then to the smallest PAHs considered in the calculations by Draine & Li (2006), which contain about 20 carbon atoms. PAHs smaller than about 20–50 C atoms are photolytically unstable (cf. Allamandola et al., 1989; Jochims et al., 1994; Allain et al., 1996b; Le Page et al., 2003). Hence, the PAH size distribution of the sources near the top of Table 2 is probably dominated by PAHs of that size. This is generally consistent with earlier estimates of PAH sizes derived from the 3.3 and 3.4 C-H stretching modes (Allamandola et al., 1989, Table 3), and from profile fitting of the PAH 3.3-11.3 bands with calculated spectra from a distribution of small PAHs (Verstraete et al., 2001; Pech et al., 2002).
For the supernova remnant N132D, we expect that small grains/PAHs are rapidly destroyed by thermal sputtering (cf. Sect. IV.3), i.e. relatively larger grains/PAHs tend to dominate the size distribution, which is consistent with the high PAH 15–20 to 11.3 ratio and the absence of discrete 15–20 features. A PAH 15–20 to 11.3 ratio of 7 as observed in N132D corresponds to PAH sizes of about 20 Å or 4000 C atoms, if we adopt the calculations by Draine & Li (2006) as a tentative guideline. This number is a rough estimate, since electron collisions rather than starlight dominate grain heating in N132D, changing the amount and frequency of energy deposition into grains compared to the model calculations. In addition, even large PAHs may be dehydrogenated in the hot plasma of N132D, which provides another rationale for the weak 11.3 feature and the resulting high 15–20/11.3 ratio. As a consequence, the size estimate from that ratio is probably an upper limit, since PAHs in N132D have most likely a higher degree of dehydrogenation than in the diffuse ISM. A lower limit estimate of the PAH sizes in N132D from the 15–20/6.2 ratio is about 500 C atoms, which is similar to the sizes of the very small grains/large PAHs proposed as carriers of the broad plateaus underlying the 6–14 PAH features (e.g. Allamandola et al., 1989; Peeters et al., 2002; Rapacioli et al., 2005, and cf. Sect. III.2.1 ).
The lifetime of 500–4000 C atom grains, about 0.001–0.002 in size, is 80–160 yr according to Eq. 3, which describes thermal sputtering of silicate/graphite grains in the forward shock of N132D. We presume that large PAHs/amorphous carbon particles behave similarly to graphite in terms of stability against thermal sputtering, which is a reasonable assumption since both consist mainly of aromatic carbon ring systems. Thus, it is plausible for large PAHs to survive thermal sputtering in N132D long enough to maintain a detectable population, particularly since both PAHs and grains will be replenished as the shock wave keeps expanding into new ISM material.
V. Summary
We detected strong MIPS 24 emission from swept-up, shock-heated dust grains in the young LMC supernova remnant N132D (Sect. IV.2). In addition, we reported the first detection of PAH bands from a SNR, with tentative PAH features between 6 and 9, a weak 11.3 feature, and a prominent 15–20 emission hump. This adds to the growing body of sources showing 15–20 emission, which is interpreted as C-C-C bending modes of large PAHs (Sect. III.2.1).
Overall, our observations show that dust grains survive a strong supernova shock, which is consistent with our estimates of the dust destruction rate by thermal sputtering (Sect. IV.3). Our results also support the proposed correlation of PAH size and the 15–20 to 11.3 emission ratio (Van Kerckhoven et al., 2000). The ratio of 15–20 to 11.3 emission in N132D is notably higher compared to other types of sources, which we interpret as rapid destruction of small PAHs/grains in the supernova blast wave via thermal sputtering, and possible dehydrogenation of the remaining PAH population in the high temperature plasma. We conclude that large PAHs/amorphous carbon particles with approximately 500–4000 C atoms survive the harsh conditions in the forward shock of N132D long enough to be detected in our spectra (Sect. IV.3.1). Future observations of supernova remnants of various ages located in different environments will probe whether, and what fraction of dust grains and PAHs are ultimately able to survive the aftermath of strong supernova shock waves.
Acknowledgements.
This work is based on observations made with the Spitzer Space Telescope, which is operated by the Jet Propulsion Laboratory, California Institute of Technology under a contract with NASA. We thank E. Dwek, L. Allamandola, and A. Jones for fruitful discussions, and B. Draine for providing a late draft of his manuscript Draine & Li (2006) prior to publication. We thank L. Rudnick, T. DeLaney, and U. Hwang for their collaboration on the Spitzer proposal leading to this work and their helpful comments. Support for this work was provided by the NASA LTSA program, NRA-01-01-LTSA-013, and NASA funding through the Spitzer GO program.References
- Allain et al. (1996a) Allain, T., Leach, S., & Sedlmayr, E. 1996a, A&A, 305, 602
- Allain et al. (1996b) Allain, T., Leach, S., & Sedlmayr, E. 1996b, A&A, 305, 616
- Allamandola et al. (1989) Allamandola, L. J., Tielens, A. G. G. M., & Barker, J. R. 1989, ApJS, 71, 733
- Allamandola et al. (1999) Allamandola, L. J., Hudgins, D. M., & Sandford, S. A. 1999, ApJ, 511, L115
- Armus et al. (2004) Armus, L., et al. 2004, ApJS, 154, 178
- Banas et al. (1997) Banas, K. R., Hughes, J. P., Bronfman, L., & Nyman, L.-Å. 1997, Astrophys. J. , 480, 607
- Behar et al. (2001) Behar, E., Rasmussen, A. P., Griffiths, R. G., Dennerl, K., Audard, M., Aschenbach, B., & Brinkman, A. C. 2001, A&A, 365, L242
- Blair et al. (1994) Blair, W. P., Raymond, J. C., & Long, K. S. 1994, Astrophys. J. , 423, 334
- Blair et al. (2000) Blair, W. P., Morse, J. A., Raymond, J. C., Kirshner, R. P., Hughes, J. P., Dopita, M. A., Sutherland, R. S., Long, K. S., & Winkler, P. F. 2000, Astrophys. J. , 537, 667
- Borkowski & Dwek (1995) Borkowski, K. J., & Dwek, E. 1995, Astrophys. J. , 454, 254
- Cartledge et al. (2005) Cartledge, S. I. B. , Clayton, G. C. , Gordon, K. D. , Rachford, B. L. , Draine, B. T. , Martin, P. G. , Mathis, J. S. , Misselt, K. A. , Sofia, U. J. , Whittet, D. C. B. , & Wolff, M. J. 2005, Astrophys. J. , 630, 355
- Cioni et al. (2001) Cioni, M.-R. L., Marquette, J.-B., Loup, C., Azzopardi, M., Habing, H. J., Lasserre, T., & Lesquoy, E. 2001, A&A, 377, 945
- Clayton et al. (2003) Clayton, G. C., Wolff, M. J., Sofia, U. J., Gordon, K. D., & Misselt, K. A. 2003, Astrophys. J. , 588, 871
- Dickel & Milne (1995) Dickel, J. R., & Milne, D. K. 1995, AJ, 109, 200
- Draine (1984) Draine, B. T. 1984, ApJ, 277, L71
- Draine (2004) Draine, B. T. 2004, The Cold Universe, Saas-Fee Advanced Course 32, Springer-Verlag, Edited by D. Pfenniger and Y. Revaz
- Draine & Lee (1984) Draine, B. T., & Lee, H. M. 1984, Astrophys. J. , 285, 89
- Draine & Li (2001) Draine, B. T., & Li, A. 2001, Astrophys. J. , 551, 807
- Draine & Li (2006) Draine, B. T., & Li, A. 2006, Astrophys. J. , submitted; astro-ph/0608003
- Draine & McKee (1993) Draine, B. T., & McKee, C. F. 1993, ARA&A, 31, 373
- Draine & Salpeter (1979) Draine, B. T., & Salpeter, E. E. 1979, Astrophys. J. , 231, 77
- Dwek & Arendt (1992) Dwek, E., & Arendt, R. G. 1992, ARA&A, 30, 11
- Dwek et al. (1996) Dwek, E., Foster, S. M., & Vancura, O. 1996, Astrophys. J. , 457, 244
- Favata et al. (1997) Favata, F., Vink, J., Parmar, A. N., Kaastra, J. S., & Mineo, T. 1997, A&A, 324, L45
- Favata et al. (1998) Favata, F., Vink, J., Parmar, A. N., Kaastra, J., & Mineo, T. 1998, A&A, 340, 626
- Fazio et al. (2004) Fazio, G. G., et al. 2004, ApJS, 154, 10
- Higdon et al. (2004) Higdon, S. J. U., Devost, D., Higdon, J. L., Brandl, B. R., Houck, J. R., Hall, P., Barry, D., Charmandaris, V., Smith, J. D. T., Sloan, G. C., & Green, J., 2004, PASP, 116, 975
- Hony et al. (2001) Hony, S., Van Kerckhoven, C., Peeters, E., Tielens, A. G. G. M., Hudgins, D. M., & Allamandola, L. J. 2001, A&A, 370, 1030
- Houck et al. (2004) Houck, J. R., et al. 2004, ApJS, 154, 18
- Hughes (1987) Hughes, J. P. 1987, Astrophys. J. , 314, 103
- Hughes et al. (1998) Hughes, J. P., Hayashi, I., & Koyama, K. 1998, Astrophys. J. , 505, 732
- Hwang et al. (1993) Hwang, U., Hughes, J. P., Canizares, C. R., & Markert, T. H. 1993, Astrophys. J. , 414, 219
- Jochims et al. (1994) Jochims, H. W., Rühl, E., Baumgärtel, H., Tobita, S., & Leach, S. 1994, Astrophys. J. , 420, 307
- Jones et al. (1996) Jones, A. P., Tielens, A. G. G. M., & Hollenbach, D. J. 1996, Astrophys. J. , 469, 740
- Laor & Draine (1993) Laor, A., & Draine, B. T. 1993, Astrophys. J. , 402, 441
- Le Page et al. (2003) Le Page, V., Snow, T. P., & Bierbaum, V. M. 2003, Astrophys. J. , 584, 316
- Li & Draine (2001) Li, A., & Draine, B. T. 2001, Astrophys. J. , 554, 778
- Maccioni & Perinotto (1994) Maccioni, A., & Perinotto, M. 1994, A&A, 284, 241
- Mathis et al. (1977) Mathis, J. S., Rumpl, W., & Nordsieck, K. H. 1977, Astrophys. J. , 217, 425
- Morris et al. (2004) Morris, P. W., Noriega-Crespo, A., Marleau, F. R., Teplitz, H. I., Uchida, K. I., & Armus, L. 2004, ApJS, 154, 339
- Morse et al. (1995) Morse, J. A., Winkler, P. F., & Kirshner, R. P. 1995, AJ, 109, 2104
- Morse et al. (1996) Morse, J. A., Blair, W. P., Dopita, M. A., Hughes, J. P., Kirshner, R. P., Long, K. S., Raymond, J. C., Sutherland, R. S., & Winkler, P. F. 1996, AJ, 112, 509
- Moutou et al. (2000) Moutou, C., Verstraete, L., Léger, A., Sellgren, K., & Schmidt, W. 2000, A&A, 354, L17
- Pech et al. (2002) Pech, C., Joblin, C., & Boissel, P. 2002, A&A, 388, 639
- Peeters et al. (2004) Peeters, E., Mattioda, A. L., Hudgins, D. M., & Allamandola, L. J. 2004, ApJ, 617, L65
- Peeters et al. (2002) Peeters, E., Hony, S., Van Kerckhoven, C., Tielens, A. G. G. M., Allamandola, L. J., Hudgins, D. M., & Bauschlicher, C. W. 2002, A&A, 390, 1089
- Pei (1992) Pei, Y. C. 1992, Astrophys. J. , 395, 130
- Puget & Léger (1989) Puget, J. L., & Léger, A. 1989, ARA&A, 27, 161
- Rapacioli et al. (2005) Rapacioli, M., Joblin, C., & Boissel, P. 2005, A&A, 429, 193
- Reach et al. (2005) Reach, W. T., et al. 2005, PASP, 117, 978
- Reach et al. (2006) Reach, W. T., Rho, J., Tappe, A., Pannuti, T. G., Brogan, C. L., Churchwell, E. B., Meade, M. R., Babler, B., Indebetouw, R., & Whitney, B. 2006, AJ, 131, 1479
- Rieke et al. (2004) Rieke, G. H., et al. 2004, ApJS, 154, 25
- Smith et al. (2004) Smith, J. D. T., et al. 2004, ApJS, 154, 199
- Sutherland & Dopita (1995) Sutherland, R. S., & Dopita, M. A. 1995, Astrophys. J. , 439, 365
- Tielens et al. (1994) Tielens, A. G. G. M., McKee, C. F., Seab, C. G., & Hollenbach, D. J. 1994, Astrophys. J. , 431, 321
- Van Diedenhoven et al. (2004) Van Diedenhoven, B., Peeters, E., Van Kerckhoven, C., Hony, S., Hudgins, D. M., Allamandola, L. J., & Tielens, A. G. G. M. 2004, Astrophys. J. , 611, 928
- Van Kerckhoven et al. (2000) Van Kerckhoven, C., Hony, S., Peeters, E., Tielens, A. G. G. M., Allamandola, L. J., Hudgins, D. M., Cox, P., Roelfsema, P. R., Voors, R. H. M., Waelkens, C., Waters, L. B. F. M., & Wesselius, P. R. 2000, A&A, 357, 1013 (VHP)
- Verstraete et al. (2001) Verstraete, L., Pech, C., Moutou, C., Sellgren, K., Wright, C. M., Giard, M., Léger, A., Timmermann, R. & Drapatz, S. 2001, A&A, 372, 981
- Weingartner & Draine (2001) Weingartner, J. C., & Draine, B. T. 2001, Astrophys. J. , 548, 296
- Werner et al. (2004) Werner, M. W., Uchida, K. I., Sellgren, K., Marengo, M., Gordon, K. D., Morris, P. W., Houck, J. R., & Stansberry, J. A. 2004, ApJS, 154, 309
- Werner et al. (2004) Werner, M. W., et al. 2004, ApJS, 154, 1
- Whittet (2003) Whittet, D. C. B. 2003, Dust in the galactic environment, 2nd ed., Bristol: Institute of Physics (IOP) Publishing