11email: jordi@astro.unibas.ch, grebel@astro.unibas.ch, ammon@astro.unibas.ch
Empirical Color Transformations Between SDSS Photometry and Other Photometric Systems
Abstract
Aims. We present empirical color transformations between the Sloan Digital Sky Survey (SDSS) ugriz photometry and Johnson-Cousins UBVRI system and Becker’s RGU system, respectively. Owing to the magnitude of data that is becoming available in the SDSS photometric system it is particularly important to be able to convert between this new system and traditional photometric systems. Unlike earlier published transformations we based our calculations on stars actually measured by the SDSS with the SDSS 2.5-m telescope. The photometric database of the SDSS provides in a sense a single-epoch set of ’tertiary standards’ covering more than one quarter of the sky. Our transformations should facilitate their use to easily and reliably derive the corresponding approximate Johnson-Cousins or RGU magnitudes.
Methods. The SDSS survey covers a number of areas that were previously established as standard fields in the Johnson-Cousins system, in particular, fields established by Landolt and by Stetson. We used these overlapping fields to create well-photometered star samples on which our calculated transformations are based. For the RGU photometry we used fields observed in the framework of the new Basel high-latitude field star survey.
Results. We calculated empirical color transformations between SDSS photometry and Johnson-Cousins UBVRI and Becker’s RGU system. For all transformations we found linear relations to be sufficient. Furthermore we showed that the transformations between the Johnson-Cousins and the SDSS system have a slight dependence on metallicity.
Key Words.:
Surveys – Catalogs – Techniques: photometric1 Introduction
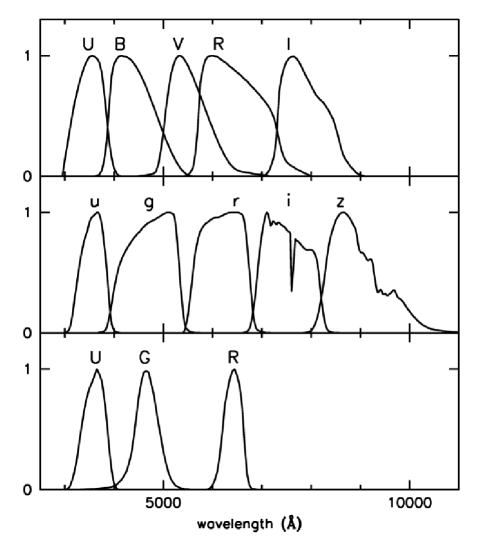
The Sloan Digital Sky Survey (SDSS) is the largest photometric and spectroscopic survey in the optical wavelength range. The SDSS is mapping one quarter of the entire sky and is measuring positions and magnitudes for over 100 million celestial objects (York et al. 2000; Grebel 2001). The SDSS photometric system was specifically designed for the survey (Fukugita et al. 1996; Smith et al. 2002), but many observatories worldwide have since purchased SDSS filters as well. The five SDSS ugriz filters are a modified Thuan-Gunn system (Thuan & Gunn 1976). Their most prominent feature are the wide passbands, which cover an effective wavelength range of nm to nm, and the lack of overlap between neighboring passbands. These properties ensure a high efficiency for faint object measurements, independent spectral information in each band, and coverage of essentially the entire optical wavelength range accessible from the ground.
The SDSS provides a photometric catalog of unprecedented depth, homogeneity, and quality. Owing to the magnitude of the data that are becoming publicly available in this new photometric system (Stoughton et al. 2002; Abazajian et al. 2003, 2004, 2005; Adelman-McCarthy et al. 2006), it is important to have well-calibrated transformation relations between this system and traditional photometric systems such as the Johnson-Cousins system (Johnson & Morgan 1953; Cousins 1976). It is easy to imagine situations where one wishes to know, e.g., the V-band magnitude of a star of interest that happens to be in the SDSS database and for which no other photometry is available. Moreover, the large area coverage of the SDSS and the high quality of its drift-scan photometry make it also suitable as a source of ‘tertiary standards’, although there is no information on variability for the majority of the SDSS objects. This disadvantage is compensated by the large number of photometered sources even within a small patch of the sky. Thus a few variable objects will merely appear as outliers and will not have a major effect on a photometric transformation. Also, if observations in a traditional photometric system are being obtained during a non-photometric night, existing transformable SDSS photometry of the same field will prove very useful for at least an approximate photometric calibration (Koch et al. 2004a, b). Other large-area photometric survey catalogs are already being used in this manner; for instance, Udalski et al. (1998, 2000, 2002); Epchtein et al. (1999); Zaritsky et al. (2002, 2004); Skrutskie et al. (2006).
Prior to the start of SDSS observations, Fukugita et al. (1996) derived theoretical transformation relations between the Johnson-Cousins system and the SDSS u′g′r′i′z′ system. The primes refer to the filter-detector combination envisioned to be used at the photometric monitoring telescope at Apache Point Observatory. This auxiliary telescope observes SDSS photometric standards while the science observations are done in drift-scan mode with the actual SDSS survey telescope, a dedicated 2.5-m telescope at the same site (see, e.g., York et al. (2000); Stoughton et al. (2002); Gunn et al. (2006)). Fukugita et al. (1996) calculated synthetic magnitudes using the planned filter-detector combinations and spectral energy distributions of stars from the Gunn & Stryker (1983) spectrophotometric atlas. These synthetic magnitudes were then used to determine photometric transformations.
Smith et al. (2002) calculated transformations between the SDSS u′g′r′i′z′ system and the Johnson–Cousins photometric system based on actual observations in u′g′r′i′z′ filters. In this context the primes refer to the SDSS filter-detector combination used at the 1.0-m telescope at the US Naval Observatory (USNO), Flagstaff Station. These observations were used to set up a system of 158 bright standard stars that define the u′g′r′i′z′ system and to derive the above mentioned transformation equations. Smith et al. (2002) point out that there are “small but significant” differences between the USNO SDSS filters and the SDSS filters used at the 2.2-m telescope at Apache Point Observatory, leading to expected systematic differences between the USNO magnitudes and the final SDSS magnitudes.
Similarly, Karaali et al. (2005) used observations obtained in u′g′r′ filters at the Isaac Newton Telescope (INT) at La Palma, Spain. These filters were designed to reproduce the SDSS system. These data were complemented by Landolt (1992) UBV standard star photometry and used to calculate transformations between the INT SDSS u′g′r′ filter-detector combination and standard Johnson–Cousins photometry. Karaali et al. (2005) presented for the first time transformation equations depending on two colors. Since the INT filters and detector differ from the actual filter-detector combinations used by the SDSS, again systematic deviations are to be expected.
Direct empirical transformations between SDSS point-source photometry from the “early data release” (EDR; Stoughton et al. (2002)) and certain Johnson-Cousins filters were calculated by Odenkirchen et al. (2001) and by Rave et al. (2003). Rave et al. (2003) based their transformations on resolved stellar photometry of the Draco dwarf spheroidal galaxy obtained with the SDSS as well as with various other telescopes in different variants of the Johnson-Cousins system. The SDSS EDR photometry was then superseded by later SDSS data releases (Abazajian et al. 2003, 2004, 2005; Adelman-McCarthy et al. 2006).
A recent theoretical transformation was carried out by Girardi et al. (2004). These authors used the actual SDSS passbands and CCD sensitivity curves of the SDSS camera (Gunn et al. 1998) employed at the 2.5-m SDSS telescope at Apache Point Observatory to transform theoretical stellar isochrones into the SDSS ugriz system.
The third photometric system that we are considering here is the RGU system by Becker (Becker 1946), a broad-band photometric system that was initially introduced with the goal of measuring stellar parameters and Galactic structure. No earlier transformations between SDSS photometry and RGU photometry have been published. For transformation relations between RGU and UBV see Steinlin (1968a, b); Bell (1972); Buser (1978a, b). While RGU photometry is not widely used, it plays a continuing role due to the existence of the “new Basel high-latitude field star survey” (Buser & Käser 1985; Buser et al. 1998). The goal of this single-epoch photographic survey is to map the Galactic density structure and the metallicity distribution in the various components of the Milky Way. For this purpose, 14 intermediate and high-latitude fields were observed, in which three-color RGU photometry of over 18 000 stars was measured. The limiting magnitude of this Galactic survey is approximately or . This survey may seem to be obsolescent by modern standards due to its small number of stars, the shallow exposures, the limited photographic resolution, and the availability of much deeper, more homogeneous, and much larger CCD surveys. On the other hand, this photographic survey has played an important role in uncovering the structure of our Galaxy (e.g., Buser et al. (1999)). Transformation relations between SDSS and RGU photometry help to evaluate the earlier findings with respect to modern explorations of the structure of the Milky Way (e.g., Chen et al. (2001); Juric et al. (2005)). The Basel survey provides star counts (or space densities) also for distances relatively close to the Sun, whereas there is a gap at these distances in studies carried out using SDSS data due to the saturation limit at . Space densities for stars with brighter apparent magnitudes can be combined with Hipparchos parallaxes, thus providing reliable Galactic model parameters. Moreover, the metallicity sensitivity of the RGU system (e.g., Buser & Fenkart (1990)) adds continuing value to the Basel high-latitude field star survey. Finally, this survey comprises a number of important Galactic sight lines that are not included in the currently available wide-field CCD surveys, and the analysis of these sight lines is continuing.
Here we present empirical color transformations between the SDSS ugriz photometric system using point-source photometry obtained with the SDSS 2.5-m telescope at Apache Point Observatory, and the Johnson-Cousins UBVRI system as well as the RGU system, respectively. These empirical colors have the advantage of not having to rely on synthetic colors or on passband-detector combinations of other telescopes. Hence, they provide the most direct transformations possible. In Sect. 2 we present the sources of our star samples and the criteria applied to choose the stars. Section 3 contains our calculations and the resulting transformation equations. In Sect. 4 we discuss our results and some possible future developments.
2 Data
Our goal is to derive empirical transformations between the SDSS photometry as defined by the public SDSS data and the two other aforementioned photometric systems while minimizing the dependence on specific filter-detector combinations that deviate from the generic ones. The data used for our transformations were taken from the four different sources described below.
The SDSS data release 4 (SDSS DR4; Adelman-McCarthy et al. (2006)) comprises stellar point-source magnitudes provided by the SDSS photometry pipelines (Lupton et al. 2001; Stoughton et al. 2002). This point-source photometry is not expected to change anymore between DR4 and later releases (e.g., Adelman-McCarthy et al. (2006)).
2.1 Johnson-Cousins photometry
For Johnson-Cousins photometry the most generic standard star database available that lends itself to a comparison is the system of standard stars set up by A. Landolt, in particular the catalog published by Landolt (1992). This catalog contains an extensive set of mainly equatorial fields observed repeatedly with photoelectric aperture photometry. A number of the Landolt fields overlap with the area scanned by the SDSS. The Landolt photometry is widely used to transform and calibrate imaging data. The Landolt stars cover a -magnitude range of approximately 11.5 to 16.0. With respect to SDSS photometry, the Landolt standard stars have one drawback: Many of them are brighter than the saturation cutoff in the SDSS system (). Nonetheless, the Landolt stars are valuable particularly for the transformation of the -band photometry as we will see later.
The problem of the reduced number of stars in common between the Landolt catalog and the SDSS due to saturation is alleviated by the extension of Landolt’s standard stars to fainter magnitudes by Stetson (2000). Stetson used a large set of multi-epoch CCD observations centered on Landolt fields and other regions in the sky and reduced them in a homogeneous manner tied to the Landolt UBVRI system. The larger area coverage and greater sensitivity of the CCD observations as compared to the earlier photomultiplier observations permitted Stetson to include stars down to or 20. Since 2000, Stetson has been publishing a gradually growing list of suitable faint stars (Stetson 2000) with repeat observations at the website of the Canadian Astronomy Data Center111http://cadcwww.dao.nrc.ca/standards/. The Stetson catalog contains only stars that were observed at least five times under photometric conditions and the standard error of the mean magnitude is less than 0.02 mag in at least two of the four filters. Stetson’s data base also contains fields not covered by Landolt, e.g., fields in globular clusters and in nearby resolved dwarf galaxies. While Landolt’s original fields contained mainly Population I stars, Stetson’s new fields also include a sizable fraction of Population II stars.
| Fields | Stetson Stars | Matches222with clean photometry |
|---|---|---|
| L92 | 214 | 138 |
| L95 | 427 | 250 |
| NGC 2419 | 1 188 | 520 |
| NGC 2420 | 188 | 54 |
| NGC 2683 | 27 | 7 |
| PG 0918 | 122 | 53 |
| L101 | 118 | 67 |
| Leo I | 1 840 | 508 |
| PG 1047 | 67 | 36 |
| NGC 5194 | 39 | 3 |
| NGC 5272 | 432 | 111 |
| NGC 5466 | 29 | 3 |
| L106_550 | 16 | 5 |
| Pal 5 | 65 | 48 |
| L107 | 729 | 490 |
| Pal 14 | 163 | 116 |
| Draco | 529 | 256 |
| L112 | 74 | 26 |
| NGC 7078 | 967 | 114 |
| NGC 7089 | 377 | 26 |
| L113 | 484 | 320 |
| PG 2213 | 36 | 16 |
| Pegasus | 38 | 28 |
| Total | 8 169 | 3 195 |
For our work the Stetson fields published as of January 2005 were used. As most of the SDSS DR4 sky coverage is in the northern part of the sky, it was straightforward to select those fields from the Stetson catalog that overlap with the SDSS DR4: 30 fields were identified and all stars available from the SDSS DR4 database within these fields were downloaded. For the subsequent matching and calculation of transformation relations only SDSS stars with clean photometry were used. The combination of flags describing the clean photometry can be found on the SDSS DR4 webpage333http://cas.sdss.org/astrodr4/en/help/docs/sql_help.asp#clean. This flag combination excludes stars whose photometry may be questionable for a number of reasons, e.g., due to saturation, overlaps with other objects (blends), location at the edge of a frame, large errors in fitting a point spread function, etc.
We then matched the Stetson stars and the SDSS stars by their coordinates. The coordinates of the stars in DR4 are measured with an accuracy of less than rms per coordinate (Adelman-McCarthy et al. 2006). In the Stetson catalog the coordinates are published with an accuracy of for the right ascension and for the declination. Two stars – one from each sample – are considered equal if their angular separation is smaller than : , where and stand for the right ascension and declination of the stars in arcsec.
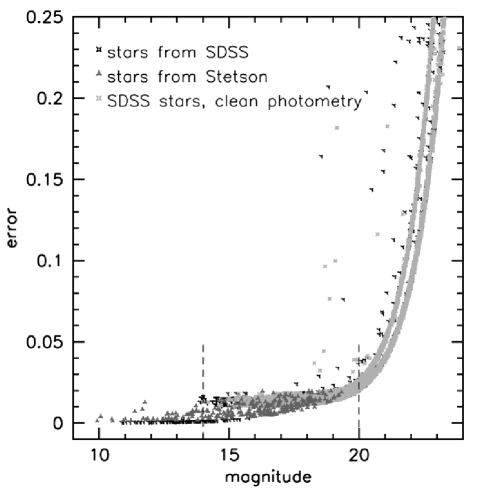
Although the matching radius was chosen generously we do not find a matching SDSS star for each Stetson star (see Table 1). The clean photometry rule removes between 30 and 40 percent of our initial star sample. Furthermore, the SDSS photometric pipeline only detects a reduced number of stars in crowded fields. This affects in particular fields in globular clusters such as NGC 2419, NGC 5272, NGC 5466, NGC 7078, and NGC 7089, and fields with luminous extended galaxies such as NGC 2683. For fields with a very high degree of crowding, no SDSS data are available since these fields were intentionally omitted during the pipeline reduction process. Owing to these limitations, our original number of 30 common fields is actually reduced to 23 fields in which common stars in Stetson’s and the SDSS catalogs could be identified. Fields without any common stellar objects with clean photometry include regions centered on the galaxies M81, NGC 4526, and NGC 4736, on the globular clusters M5 and M13, and on fields with stars that are all saturated in the SDSS like L114-750. In Table 1 the number of matches for each of the remaining 23 fields is listed. In Fig. 2 we plot the magnitude of Stetson stars against their photometric error and the magnitude of SDSS stars against their photometric error in order to illustrate how many stars we lose in the matching process. The Stetson stars are all brighter than magnitude, but at the same time the brightest SDSS stars with clean photometry are of magnitude. Possible matches between stars in the Stetson and in the SDSS database will therefore lie within this magnitude interval (see dashed vertical lines in Fig. 2).
Since Stetson’s fields do not include -band photometry in the fields that overlap with the SDSS, we complemented the Stetson data by standard stars from Landolt (Landolt 1992), our third data source. Only 54 stars from the Landolt catalog overlap with the DR4 sky coverage and have clean photometry in the SDSS, hence transformations involving are necessarily based on a small subsample of stars.
2.2 Becker’s RGU system
Our fourth source of data is the “new Basel high-latitude field star survey” (Buser & Käser 1985; Buser et al. 1998). The fourteen fields of the Basel high-latitude field star survey are all specified by a pair of galactic coordinates (Buser et al. 1998). These coordinates are not consistently defined and do not necessarily mark the center of the field. In most of the fields, they mark one of the corners. Three fields completely overlap with the SDSS DR4 sky coverage and six others have a partial overlap. The other five fields do not lie in the region of the sky that the SDSS DR4 has scanned. For deriving transformations, those two of the completely overlapping fields were used that had the best photometric quality. Table 2 lists the two fields and the number of found matches. The sample for the second set of transformations contained a total of 775 stars.
The Basel survey does not list coordinates of the stars in its fields, so they were matched visually using the Basel finding charts. In these prints of the photographic plates each measured star is marked with its catalog number, making the identification of stars in common with the SDSS a rather tedious enterprise. Not for all Basel stars a matching partner was found. The SDSS CCD photometry has higher resolution than the photographic plates of the Basel survey. In some cases, the SDSS recognized an object as a galaxy, whereas in the Basel survey it was treated as a star. In other cases, there was simply no star in the SDSS where Basel detected one. Occasionally the SDSS detected a fainter object within a radius of to of the dominant star, whereas in the Basel catalog only one source was detected. In all those cases these stars were deleted from our sample in order to ensure that only reliable photographic photometry was included. Moreover, we only used SDSS sources with clean photometry.
| Fields | Stars in Basel | Matches444with clean photometry |
|---|---|---|
| SA94 | 1 239 | 545 |
| SA107 | 532 | 230 |
| Total | 1 771 | 775 |
3 Results
3.1 Transformations between SDSS and Johnson–Cousins Photometry
The transformation between the Johnson–Cousins UBVRI photometry system and the SDSS ugriz system was carried out using the following eight general equations:
| (1) | |||||
| (2) | |||||
| (3) | |||||
| (4) | |||||
| (5) | |||||
| (6) | |||||
| (7) | |||||
| (8) |
Not for all of the standard stars in Stetson’s catalog measurements in all four bands (BVRI) are available, hence the number of stars used differed somewhat depending on the filters used in the transformation equation. We calculate in all but one case transformations depending on one color only. For the equation two colors are used since the SDSS g passband overlaps with the Johnson B and V passband, so a dependence on can be expected, and more importantly, the variation in position of the stellar locus owing to temperature, surface gravity, and metallicity is particularly large in this wavelength range (e.g., Grebel & Roberts (1995); Lenz et al. (1998)).
3.1.1 ‘Global’ transformations between UBVRI and ugriz
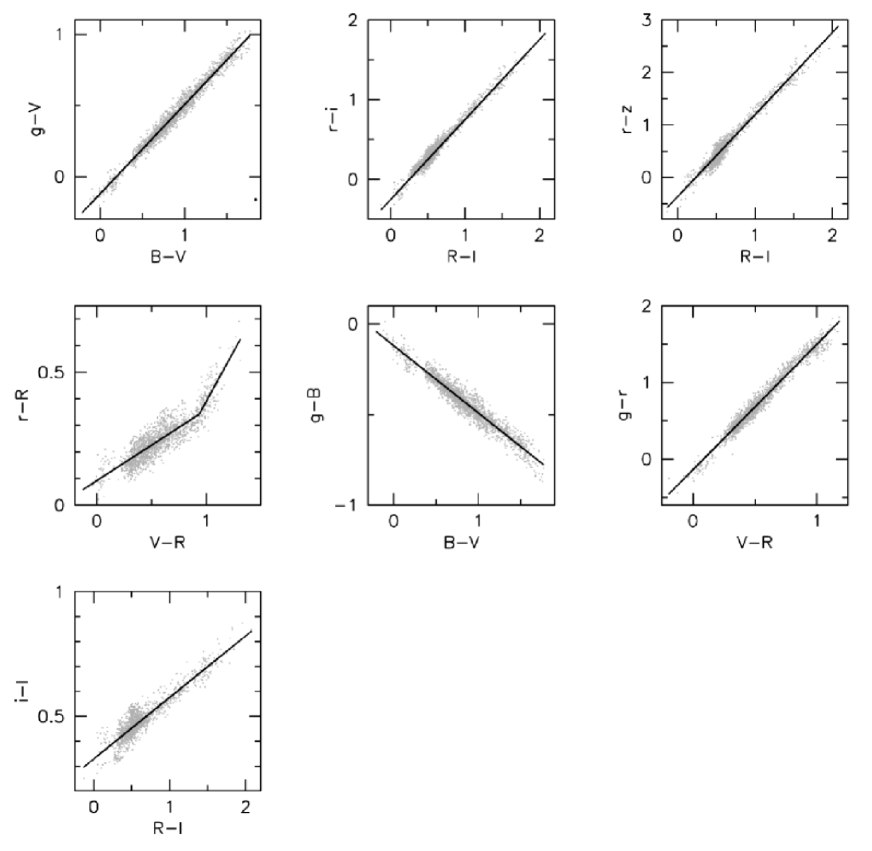
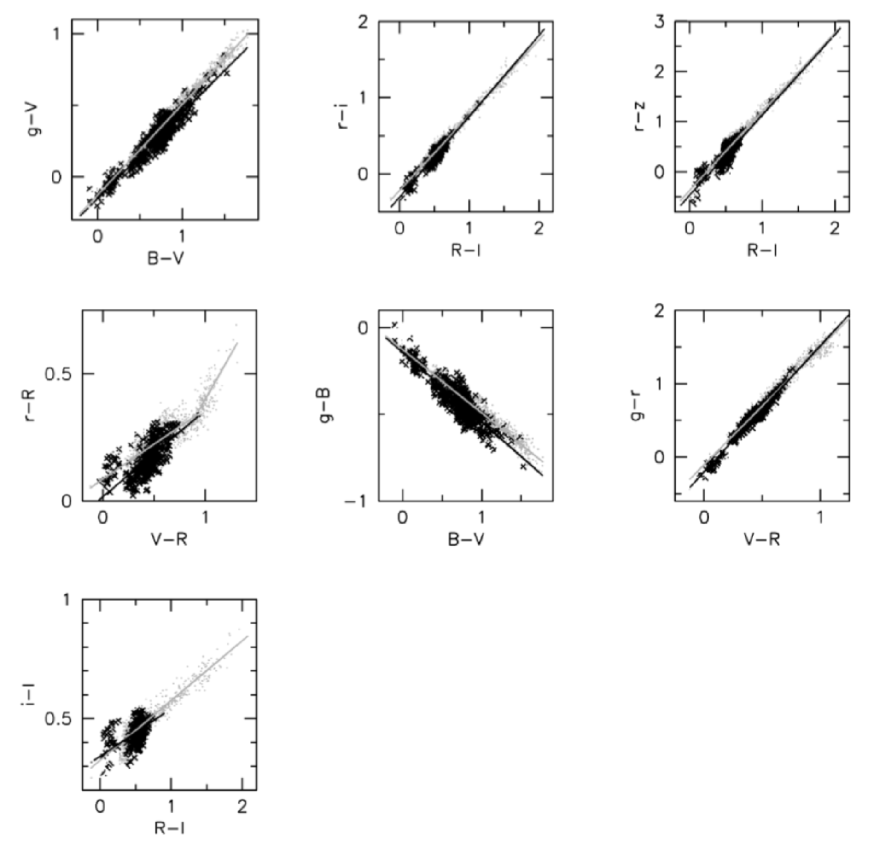
In Fig. 3 the colors specified on the left-hand side and on the right-hand side of our transformation equations are plotted against each other for all the stars used in each of the transformations. The resulting linear relations are plotted as solid lines. With the exception of the , transformation (equation 4), which exhibits a pronounced slope change (see also Fukugita et al. (1996)), the relations are linear to first order. In Table 3 the resulting coefficients for the ‘global’ transformations are listed.
| Color | Color Term | Zeropoint | Range |
|---|---|---|---|
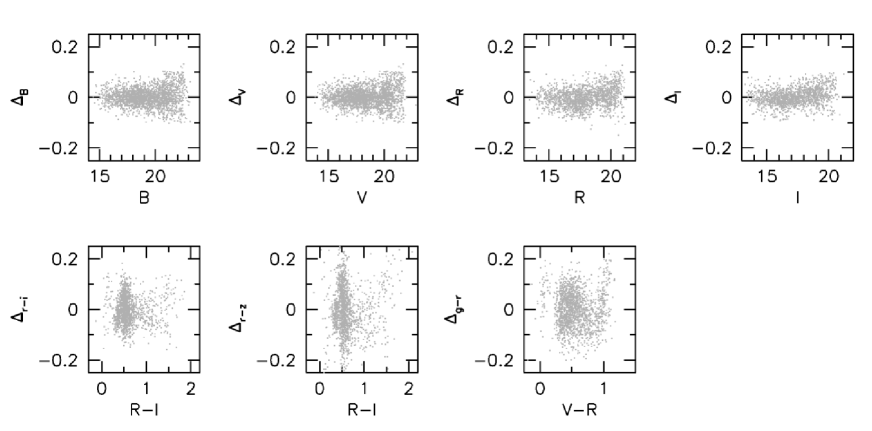
Here ‘global’ means that the entire star sample described above was used for the calculation without differentiating between potential Population I and Population II stars. The coefficients were calculated using least-squares minimization. The individual stars are weighted according to their formal photometric error. In Fig. 4 the deviations between the measured and the calculated magnitudes and colors are shown. The deviations get bigger for fainter magnitudes.
3.1.2 Metallicity-dependent transformations between BVRI and griz
The influence of metallicity on the transformation was investigated to the extent possible with the available standard star fields. One of the Stetson fields covers part of the Draco dwarf spheroidal galaxy. The majority of the stars from this Milky Way companion has a very low metallicity: Draco’s mean metallicity is [Fe/H] dex (Grebel et al. 2003). Moreover, Stetson and the SDSS provide photometry for the surroundings of the similarly metal-poor globular clusters NGC 2419 ( dex according to Harris (1996)) and NGC 7078 ( dex; Harris (1996)). Probable member stars of these three objects were selected based on their color-magnitude diagrams. This provides us with a metal-poor sample of ancient Population II stars. We may assume that the ages of the three old objects are comparable within the measurement accuracy (see also Grebel & Gallagher (2004)).
In contrast, the metallicity of the stars in Landolt’s equatorial fields is not known. We may assume that many of them belong to the Galactic disk, that Population I stars dominate, and that they have a range of metallicities. Presumably the metallicity of these stars is comparatively high and may reach values up to solar. Our old, metal-poor Population II subsample and our more metal-rich Population I subsample allow us to empirically assess a possible impact of metallicity on photometric transformations. Here our calculations involve only BVRI (equations 1 to 4 and 6 to 8). For equation 5, a distinction between metal-poor and metal-rich stars was not possible because of the lack of -band photometry. This is unfortunate since colors including or are particularly sensitive to stellar parameters including metallicity (see, e.g., Grebel & Roberts (1995); Lenz et al. (1998); Helmi et al. (2003)).
In Table 4 the resulting equations are listed. The resulting linear relations are plotted in Fig. 5. While the metal-rich stars are distributed fairly evenly across a wide range of colors, the metal-poor stars are concentrated within a fairly small range of colors corresponding mainly to the locus of the red giant branch. There are no metal-poor stars in our Population II sample with colors redder than . In the diagrams including the locus of the Population I stars is shifted towards somewhat bluer and colors as compared to the Population II stars. The coefficients of the linear transformation relations (solid lines in Fig. 5) result in slightly different slopes for metal-rich and metal-poor stars. At the main stellar locus, these deviations are less than the observed scatter in the colors of the stars in the two samples. Owing to the large scatter in the (),() and (),() diagrams, little can be said about possible trends here.
| Color | Color Term | Zeropoint | Validity |
|---|---|---|---|
| Population I | |||
| metal-poor Population II | |||
| Population I | |||
| metal-poor Population II | |||
| Population I | |||
| metal-poor Population II | |||
| Population I | |||
| metal-poor Population II | |||
| Population I | |||
| metal-poor Population II | |||
| Population I | |||
| metal-poor Population II |
3.1.3 Comparison between our transformations and earlier work
We compared our ‘global’ transformations with transformations published by Fukugita et al. (1996), Smith et al. (2002) and Karaali et al. (2005). Fukugita et al. (1996) used synthetic magnitudes from the spectrophotometric atlases of Gunn & Stryker (1983) and of Oke (1990) for their transformations. Smith et al. (2002) presented transformations based on actually measured magnitudes of 158 SDSS standard stars. Their measurements were not done with the 2.5-m SDSS telescope, but with the 1.0-m telescope at the US Naval Observatory, Flagstaff Station. Karaali et al. (2005) were the first to do transformations depending on two colors. For their transformations they used 251 stars of Landolt (1992) for the UBV data and data from the CASU INT Wide Field Survey measured in filters close to the SDSS ugr passbands. In Fig. 6 the color-color plots show our transformation relations, which are based directly on the 2.5-m SDSS data, in comparison with the previously published transformations listed above.
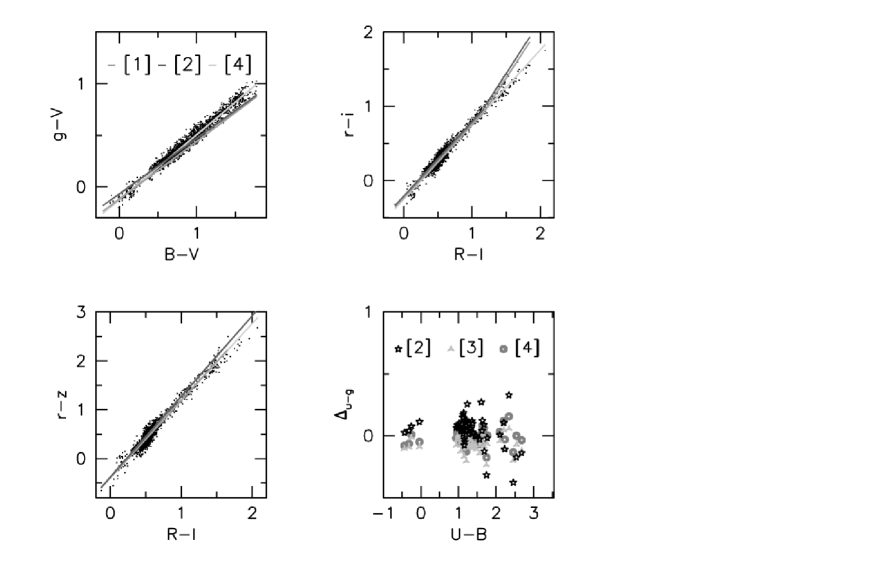
As Fig. 6 demonstrates, for the transformation (upper left panel and equation 1) the earlier transformations lie below our star distribution and have a slightly different slope. For the transformation in equation 2 (upper right panel) our data do not support a change of slope for red colors as suggested in the previous studies. The distribution gets broader for , and the Fukugita et al. (1996) and Smith et al. (2002) transformations represent the upper half of the distribution whereas our fit reproduces the average of the stellar locus. For equation 3 (lower left panel) the earlier studies and our work show close agreement. Transformations for (equation 5) were calculated by Smith et al. (2002), Karaali et al. (2005), and by us. Smith et al.’s equation differs from the others because it only depends on one color. The lower right diagram in Fig. 6 shows the deviation between the measured color and the calculated color. The one-color transformations by Smith et al. do not reproduce the colors of the combined Landolt and Stetson samples very well. The transformation by Karaali et al. resembles our result in spite of the somewhat different filter–telescope combinations.
3.2 Transformations between SDSS and RGU Photometry
For the transformation between the RGU system and the SDSS ugriz system we defined the following three equations:
| (9) | |||||
| (10) | |||||
| (11) |
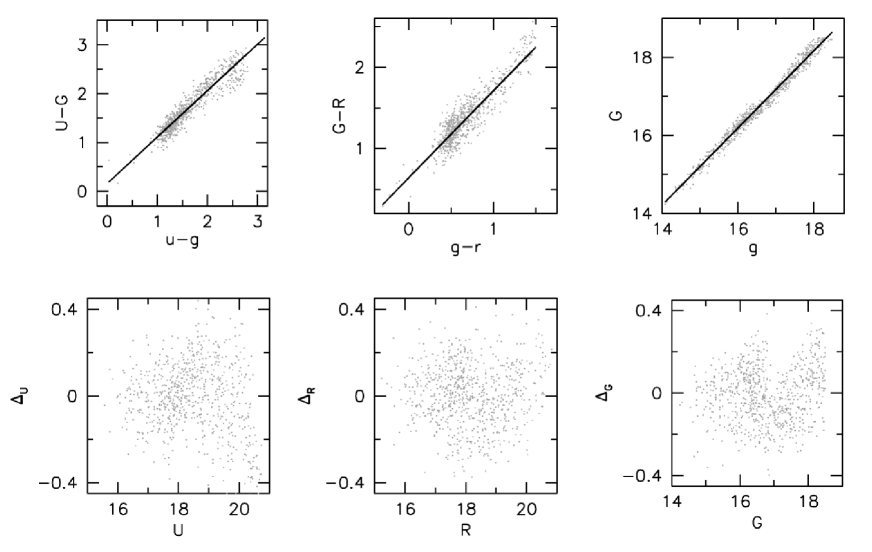
The stars of our SDSS–RGU sample show a relatively large scatter in the color planes. One of the reasons for the scatter is the lower photometric accuracy of the photographic data as compared to modern CCD data, namely typical internal uncertainties of , , and (Buser et al. 1998). Some of our 775 common stars lie far off the broad, mean stellar loci. Since the resolution of the photographic data is relatively low, these deviant points are most likely false matches or blends in the photographic photometry. We thus removed them from our sample before we calculated the transformation relations. For this set of transformations we used the same procedure as before. The coefficients are listed in Table 5.
| Color | Color Term | Zeropoint |
|---|---|---|
In Fig. 7 in the upper three panels the distribution of the stars in the color planes is shown, and the calculated transformations are plotted as straight lines. Given the larger scatter, it is not surprising that the uncertainties of the coefficients are now larger than for the UBVRI transformations. Moreover, the stellar data exhibit some wiggles, which we attribute to a nonlinear response of the photographic plates used in the Basel survey. Especially for the transformation the nonlinearity appears to be a problem. We investigated whether we could improve the transformation relations by making them dependent on two color terms instead of one, but this yielded no noticeable improvement.
4 Discussion
We presented empirical color transformations for the conversion of the SDSS ugriz photometric system into the Johnson-Cousins UBVRI system and into Becker’s RGU system, respectively. These are the first transformations between the SDSS and the Becker system, whereas several earlier transformations between variants of the SDSS and of the Johnson-Cousins system have been published. For the Johnson-Cousins conversions, the novelty of our approach lies in the use of actual SDSS data obtained with the 2.5-m SDSS telescope at Apache Point Observatory and the use of well-defined Johnson-Cousins standard stars taken from the lists of Landolt (1992) and Stetson (2000). For all transformations linear relations were found to be sufficient, with a slope change in transformations involving .
A comparison with previously published transformations shows that they qualitatively reproduce our transformations, but that they show systematic differences that may amount to mag. This is due to the fact that the earlier transformations were either done with data that used other filter–detector–telescope combinations than that of the actual 2.5-m SDSS telescope and therefore differ intrinsically from the actual SDSS data, or that the data are based on early versions of the SDSS photometry catalogs before the SDSS photometry was in its final form, or that non-standard Johnson-Cousins data were used.
For conversions between the SDSS and the Johnson-Cousins systems, we tested the transformations for a possible metallicity dependence. Some of the Stetson standard stars lie in a field centered on the Draco dwarf spheroidal galaxy or on metal-poor ( dex) globular clusters. Most of the stars in these fields are Population II stars and have much lower metallicities than the majority of the stars in Landolt’s equatorial standard fields, where Population I stars dominate. The latter sample necessarily comprises stars with a range of ages and abundances, while our Population II sample is essentially limited to very old and very metal-poor stars. The calculated coefficients for the metal-poor stars result in slightly different slopes as compared to the more metal-rich stars, which affect very blue and very red stars most. Although our metallicity differentiation is quite crude, there does seem to be a slight dependence of the transformations on the metallicity. A more accurate separation into metal-rich and metal-poor stars – ideally aided by spectroscopically measured stellar abundances – is needed to fully evaluate the magnitude of this trend.
Acknowledgements.
We acknowledge support by the Swiss National Science Foundation through grant 200020-105260 and 200020-105535. Funding for the SDSS and SDSS-II has been provided by the Alfred P. Sloan Foundation, the Participating Institutions, the National Science Foundation, the U.S. Department of Energy, the National Aeronautics and Space Administration, the Japanese Monbukagakusho, the Max Planck Society, and the Higher Education Funding Council for England. The SDSS Web Site is http://www.sdss.org/. The SDSS is managed by the Astrophysical Research Consortium for the Participating Institutions. The Participating Institutions are the American Museum of Natural History, Astrophysical Institute Potsdam, University of Basel, Cambridge University, Case Western Reserve University, University of Chicago, Drexel University, Fermilab, the Institute for Advanced Study, the Japan Participation Group, Johns Hopkins University, the Joint Institute for Nuclear Astrophysics, the Kavli Institute for Particle Astrophysics and Cosmology, the Korean Scientist Group, the Chinese Academy of Sciences (LAMOST), Los Alamos National Laboratory, the Max-Planck-Institute for Astronomy (MPIA), the Max-Planck-Institute for Astrophysics (MPA), New Mexico State University, Ohio State University, University of Pittsburgh, University of Portsmouth, Princeton University, the United States Naval Observatory, and the University of Washington. This research has made use of NASA’s Astrophysics Data System Bibliographic Services.References
- Abazajian et al. (2003) Abazajian, K., et al. 2003, AJ, 126, 2081
- Abazajian et al. (2004) Abazajian, K., et al. 2004, AJ, 128, 502
- Abazajian et al. (2005) Abazajian, K., et al. 2005, AJ, 129, 1755
- Adelman-McCarthy et al. (2006) Adelman-McCarthy, J. K., et al. 2006, ApJS, 162, 38
- Becker (1946) Becker, W. 1946, Veröffentlichungen der Universitäts-Sternwarte zu Göttingen, 5, 159
- Bell (1972) Bell, R. A. 1972, MNRAS, 159, 349
- Buser (1978a) Buser, R. 1978a, A&A, 62, 411
- Buser (1978b) Buser, R. 1978b, A&A, 62, 425
- Buser & Käser (1985) Buser, R. & Käser, U. 1985, A&A, 145, 1
- Buser & Fenkart (1990) Buser, R., & Fenkart, R. P. 1990, A&A, 239, 243
- Buser et al. (1998) Buser, R., Rong, J., & Karaali, S. 1998, A&A, 331, 934
- Buser et al. (1999) Buser, R., Rong, J., & Karaali, S. 1999, A&A, 348, 98
- Chen et al. (2001) Chen, B., et al. 2001, ApJ, 553, 184
- Cousins (1976) Cousins, A. W. J. 1976, MNASSA, 35, 70
- Epchtein et al. (1999) Epchtein, N., et al. 1999, A&A, 349, 236
- Fukugita et al. (1996) Fukugita, M., Ichikawa, T., Gunn, J. E., et al. 1996, AJ, 111, 1748
- Girardi et al. (2004) Girardi, L., Grebel, E. K., Odenkirchen, M. & Chiosi, C. 2004, A&A, 422, 205
- Grebel (2001) Grebel, E. K. 2001, Reviews of Modern Astronomy, 14, 223
- Grebel & Roberts (1995) Grebel, E. K., & Roberts, W. J. 1995, A&AS, 109, 293
- Grebel & Gallagher (2004) Grebel, E. K., & Gallagher, J. S., III 2004, ApJ, 610, L89
- Grebel et al. (2003) Grebel, E. K., Gallagher, J. S., III, & Harbeck, D. 2003, AJ, 125, 1926
- Gunn & Stryker (1983) Gunn, J. E. & Stryker, L. L. 1983, ApJS, 52, 121
- Gunn et al. (1998) Gunn, J. E., et al. 1998, AJ, 116, 3040
- Gunn et al. (2006) Gunn, J. E., et al. 2006, AJ, 131, 2332
- Harris (1996) Harris, W. E. 1996, AJ, 112, 1487
- Helmi et al. (2003) Helmi, A., et al. 2003, ApJ, 586, 195
- Johnson & Morgan (1953) Johnson, H. L. & Morgan, W. W. 1953, ApJ, 117, 313
- Juric et al. (2005) Juric, M., et al. 2005, submitted (astro-ph/0510520)
- Karaali et al. (2005) Karaali, S., Bilir, S., & Tunçel, S. 2005, PASA, 22, 24
- Koch et al. (2004a) Koch, A., Odenkirchen, M., Grebel, E. K., & Caldwell, J. A. R. 2004a, AN, 325, 299
- Koch et al. (2004b) Koch, A., Grebel, E. K., Odenkirchen, M., Martínez-Delgado, D., & Caldwell, J. A. R. 2004b, AJ, 128, 2274
- Landolt (1992) Landolt, A. U. 1992, AJ, 104, 340
- Lenz et al. (1998) Lenz, D. D., Newberg, J., Rosner, R., Richards, G. T., & Stoughton, C. 1998, ApJS, 119, 121
- Lupton et al. (2001) Lupton, R., Gunn, J. E., Ivezić, Z., Knapp, G. R., Kent, S., & Yasuda, N. 2001, in ASP Conf. Ser. 238, Astronomical Data Analysis Software and Systems X, eds. F. R. Harnden, Jr., F. A. Primini, and H. E. Payne (San Francisco: ASP), 269
- Odenkirchen et al. (2001) Odenkirchen, M., et al. 2001, AJ, 122, 2538
- Oke (1990) Oke, J. B. 1990, AJ, 99, 1621
- Rave et al. (2003) Rave, H. A., Zhao, C., Newberg, H. J., Yanny, B., Schneider, D. P., Brinkman, J., & Lamb, D. Q. 2003, ApJS, 145, 245
- Skrutskie et al. (2006) Skrutskie, M. F., et al. 2006, AJ, 131, 1163
- Smith et al. (2002) Smith, J. A., Tucker, D. L., Kent, S., et al. 2002, AJ, 123, 2121
- Stoughton et al. (2002) Stoughton, C., et al. 2002, AJ, 123, 485
- Steinlin (1968a) Steinlin, U. W. 1968a, in IAU Symp 50: Spectral Classification and Multicolour Photometry
- Steinlin (1968b) Steinlin, U. W. 1968b, Z. Astrophys. 69, 276
- Stetson (2000) Stetson, P. B. 2000, PASP, 112, 925
- Thuan & Gunn (1976) Thuan, T. X. & Gunn, J. E. 1976, PASP, 88, 543
- Udalski et al. (1998) Udalski, A., Szymanski, M., Kubiak, M., Pietrzynski, G., Wozniak, P., & Zebrun, K. 1998, AcA, 48, 147
- Udalski et al. (2000) Udalski, A., Szymanski, M., Kubiak, M., Pietrzynski, G., Soszynski, I., Wozniak, P., & Zebrun, K. 2000, AcA, 50, 307
- Udalski et al. (2002) Udalski, A., Szymanski, M., Kubiak, M., Pietrzynski, G., Soszynski, I., Wozniak, P., Zebrun, K., Szewczyk, O., & Wyrzykowski, L. 2002, AcA, 52, 217
- York et al. (2000) York, D. G., Adelman, J., Anderson, J. E., et al. 2000, AJ, 120, 1579
- Zaritsky et al. (2002) Zaritsky, D., Harris, J., Thompson, I. B., Grebel, E. K., & Massey, P. 2002, AJ, 123, 855
- Zaritsky et al. (2004) Zaritsky, D., Harris, J., Thompson, I. B., & Grebel, E. K. 2004, AJ, 128, 1606