RASS-SDSS Galaxy Cluster Survey.
To quantify the relationships between star formation in cluster galaxies and global cluster properties. Using a subsample of 79 nearby clusters from the RASS-SDSS galaxy cluster catalogue of Popesso et al. (2005a), we perform a regression analysis between the cluster integrated star formation rate () the cluster total stellar mass (), the fractions of star forming () and blue () galaxies and other cluster global properties, namely its richness (, i.e. the total number of cluster members within the cluster virial radius, corrected for incompleteness), velocity dispersion (), virial mass (), and X-ray luminosity (). All cluster global quantities are corrected for projection effects before the analysis. Galaxy s and stellar masses are taken from the catalog of Brinchmann et al. (2004), which is based on SDSS spectra. We only consider galaxies with in our analysis, and exclude AGNs. We find that both and are correlated with all the cluster global quantities. A partial correlation analysis show that all the correlations are induced by the fundamental one between and , hence there is no evidence that the cluster properties affect the mean or per galaxy. The relations between and , on one side, and both and , on the other side, are linear, i.e. we see no evidence that different clusters have different or different per galaxy and per unit mass. The fraction does not depend on any cluster property considered, while does depend on . We note that a significant fraction of star-forming cluster galaxies are red ( 25% of the whole cluster galaxy population). We conclude that the global cluster properties are unable to affect the properties of cluster galaxies, but the presence of the X-ray luminous intra-cluster medium can affect their colors, perhaps through the ram-pressure stripping mechanism.
1 Introduction
What role does the environment play in the evolution of cluster galaxies? The dependence of the morphological mix from the environmental conditions was qualitatively illustrated in the early study of the Virgo cluster by Hubble and Humason (1931) and has been confirmed in many studies (e.g. Oemler 1974; Dressler 1980; Postman & Geller 1984; Dressler et al. 1997). The clear observational evidence is that the high density regions, such as the massive galaxy clusters, are dominated by a quiescent early type galaxy population, while the late type star forming galaxies more likely populate low density regions such as the field. A recently proposed way to study the relation between galaxy population and environmental conditions is the analysis of the ongoing star formation (SF) in galaxies of different environments (see, e.g., Christlein & Zabludoff 2005). The SF rate (SFR) is an important measure of the evolutionary state of a galaxy, and a sensitive indicator of the environmental interactions. Previous studies of cluster galaxy SFRs have sometimes reached conflicting conclusions. The SFRs of cluster galaxies have been found to be reduced (Kennicutt 1983; Bicay and Giovanelli 1987; Kodaira et al. 1990; Moss & Whittle 1993; Abraham et al. 1996; Balogh et l. 1998, 2002; Koopmann & Kenney 1998; Hashimoto et al. 1998; Gavazzi et al. 2002; Pimbblet et al. 2006), comparable (Kennicutt et al. 1984; Donas et al. 1990; Gavazzi et al. 1991, 1998; Biviano et al. 1997; Moss & Whittle 2005), or in some case enhanced (Moss & Whittle 1993; Bennet & Moss 1998) relative to the SFRs of field galaxies of the same classes.
Several cluster-related environmental processes can affect the SFRs of galaxies. Some processes mainly affect the gaseous content of a galaxy, such as the ram-pressure stripping (Gunn & Gott 1972; Kenney et al. 2004; van Gorkom 2004), re-accretion of the stripped gas (Vollmer et al. 2001), turbulence and viscosity (e.q. Quilis et al. 2001), and starvation/strangulation (Larson et al. 1980). Gravitational processes, which affect both the gaseous and the stellar properties of a galaxy, range from low-velocity tidal interactions and mergers (e.g. Mamon 1996; Barnes & Hernquist 1996; Conselice 2006), to high-velocity interactions between galaxies and/or clusters (Moore et al. 1998, 1999; Struck 1999; Mihos 2004). Despite a number of recent studies of nearby and distant clusters, it is not yet clear which of these processes, if any, are dominant.
Clues on the relative importance of the cluster-related environmental processes can be obtained by investigating the evolution of the star-forming properties of cluster galaxies. In this context, the most important evolutionary phenomenon is the Butcher-Oemler (BO hereafter) effect (Butcher & Oemler 1978, 1984), i.e. the increasing fraction of blue cluster members with redshift. The BO effect has been confirmed and detailed by many studies since the original works of Butcher & Oemler (e.g. Ellingson et al. 2001; Margoniner et al. 2001; Alexov et al. 2003; De Propris et al. 2003; Rakos and Shombert 2005), although Andreon et al. (2004, 2006) have argued that no cluster-dependent evolution is required to explain the BO effect, which is entirely compatible with the normal color evolution of galaxies in an ageing universe. The BO-effect is purely photometrical. The spectroscopic version of the BO-effect is an excess of emission-line and star-forming galaxies in distant, relative to nearby, clusters, first suggested by Dressler & Gunn (1982) and later confirmed by several authors (e.g. Postman et al. 1998, 2001; Dressler et al. 1999; Finn et al. 2004, 2005; Homeier et al. 2005; Poggianti et al. 2006, P06 hereafter)
Most of the analyses so far have concentrated on the comparison of the star-forming properties of individual cluster galaxies with those of field galaxies, and on the variation of the galaxy SFRs on the local density of their environment. However, it is also important to assess the dependence (if any) of the star-forming properties of cluster galaxies on their cluster global properties, such as the mass, velocity dispersion and X-ray luminosity. Should the SFRs of cluster galaxies depend on global properties of their host cluster, results obtained for different individual clusters would not be straightforward to compare, thereby producing apparently discrepant results. Moreover, the relative efficiency of the different evolutionary processes depends on several cluster properties, and investigating the SFRs of cluster galaxies as a function of these properties can help understanding this issue (see, e.g., Pimbblet 2003). Also the evolution of the star forming properties of cluster galaxies must be studied in close connection with the evolution of their host cluster properties. In fact, evolutionary studies of cluster galaxy SFRs may be affected by selection biases if the SFRs depend on global cluster properties, such as their masses. Since in flux-limited surveys more massive clusters are preferentially selected with increasing redshift, a biased estimate of the evolution of the star-forming properties of cluster galaxies may result (see, e.g., Newberry et al. 1998; Andreon & Ettori 1999),
Recently, several studies have addressed the dependence of the star-forming properties of cluster galaxies on their host global properties. Several studies have found that the cluster global properties do not affect the star-forming properties of cluster galaxies. In particular, no dependence has been found of either the blue or the late-type galaxy fraction in clusters on cluster velocity dispersions (s) and masses (Goto 2005), nor of the blue fraction with cluster richness, concentration, and degree of subclustering (De Propris et al. 2004). On the other hand, both Margoniner et al. (2001) and Goto et al. (2003) had previously found a dependence of the blue or late-type galaxy fractions on the cluster richness. Goto (2005) has also claimed no dependence on the cluster s and masses of either the total cluster SFR or of the total cluster SFR normalized by the cluster mass, in disagreement with Finn et al. (2005) who have shown that the integrated SFR per cluster mass decreases with increasing cluster mass. Lea & Henry (1988), Fairley et al. (2002), and Wake et al. (2005) have all failed to find any dependence of the fraction of blue cluster galaxies with the cluster X-ray luminosity, . Similarly, Balogh et al. (2002) have compared the galaxy SFRs in high- and low- clusters and have found no differences. In the sample of Homeier et al. (2005) there are hints of correlations between the total cluster SFRs and cluster s and intra-cluster gas temperatures, s, but the trends are not really significant. Most recently, P06 have found that the fraction of emission-line galaxies (ELGs hereafter) decreases with increasing cluster . The trend is continuous at high-, but is characterized by a break at –600 km s-1 in nearby clusters, where the relation they find is consistent with the results obtained by Biviano et al. (1997).
In this paper we re-address the issue of the dependence of the SFR and the fraction of star forming galaxies on the cluster global properties. At variance with most previous studies, we consider both optical and X-ray cluster global properties, namely the mass, , and . While these quantities are correlated (Popesso et al. 2005a, Paper III of this series), it is worthwhile to consider them all, since the star-forming properties of cluster galaxies may show a stronger dependence on one of these properties, thereby pointing to a different physical mechanism affecting their SFRs. E.g., Postman et al. (2005) have recently shown that the fraction of early-type galaxies in distant clusters does depend on , but not on , nor on . In our analysis we use a sample of 79 low-redshift clusters taken from the X-ray selected RASS-SDSS galaxy cluster catalog (Popesso et al. 2004, Paper I) and the optically selected Abell cluster sample (Popesso et al. 2006a, Paper V). Besides providing further constraints on the mechanisms of galaxy evolution in clusters, our investigation should be useful for assessing the possible selection effects in the comparison of the star-forming properties of galaxies in nearby vs. distant clusters, as well as in clusters at similar redshifts but with different global properties.
In Sect. 2 of the paper we describe our dataset. In Sect. 3 we analyze the relation between the cluster integrated star formation rate and the global properties of the systems. In Sect. 5 we apply the same analysis to the fraction of blue cluster galaxies and the fraction of cluster star forming galaxies. Sect. 7 contains our conclusions.
Throughout this paper, we use km s-1 Mpc-1 in a flat cosmology with and (e.g. Tegmark et al. 2004).
2 The data
The optical data used in this paper are taken from the Sloan Digital Sky Survey (SDSS, Fukugita et al. 1996, Gunn et al. 1998, Lupton et al. 1999, York et al. 2000, Hogg et al. 2001, Eisenstein et al. 2001, Smith et al. 2002, Strauss et al. 2002, Stoughton et al. 2002, Blanton et al. 2003 and Abazajian et al. 2003). The SDSS consists of an imaging survey of steradians of the northern sky in the five passbands in the entire optical range. The imaging survey is taken in drift-scan mode. The imaging data are processed with a photometric pipeline (PHOTO, Lupton et al. 2001) specially written for the SDSS data. For each cluster we defined a photometric galaxy catalog as described in Section 3 of Paper I (see also Yasuda et al. 2001). For the analysis in this paper we use only SDSS Model magnitudes.
The spectroscopic component of the survey is carried out using two fiber-fed double spectrographs, covering the wavelength range 3800–9200 Å, over 4098 pixels. They have a resolution varying between 1850 and 2200, and together they are fed by 640 fibers, each with an entrance diameter of 3 arcsec. The fibers are manually plugged into plates inserted into the focal plane; the mapping of fibers to plates is carried out by a tiling algorithm (Blanton et al. 2003) that optimizes observing efficiency in the presence of large-scale structure.
The X-ray data are taken from the ROSAT All Sky Survey. The RASS was conducted mainly during the first half year of the ROSAT mission in 1990 and 1991 (Trümper 1988). The ROSAT mirror system and the Position Sensitive Proportional counter (PSPC) operating in the soft X-ray regime (0.1-2.4 keV) provided optimal conditions for the studies of celestial objects with low surface brightness. In particular, due to the unlimited field of view of the RASS and the low background of the PSPC, the properties of nearby clusters of galaxies can be ideally investigated.
2.1 The cluster sample
In this paper we use a combined sample of X-ray selected galaxy clusters and optically selected systems. The X-ray selected clusters are taken from the RASS-SDSS galaxy cluster catalog of paper III, and the optically selected clusters are taken from the sample of Abell clusters spectroscopically confirmed using SDSS DR3 data of Paper V. Of these clusters, we only consider those with available X-ray center, in order to minimize possible centering errors. There is partial overlap between the X-ray and optical samples. In Paper V we have recently compared the properties and scaling relations of optically- and X-ray selected clusters. We have found no difference among the two samples, except for a larger scatter of the -mass relation when derived on the optically-selected clusters rather than on the X-ray selected ones (see Paper V for details). We can thus safely combine the two samples together in the present analysis.
We have determined the cluster membership by studying the redshifts distribution of the galaxies in the cluster region (see next section for details). In order to analyze the SFR and the blue fraction of galaxies in the same magnitude range for all the clusters, we have selected only those clusters for which the limiting magnitude of the SDSS spectroscopic catalog, , corresponds to an an absolute magnitude limit fainter than (and hence to a redshift limit ). This magnitude is about 0.7 mag fainter than the value of of the Schechter (1976) function that provides the best-fit to the RASS-SDSS clusters luminosity function (Popesso et al. 2006b, Paper IV). Among these clusters, we finally select only those containing at least 5 cluster members brighter than in the -band. Note that the s and masses of these clusters are estimated using all cluster members, irrespectively of their magnitude, and hence are generally based on at least 10 cluster members. Studying clusters extracted from cosmological simulations, Biviano et al. (2006) have recently shown that 10 cluster members are sufficient to obtain an unbiased estimate of a cluster . The final catalog contains 79 clusters, spanning a large mass range (–).
2.2 Cluster masses, velocity dispersions and X-ray luminosities
We here provide a summary of the methods by which we measure the cluster global properties, s, masses, and s. Full details can be found in paper III and IV.
We define the cluster membership of a galaxy on the basis of its location in the projected phase-space diagram, velocity with respect to the cluster mean vs. clustercentric distance. Specifically, we combine the methods of Girardi et al. (1993) and Katgert et al. (2004). Using the cluster members, the virial analysis (see, e.g., Girardi et al. 1998) is then performed on the clusters with at least 10 member galaxies. The line-of-sight velocity dispersion is computed in the cluster rest-frame (Harrison 1974) using the biweight estimator (Beers et al. 1990). By multiplying it by a factor we obtain the 3D . The virial masses, are corrected for the surface pressure term (The & White 1986) and estimated at the virial radius, , using an iterative procedure. Namely, we start by using Carlberg et al.’s 1997 definition as a first guess, then extrapolate or interpolate the virial mass estimate obtained within the observational aperture to using a Navarro et al. (1997) mass profile. This mass estimate is used to obtain a new estimate of and the virial mass is finally re-estimated by extrapolating or interpolating the observed value to the new estimate of (see Biviano et al. 2006 for a thorough description of our procedure).
Cluster s are calculated from RASS data using the growth curve analysis method (Böhringer et al. 2000). This method is optimized for the detection of the extended emission of clusters by assessing the plateau of the background subtracted cumulative count rate curve. The X-ray luminosity estimate we adopt corresponds to the total flux inside the radius , corrected for the missing flux by using a standard -model for the X-ray surface brightness (see Böhringer et al. 2000 for more details). The correction is typically only .
2.3 Galaxy Star Formation Rates
We take the SFR-estimates for our cluster members from Brinchmann et al. (2004, hereafter, B04). In addition to SFRs, we also take from B04 the SFRs normalized to the stellar masses, . They provide mainly -derived SFR, based on SDSS spectra, for all the SDSS DR2 spectroscopic catalog. B04 divided their galaxy sample in three subsamples on the basis of the Baldwin et al. (1981) vs. diagram. B04 distinguish the following galaxy categories: star-forming galaxies, composite galaxies, AGNs, and unclassifiable objects. For all the star-forming galaxies and the unclassifiable objects the SFR is calculated directly from the emission lines (see B04 for details).
B04 provide three estimators of the galaxy SFR, the median, the mode and the average of the likelihood distribution. Since the average and the mode of the distribution are somewhat binning sensitive, we adopt the median of the distribution as our SFR estimator. B04’s SFRs are derived from spectra taken within the 3 arcsec diameter fibers of the SDSS, which generally sample only a fraction of the total galaxy light. B04 correct their SFRs for these aperture effects (see B04 for details), and we adopt their corrected (total) SFRs. We have checked that our results do not change when instead of the median we use the mode, and when instead of the corrected SFRs we use the uncorrected ones.


2.4 Cluster Star Formation Rates
In order to estimate the integrated cluster SFRs we first sum up the SFRs of their cluster members, AGNs and composite-spectrum galaxies excluded. I.e. we consider all the galaxies classified star-forming by B04, as well as the unclassifiable objects. The unclassifiable objects among our cluster members have extremely low SFR (as estimated by B04) and their summed contribution to the cluster integrated SFR is not significant.
Since our spectroscopic sample is not complete down to the chosen magnitude limit, we need to multiply the sum of the cluster member SFRs by an incompleteness correction factor. In order to estimate the incompleteness correction for each cluster we compare the number of cluster spectroscopic members, , within and with , with the corresponding number of cluster galaxies estimated from the photometric data, , since the photometric sample is complete for . In order to estimate we first estimate the density of foreground and background galaxies from the counts of galaxies in an annulus outside the virialized area (at radii ) centered on the cluster center. We then subtract the number of background galaxies expected in the cluster area from the number of galaxies (down to the same magnitude limit) in the cluster region. In Fig. 1 we show the number ratios of spectroscopic and photometric members as a function of . 80% of our clusters have a completeness level higher than 80%. We calculate the incompleteness correction factor as the maximum between and 1.
Another correction we need to apply to the sum of cluster member SFRs is the de-projection correction since the global cluster quantities we want to compare the integrated SFR with, are all de-projected quantities. When we sum up the SFRs of cluster members with a clustercentric projected distance , we include the contribution of galaxies outside the virial sphere, but within the cylinder of same radius. In Fig. 2 we shows the relation between the integrated SFR within and . Because of the strict proportionality between these two quantities, and because the relation is linear within the errors (see Table 2), we can estimate the de-projection correction for the number of cluster members, and apply the same correction to the integrated SFR. In order to estimate the de-projection correction for , we build the number density profiles of our clusters, and fit them with the King (1962) cored profile, and the NFW cuspy profile (Navarro et al. 1997). We then de-project these profiles, and take the ratio between the integrals from the center to of the de-projected and the projected profiles. This ratio provides the correction factor.
The number density profiles of our clusters are built by stacking together our clusters after rescaling their galaxy clustercentric distances by their cluster s (see also Popesso et al. 2006c, Paper VII, where we perform the same analysis). We use the SDSS -band photometric data down to the completeness limit , and consider a common absolute magnitude limit of for all our clusters. The cluster galaxy distributions are normalized to the total number of galaxies within , after subtraction of the mean background galaxy density, evaluated within the annulus. We split our sample of clusters in 6 mass bins (, , , ,, and ) and determine the number density profile for each of these subsamples. Each bin contains at least 10 clusters. We find that the number density profiles become steeper near the center as the cluster mass increases. This is true independently for the red and blue cluster members ( and, respectively, , see Strateva et al. 2001), so this is not an effect due to the population of cluster galaxies, but it is a mass-related effect. More massive clusters have more centrally concentrated galaxy distributions. The best fit parameters of the King profiles for different cluster mass bins and galaxy populations are listed in Table 1. In Fig. 3 we show the number density profiles in the lowest and highest mass bins for the whole (left panel), the red (central panel) and the blue (right panel) cluster galaxy populations.
Since the galaxy number density profiles depend on the mass of the cluster, also the de-projection corrections are mass dependent. In Table 1 we list the correction factors determined for each mass bin by using the best-fit King profiles for the whole cluster population. We apply these mass-dependent de-projection correction factors to the integrated SFRs. In the following, refers to the incompleteness- and de-projection-corrected values of the integrated SFRs within a sphere of radius .
| The whole cluster galaxy population | ||||||
| 0.400.08 | ||||||
| cf | 0.72 | 0.79 | 0.81 | 0.81 | 0.85 | 0.85 |
| The red galaxy population (u-r 2.22) | ||||||
| 0.370.03 | ||||||
| The blue galaxy population (u-r 2.22) | ||||||
| 1.030.13 | ||||||
| A | B | |||||
|---|---|---|---|---|---|---|
| 1.08 0.08 | -0.32 0.12 | 0.13 | 0.84 | |||
| 1.11 0.10 | -15.36 1.57 | 0.20 | 0.74 | |||
| 2.18 0.23 | -4.96 0.62 | 0.15 | 0.76 | |||
| 0.62 0.09 | 1.62 0.07 | 0.27 | 0.46 | |||
| -0.67 0.19 | -11.63 0.54 | 0.24 | -0.30 | |||
| 1.09 0.06 | -11.77 0.73 | 0.12 | 0.80 | |||
| 1.01 0.07 | 10.86 0.07 | 0.07 | 0.85 | |||
| 1.08 0.09 | -3.50 1.12 | 0.16 | 0.75 | |||
| 2.31 0.23 | 5.55 0.63 | 0.09 | 0.84 | |||
| 0.61 0.06 | 12.47 0.04 | 0.25 | 0.49 | |||
| -0.13 0.04 | 0.91 0.04 | 0.19 | -0.41 | |||
| -0.19 0.05 | 0.78 0.04 | 0.22 | -0.41 |
3 The dependence of the cluster on the cluster global properties.
In order to analyse the relation between and we perform an orthogonal linear regression in the logarithmic space, using the software package ODRPACK (Akritas Bershady 1996). We find a significant correlation between these two quantities (as quantified by the Spearman correlation coefficient, see Table 2). The slope of the relation is consistent with unity (see Table 2, ). Fig. 4 shows the relation. Note that the slope of the relation would have been found to be significantly smaller than unity, had we not applied the de-projection correction to .


is also significantly correlated with . The best-fit parameters of the regression line are listed in Table 2.
To check the robustness of our results we have re-analyzed the and relations by considering in turn only the clusters with more than 20, 30 and 40 cluster members. The correlations remain significant, and the values of the best-fit parameters of the regression lines are consistent, within errors, with those obtained when considering the whole cluster sample.
The correlation between and is less well defined than in the previous cases due to the larger scatter, but the correlation is very significant also in this case (see Fig. 5 and Table 2). The large scatter is at least partially due to the Abell X-ray-Underluminous (AXU) clusters (see Fig.5). These systems are similar to the normal X-ray emitting clusters in all their optically-derived properties but are generally X-ray underluminous for their mass and optical luminosity (see paper V for further details).
The significant correlations between and the cluster global quantities may not all be independent from one another. In fact, , , and are all correlated quantities (see, e.g., Paper III). They are also correlated with (see Paper VII), as it is (see Fig. 2, and Table 2 – note that the same de-projection correction applies to both and , so the relation between the two quantities does not vary after applying this correction). We perform a multiple regression analysis (e.g. Flury & Riedwyl 1988; see also Biviano et al. 1991 for another application of the method in an astrophysical context) to try to understand which (if any) of these correlations is the most fundamental one. We take as the dependent variable and consider , , , and as independent variables (regressors). We then adopt the method of backward elimination (Flury & Riedwyl 1988) in order to identify the fundamental regressors for the dependent variable . Namely, we compute the coefficient of determination, , using all regressors first, then eliminate each regressor one at a time and look at the variation in . The regressor giving the smallest contribution to is eliminated, and we proceed until only one regressor is left. When fundamental regressors are eliminated, is substantially reduced.
We find that the only fundamental regressor of is . I.e., depends on (but also on and ) only because the more massive a cluster, the larger its number of cluster galaxies and, proportionally, of star-forming galaxies.
Not only is the fundamental regressor of , the relation between the two quantities is linear. This may come as a surprise if clusters of different richness contain different fraction of star-forming galaxies within their virial radius. However, this is not seen in our cluster sample (see Sect. 5). Since the vs. is linear (see Table 2), the mean SFR of cluster galaxies is constant (and equal to 0.470.13 ). This is illustrated in Fig. 6, where we show vs. (upper panel) and the distribution among our clusters. No significant relation is found between and (nor in fact between and either , or ). The scatter in the distribution is at least partly due to the uncertainties in the incompleteness correction factors (see Sect. 2.4).
In lieu of normalizing by the number of cluster members, for the sake of comparison with other works in the literature, we also normalize it by the cluster mass, . As expected from the vs. relation, there is no significant trend of with , i.e. is constant111Note that we would have obtained a significant anti-correlation of with cluster mass, had we not applied the de-projection correction.. Similarly, there is no correlation between and . The evidence for a significant anti-correlation of with (see Table 2) is somewhat surprising, given that the slopes of the regression lines between and , on the one side, and , on the other side, are consistent with each-other ( and , respectively, see Table 2 and paper III). We note, however, that the slope of the relation is still consistent within with the value inferred from the and relations.
We conclude that the increase of as a function of the cluster mass is due to the proportionality between and and that the mean SFR per galaxy or per unit mass is nearly constant throughout our cluster sample, except perhaps for a residual dependence on the cluster velocity dispersion.
4 The total cluster stellar mass vs. the cluster global properties.
We have performed a similar analysis as that described in the previous Section using the total cluster stellar mass, , in lieu of . is computed by summing up the stellar mass of all the cluster spectroscopic members within and with (we use the median values of the stellar masses in the B04 catalog). As for , we correct for the incompleteness and for the projection effects (see Sect. 2.4). As shown by the results listed in Table 2, the cluster is proportional to . As a consequence, the slopes of the relations of , , , and with are all consistent with those of the corresponding relations of these quantities with . A multiple regression analysis shows that, also in this case, the fundamental regressor of is .


5 The fractions of blue and star-forming galaxies vs. the cluster global properties.
We analyze the relations between the fractions of blue () and star-forming () galaxies in clusters with the cluster global properties. We define as the ratio between the number of spectroscopic cluster members with (see Strateva et al. 2001), and the number of all spectroscopic cluster members, within . We do not need to apply an incompleteness correction here, since we find that the blue and the whole cluster galaxy populations have similar incompleteness levels for , within the statistical uncertainties, as shown in Fig. 7 (the incompleteness are estimated as in Sect. 2.4, but taking into account the color cuts). We do not apply the de-projection correction either, since the de-projection correction factor for the blue galaxies is very uncertain and in any case consistent with that for the whole population.
The correlations of with , , and are not significant. On the other hand, there is a significant anti-correlation of with (see Table 2 and Fig. 8).
The vs. relation deserves a closer look. Another way of looking at it is through the use of the fractional contribution of blue galaxies to , . is anti-correlated with (see Fig. 9), and the slopes of the and relations are consistent within the errors ( see Table 2).
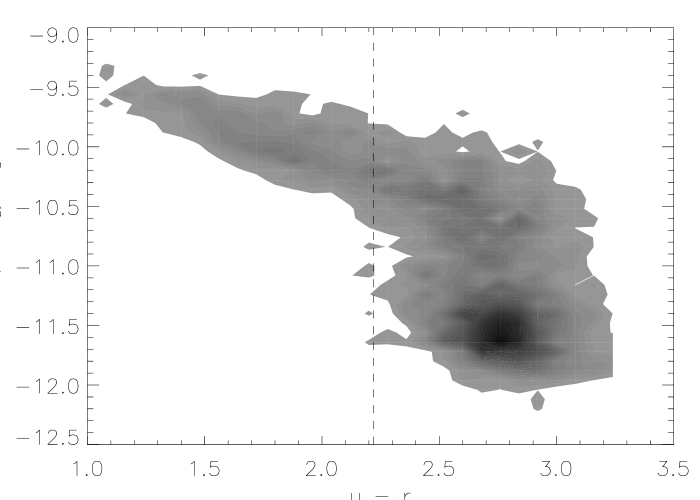
The color cut of Strateva et al. (2001) is used to separate blue from red galaxies, but not all the star-forming galaxies are bluer than . Fig. 10 shows the in a sample of 2680 cluster galaxies versus the color . The dashed line in the plot is the color cut of Strateva et al. (2001) at . In addition to the usual populations of star-forming blue galaxies and of no star-forming (quiescent) red galaxies, there is a third population of red, star-forming red galaxies at . Hence, the color cut by itself does not distinguish between star-forming and quiescent galaxies. For this we need a cut in , that we set at . We then define as the fractional number of galaxies with mass normalized SFR above this limit. There is no significant correlation of with any cluster global quantity, , , , and . Thus, while is anti-correlated with , is not. This is due to the inclusion of the red star-forming galaxies in the sample. In fact, the fraction of red star-forming galaxies do not correlate with any of the global cluster properties, not even , and among the star-forming galaxies the red ones outnumber the blue ones. This can be seen in Fig. 11: the median fractions of blue star-forming, red star-forming, and red quiescent galaxies are , and .

6 Discussion
Our results show that the cluster global properties (, , ) do not influence the SF properties of cluster galaxies. While does increase with increasing cluster , and , all these trends can be totally explained as a richness effect, . The more galaxies in a cluster, the larger its mass, and the higher its number of star-forming galaxies. Since the relation between and is linear, the average cluster SFR is essentially constant throughout our cluster sample. Consistently, we do not find any dependence of with any cluster global property. We do however find a residual correlation of the mass normalized integrated SFR, with , and a significant anti-correlation of with .
Also the total stellar mass, , depends linearly on , i.e. the average stellar mass per cluster galaxy does not depend on cluster properties. This is consistent with the universality of the shape of the cluster luminosity function found in Paper IV. It suggests that not only the average current star formation but also the average history of star formation in clusters is independent on the cluster properties .
How do our results compare with previous findings? The lack of correlations we find between and , , and confirm previous negative results by Goto (2005) and De Propris et al. (2004) but disagree with the claimed trend of with cluster richness (Margoniner et al. 2001; Goto et al. 2003). We agree with Goto (2005) that there is no dependence of on , but, at variance with his findings, we do find a correlation between and , as well as between and either or , in broad agreement with the tentative correlations found by Homeier et al. (2005).
Our results disagree with those of Finn et al. (2005), since, unlike them, we do not find that the integrated SFR per cluster mass decreases with increasing cluster mass. Our results disagree also with those of Lin et al. (2003), since they find , while we find a linear relation between and , meaning that the fraction of mass in form of stars, , is constant among different clusters. Remarkably, however, our result would have been consistent with both Finn et al.’s and Lin et al.’s had we also neglected to apply the mass-dependent de-projection correction to and (see Sect. 2.4) as they did.
The anti-correlation we find between and is in disagreement with previous claims of no correlations by Lea & Henry (1988), Fairley et al. (2002), and Wake et al. (2005). Such a correlation, as well as the lack of correlation between and other cluster global quantities, is however consistent with the result of Postman et al. (2005). Postman et al. have recently shown that the fraction of early-type galaxies in distant clusters increases with , but does not depend on either , or . We actually checked that the fraction of red, rather than blue, galaxies in our clusters does show a relation with which is consistent (within 2 s) with the relation found by Postman et al. for their distant cluster sample.
The lack of correlation we find between and confirms the results of Balogh et al. (2002), but the lack of correlation we find between and is in disagreement with the recent findings of P06. In their nearby cluster sample, they find a decreasing fraction of ELGs with increasing for km s-1.
It is difficult to explore in detail the reasons for all the apparent discrepancies among different results. One important issue is the de-projection correction that we have introduced (see Sect. 2.4) and that has not been applied before. Another important issue is the limiting absolute magnitudes adopted in different studies. Yet another relevant point could be the difference among different cluster samples, since different samples span different redshift and mass ranges, and none of the samples studied so far can be claimed to be a volume-complete sample down to a given cluster mass limit. Since there is a significant overlap of the sample with P06, and we both use data from the SDSS, we deem nevertheless worthwhile to investigate further the reason why our results are in disagreement.
We first compared the values for the s of 22 clusters in common. P06’s and our values are very nicely correlated, and obey a regression relation with a slope close to unity (although their values are systematically higher than ours by km s-1). The result discrepancy must origin in the different definition of the fraction of star-forming galaxies. P06 define the star-forming galaxies as those cluster members with a [OII] emission-line with equivalent width (EW) smaller than Å. For the sake of comparison we show in Fig. 12 the relation between the fraction of ELGs (with EW smaller than Å) and in our sample. At variance with P06 we do exclude AGNs and composite-spectra galaxies from our sample. There is no significant correlation, no trend is evident. Including AGNs in our sample we instead recover the trend found by P06. Hence we conclude that the trend reported by P06 is due to their including AGNs among the star-forming galaxies. We will pursue the investigation of this topic in a forthcoming paper (Popesso & Biviano 2006).
Two relations that we find cannot be simply explained by the linear relation between and . These are the observed decrease of with increasing , and the observed decrease of with . The fact that does not correlate with excludes the possibility that the anti-correlation reflects a dependence of the fraction of blue galaxies on cluster mass, as suggested by Postman et al. (2005). As a matter of fact, is not a very good proxy for the cluster mass (Reiprich & Böhringer 2002; Paper III). The anti-correlation may be telling us more about the cluster and galaxy formation processes than about the cluster evolution process. A possible physical mechanism that could be responsible for this anti-correlation is ram-pressure stripping (Gunn & Gott 1972). The ram -pressure force is proportional to , where is the density of the IC diffuse gas, and also is proportional to . If ram-pressure stripping is indeed responsible for the – anti-correlation, its strength should depend on the clustercentric radius. Unfortunately our data are not sufficient to test such a dependence.
The fact that the same anti-correlation is seen in high- clusters (Postman et al. 2005) would argue for little evolution in the properties of the IC gas out to , if ram-pressure stripping is really the main process at work. Timescale is not a problem, since ram-pressure stripping is a rapid process (Vollmer et al. 2001). Because of the proportionality with , ram-pressure stripping is also our best candidate for explaining the anti-correlation of with .
Although models of galaxy evolution in clusters tend to assign little importance to the ram-pressure stripping mechanism (e.g. Okamoto & Nagashima 2003; Lanzoni et al. 2005), direct evidence for ongoing ram-pressure stripping in cluster galaxies exist (e.g. Gavazzi et al. 2003; Kenney et al. 2004). Ram-pressure is thought to induce gas stripping from cluster galaxies, thereby reddening their colors. However, the stripped gas can eventually fall back into the aged galaxy, producing a short and mild burst of SF (Vollmer et al. 2001; Fujita 2004), and this could explain why we observe an anti-correlation between and but not between and .
As a matter of fact, differs from because of the presence of a red star-forming cluster galaxy population making up a significant portion of the cluster star forming members, on average 25% of the whole cluster galaxy population. The red colors () of these galaxies suggest that they are dominated by an old stellar population, unless there is a significant amount of dust extinction. The spectra of our red star-forming cluster galaxies are similar to those of early-type spirals (Sa–Sb). Evidence for such a population of red star-forming galaxies has already been found in other studies (Demarco et al. 2005; Homeier et al. 2005; Jørgensen et al. 2005; Tran et al. 2005a, 2005b; Weinmann et al. 2006). Their spectra are characterized as (Franx 1993) with [OII] or H (Miller et al. 2002) in emission. Their morphologies are disklike (Tran et al. 2003), and their concentrations are intermediate between those of the blue star-forming and of those of the red and passive populations (Weinmann et al. 2006).
We can interpret these red star-forming galaxies as objects in the process of accomplishing their transformation from late- to early-type galaxies. This transformation process may be identified by the ram-pressure stripping because of the above mentioned correlations. Another process able to induce bursts of SF in otherwise quiescent galaxies is the merger of two quiescent galaxies. While the process could occur in distant, low- clusters (Tran et al. 2005b), it is very unlikely to be effective in nearby ones (e.g. Mamon 1996). Fast encounters between galaxies in clusters rather produce the ’harassment’ mechanism described by Moore et al. (1996, 1998).
Recently, these red star-forming galaxies have also been found outside clusters. According to Franzetti et al. (2006), –40% of all the red field galaxies have ongoing SF. This fraction is comparable, if not higher, than the fraction we observe in our sample of nearby clusters, and suggest that we do not actually need a cluster-related phenomenon to explain the presence of red star-forming galaxies. Perhaps these galaxies are simply more dusty than the blue star-forming galaxies (e.g. Tran et al. 2005a). Red-sequence mid-infrared emitters, with significant levels of inferred SF, have indeed already been detected in some clusters (Miller et al. 2002; Biviano et al. 2004; Coia et al. 2005).
In conclusion, we feel that a more detailed analysis of the morphology of the red star-forming systems and a careful study of their properties within and outside the cluster environment, are mandatory for understanding their nature.
7 Conclusion
We have analyzed the relationships between SF in cluster galaxies and global cluster properties, such as cluster , , , and . For our analysis we have used a sample of 79 nearby clusters extracted from the RASS-SDSS galaxy cluster catalogue of Paper III and Paper V. Galaxy s and stellar masses are taken from the catalog of Brinchmann et al. (2004), which is based on SDSS spectra. We only consider galaxies with in our analysis, and exclude AGNs and composite-spectra galaxies.
All the cluster quantities considered are corrected for incompleteness, when needed, and for projection effects. The de-projection correction is of particular importance in our analysis, since we find that it depends on the cluster mass.
is correlated with all the cluster global quantities mentioned above. By performing a multiple regression analysis that the main correlation is that between and . Since this relation is linear the average SFR of cluster galaxies is the same in different clusters, and is unaffected by either the cluster mass, or its velocity dispersion, or its X-ray luminosity. We come to essentially the same conclusion when is considered in lieu of . If instead of normalizing with we normalize it with , we still find does not depend on any cluster global property, except , which we suggest could be evidence of the effect of ram-pressure stripping on the cluster galaxy properties.
Ram-pressure could also be the mechanism able to explain the observed anti-correlation of with , since is not correlated with either or with . On the other hand, the fact that we do not observe any correlation between and is due to the presence of a dominant fraction of red star-forming galaxies. They could also be the result of the ram-pressure mechanism, or, in alternative, they could be star-forming galaxies with an anomalous amount of dust.
If global cluster properties affect the star-forming properties of cluster galaxies, their effect is rather marginal, except perhaps on galaxy colors, which seem to be influenced by the presence of the IC diffuse gas.
We thank the anonymous referee for useful suggestions which helped us improving the quality of this paper. Funding for the creation and distribution of the SDSS Archive has been provided by the Alfred P. Sloan Foundation, the Participating Institutions, the National Aeronautics and Space Administration, the National Science Foundation, the U.S. Department of Energy, the Japanese Monbukagakusho, and the Max Planck Society. The SDSS Web site is http://www.sdss.org/. The SDSS is managed by the Astrophysical Research Consortium (ARC) for the Participating Institutions. The Participating Institutions are The University of Chicago, Fermilab, the Institute for Advanced Study, the Japan Participation Group, The Johns Hopkins University, Los Alamos National Laboratory, the Max-Planck-Institute for Astronomy (MPIA), the Max-Planck-Institute for Astrophysics (MPA), New Mexico State University, University of Pittsburgh, Princeton University, the United States Naval Observatory, and the University of Washington.
References
- Abazajian et al. (2003) Abazajian, K., Adelman, J., Agueros, M.,et al. 2003, AJ, 126, 2081 (Data Release One)
- Abraham et al. (1996) Abraham, R.G., Smecker-Hane, T. A., Hutchings, J.B., et al. 1996, ApJ, 471, 694
- Akritas & Bershady (1996) Akritas, M.G., & Bershady, M.A. 1996, ApJ, 470, 706
- Alexov et al. (2003) lexov, A., Silva, D.R., & Pierce, M.J. 2003, AJ, 126, 2644
- Andreon & Ettori (1999) Andreon, S. & Ettori, S. 1999, ApJ, 516, 647
- Andreon et al. (2004) Andreon, S., Lobo, C., & Iovino, A. 2004, MNRAS, 349, 889
- Andreon et al. (2006) Andreon, S., Quintana, H., Tajer, M., Galaz, G., & Surdej, J. 2006, MNRAS, 365, 915
- Baldwin et al. (1981) Baldwin, J.A., Phillips, M.M., & Terlevich, R. 1981, PASP, 93, 5
- Balogh et al. (1998) Balogh, M.L., Shade, D., Morris, S., et al. 1998, ApJ, 504, 75
- Balogh et al. (2002) Balogh, M., Bower, R.G., Smail, I., et al. 2002, MNRAS, 337, 256
- Barnes & Hernquist (1996) Barnes, J.E., & Hernquist, L. 1996, ApJ, 471, 115
- Beers et al. (1990) Beers, T.C., Flynn,K., & Gebhardt 1990, AJ, 100, 32
- Bennett & Moss (1998) Bennett, S.M. & Moss, C. 1998, A&A, 132, 55
- Bicay et al. (1987) Bicay, M.D. & Giovanelli, R. 1987, ApJ, 321, 645
- Biviano et al. (1997) Biviano, A., Katgert, P., Mazure, A., et al. 1997, A&A, 321, 84
- Biviano et al. (2004) Biviano, A., et al. 2004, A&A, 425, 33
- Biviano et al. (2006) Biviano, A., Murante, G., Borgani, S., et al. 2006, A&A, accepted (astro-ph/0605151)
- Blanton et al. (2003) Blanton, M.R., Lupton, R.H., Maley, F.M. et al. 2003, AJ, 125, 2276
- Böringer et al. (2000) Böhringer, H., Voges, W., Huchra, J.P. et al. 2000, ApJS, 129, 435
- Brinchmann et al. (2004) Brinchmann, J., White, S.D.M., Tremonti, C., Kauffmann, G., Heckman, T., Brinkmann, J. 2004, MNRAS, 351, 1151
- Butcher & Oemler (1978) Butcher H. & Oemler A.Jr. 1978, ApJ, 226, 559
- Butcher & Oemler (1984) Butcher H. & Oemler A.Jr. 1984, ApJ, 285, 426
- Carlberg et al. (1997) Carlberg, R.G., Yee, H.K.C., & Ellingson, E. 1997, ApJ, 478, 462
- Christlein & Zabludoff (2005) Christlein, D., & Zabludoff, A.I. 2005, ApJ, 621, 201
- Coia et al. (2005) Coia, D., et al. 2005, A&A, 431, 433
- Conselice (2006) Conselice, C.J. 2006, ApJ, 638, 686
- Demarco et al. (2005) Demarco, R., Blakeslee, J.P., Ford, H.C., et al. 2005, astro-ph/0509575
- De Propris et al. (2003) De Propris, R., Stanford, S.A., Eisenhardt, P.R., & Dickinson, M. 2003, ApJ, 598, 20
- De Propris et al. (2004) De Propris, R., Colless, M., Peacock, J.A. et al. 2004, MNRAS, 351, 125
- Donas et al. (1990) Donas, J., Buat, V., Milliard, B. et al. 1990, A&A, 235, 60
- Dressler (1980) Dressler, A., 1980, ApJ, 236, 351
- Dressler & Gunn (1982) Dressler, A., & Gunn, J.E. 1982, ApJ, 263, 563
- Dressler et al. (1997) Dressler, A., Oemler, A., Couch, W.J., et al. 1997, ApJ, 490, 577
- Dressler et al. (1999) Dressler, A., Smail, I., Poggianti, B.M. et al. 1999, ApJS, 122, 51
- Eisenstein et al. (2001) Eisenstein, D.J., Annis, J., Gunn, J.E., et al. 2001, AJ, 122, 2267
- Ellingson et al. (2001) Ellingson, E., Lin, H., Yee, H.K.C., & Carlberg, R.G. 2001, ApJ, 547, 609
- Fairley et al. (2002) Fairley, B.W., Jones, L.R., Wake, D.A. et al. 2002, MNRAS, 330, 755
- Finn et al. (2004) Finn R.A., Zaritsky D., & McCarthy D.W.Jr. 2004, ApJ, 604, 141
- Finn et al. (2005) Finn, R.A., Zaritsky, D., McCarthy, D.W., et al. 2005, ApJ, 630, 206
- Franx (1993) Franx, M. 1993, ApJ, 407, L5
- Franzetti et al. (2006) Franzetti et al. 2006, astro-ph/0607075
- Fujita (2004) Fujita, Y. 2004, PASJ, 56, 29
- Fukugita et al. (1996) Fukugita, M., Ichikawa, T., Gunn, J. E. 1996, AJ, 111, 1748
- Gavazzi et al. (1991) Gavazzi, G., Boselli, A., Kennicutt, R. et al. 1991, AJ. 101, 1207
- Gavazzi et al. (1998) Gavazzi, G., Catinella, B., Carrasco, L. et al. 1998, AJ, 115, 1745
- Gavazzi et al. (2002) Gavazzi, G., Boselli, A., Pedotti, P. et al. 2002, A&A. 396, 449
- Gavazzi et al. (2003) Gavazzi, G., Cortese, L., Boselli, A., et al. 2003, ApJ, 597, 210
- Girardi et al. (1993) Girardi, M., Biviano, A., Giuricin, G. et al. 1993, ApJ, 404, 38
- Girardi et al. (1998) Girardi, M., Giuricin, G., Mardirossian, F., Mezzetti, M., & Boschin, W. 1998, ApJ, 505, 74
- Goto (2005) Goto, T. 2005, MNRAS, 356, L6
- Goto et al. (2003) Goto, T., Okamura S., Yagi, M. et al. 2003, PASJ, 55 739
- Gunn & Gott (1972) Gunn, J.E., & Gott, J. 1972, ApJ, 176, 1
- Gunn et al. (1998) Gunn, J.E., Carr, M.A., Rockosi, C.M., et al. 1998, AJ, 116, 3040
- Harrison (1974) Harrison, E.R. 1974, ApJ, 191, L51
- Hashimoto et al. (1998) Hashimoto Y., Oemler A.Jr., Lin H., & Tucker D.L. 1998, ApJ, 499, 589
- Hogg et al. (2001) Hogg, D.W., Finkbeiner, D. P., Schlegel, D. J., Gunn, J. E. 2001, AJ, 122, 2129
- Homeier et al. (2005) Homeier, N.L., Demarco, R., Rosati, P., et al. 2005, ApJ, 621, 651
- Hubble et al. (1931) Hubble, E. & Humason, M.L. 1931, ApJ, 74, 43
- Jørgensen et al. (2005) Jørgensen, I., Bergmann, M., Davies, et al. 2005, AJ, 129, 1249
- Katgert et al. (2004) Katgert, P., Biviano, A., & Mazure, A. 2004, ApJ, 600, 657
- Kenney et al. (2004) Kenney, J.D.P., van Gorkom, J.H., & Vollmer, B. 2004, AJ, 127, 3361
- Kennicut (1983) Kennicutt, R.C., 1983, AJ, 88, 483
- Kennicutt et al. (1984) Kennicutt, R.C., Bothun, G.D., & Schommer, R.A. 1984, AJ, 89, 179
- King (1962) ing, I. 1962, AJ, 67, 471
- Kodaira et al. (1990) Kodaira, K., Watanabe, T., Onaka, T. et al. 1990, ApJ, 363, 422
- Koopmann & Kenney (1998) Koopmann, R. A. & Kenney, J.D.P. 1998, ApJ, 497, L75
- Lanzoni et al. (2005) Lanzoni, B., Guiderdoni, B., Mamon, G.A., Devriendt, J., & Hatton, S. 2005, MNRAS, 361, 369
- Larson et al. (1980) Larson, R. B., Tinsley, B. M., & Caldwell, C. N. 1980, ApJ, 237, 692
- Lea & Henry (1988) Lea, S.M., & Henry, J.P. 1988, ApJ, 332, 81
- Lin et al. (2003) Lin, Y.-T., Mohr, J.J., & Stanford, S.A. 2003, ApJ, 591, 749
- Lupton et al. (2001) Lupton, R., Gunn, J. E., Ivezić, Z., et al. 2001, in ASP Conf. Ser. 238, Astronomical Data Analysis Software and Systems X, ed. F. R. Harnden, Jr., F. A. Primini, and H. E. Payne (San Francisco: Astr. Soc. Pac.), p. 269 (astro-ph/0101420)
- Lupton et al. (1999) Lupton, R. H., Gunn, J. E., Szalay, A. S. 1999, AJ, 118, 1406
- Mamon (1996) amon, G. A. 1996, in The Dynamics of Groups and Clusters of Galaxies and Links to Cosmology, ed. H. de Vega & N. Sanchez (Singapore: World Scientific), 95
- Margoniner et al. (2001) Margoniner, V.E., de Carvalho, R.R., Gal, R.R., et al. 2001, ApJ, 548, L143
- Mihos (2004) Mihos, J. C. 2004, in Clusters of Galaxies: Probes of Cosmological Structure and Galaxy Evolution, ed. J. S. Mulchaey, A. Dressler, & A. Oemler (Cambridge: Cambridge Univ. Press), 278
- Miller et al. (2002) Miller, N.A., & Owen, F.N. 2002, AJ, 124, 2453
- Moore et al. (1996) Moore B., Katz N., Lake G., Dressler A., & Oemler A.Jr. 1996 Nature 379, 613
- Moore et al. (1998) Moore, B., Lake, G., & Katz, N. 1998, ApJ, 495, 139
- Moore et al. (1999) Moore, B., Lake, G., Quinn, T., & Stadel, J. 1999, MNRAS, 304, 465
- Moss & Whittle (1993) Moss, C. & Whittle, M. 1993, ApJ, 407, L17
- Moss & Whittle (2005) Moss, C., & Whittle, M. 2005, MNRAS, 357, 1337
- Navarro et al. (1997) Navarro, J. F., Frenk, C. S., & White, S. D.M. 1997, ApJ, 490, 493
- Newberry et al. (1988) Newberry M.V., Kirshner R.P., & Boroson T.A. 1988, ApJ 335, 629
- Oemler (1974) Oemler, A. Jr. 1974, ApJ, 194, 1
- Okamoto & Nagashima (2003) Okamoto, T., & Nagashima, M. 2003, ApJ, 587, 500
- Pimbblet (2003) Pimbblet, K.A. 2003, PASA, 20, 294
- Pimbblet et al. (2006) Pimbblet, K.A., Smail, I., Edge, A.C. et al. 2006, MNRAS, 366, 645
- Poggianti et al. (2006) Poggianti, B.M., von der Linden, A., De Lucia, G., et al. 2006, ApJ, 642, 188 (P06)
- Popesso & Biviano (2006) Popesso, P., & Biviano, A., A&A, submitted
- Popesso et al. (2004) Popesso, P., Böhringer, H., Brinkmann J., Voges W., & York, D. G. 2004, A&A, 423, 449 (Paper I)
- Popesso et al. (2005a) Popesso, P., A. Biviano, Böhringer, H., Romaniello, M., & Voges, W. 2005a, A&A, 433, 431 (Paper III)
- Popesso et al. (2006b) Popesso, P., A. Biviano, Böhringer, H., & Romaniello, M. 2006b, A&A, 445, 29 (Paper IV)
- Popesso et al. (2006a) Popesso, P., A. Biviano, Böhringer, H., & Romaniello, M. 2006a, A&A in press (Paper V; astro-ph/0606191)
- Popesso et al. (2006c) Popesso, P., A. Biviano, Böhringer, H., & Romaniello, M. 2006c, A&A in press (Paper VII, astro-ph/0606260)
- Postman & Geller et al. (1984) Postman, M. & Geller, M.J. 1984, ApJ, 281, 95
- Postman et al. (1998) Postman, M., Lubin, L.M., & Oke, J.B. 1998, AJ, 116, 560
- Postman et al. (2001) Postman, M. , Lubin, L.M., & Oke, J.B. 2001, AJ, 122, 1125
- Postman et al. (2005) Postman, M., Franx, M., Cross, N.J.C., et al. 2005, ApJ, 623, 721
- Quilis et al. (2000) uilis, V., Moore, B., & Bower, R. 2000, Science, 288, 5471
- Rakos & Schombert (2005) Rakos, K., & Schombert, J. 2005, AJ, 130, 1002
- Reiprich & Böhringer (2002) Reiprich, T.H., & Böhringer, H. 2002, ApJ, 567, 716
- Schechter (1976) chechter, P. 1976, ApJ, 203, 297
- Smith at al. (2002) Smith, J.A., Tucker, D.L., Kent, S.M., et al. 2002, AJ, 123, 2121
- Stoughton et al. (2002) Stoughton, C., Lupton, R.H., Bernardi, M., et al. 2002, AJ, 123, 485
- Strateva et al. (2001) Strateva, I., Ivezic, Z., Knapp, G. et al. 2001 AJ, 122, 1861
- Strauss et al. (2002) Strauss, M. A., M.A., Weinberg, D.H., Lupton, R.H. et al. 2002, AJ, 124, 1810
- Struck (1999) Struck, C. 1999, Phys. Rep., 321, 1
- Tegmark et al. (2004) Tegmark, M., Strauss, M., Blanton, M. et al. 2004, PhRvD, 69, 103501
- The & White (1986) The, L. S., White, S. D. M. 1986, AJ, 92, 1248
- Tran et al. (2003) Tran, K.-V. H., Simard, L., Illingworth, G., & Franx, M. 2003, ApJ, 590, 238
- Tran et al. (2005a) Tran, K.-V. H., van Dokkum, P., Illingworth, G.D., et al. 2005a, ApJ, 619, 134
- Tran et al. (2005b) Tran, K.-V. H., van Dokkum, P., Franx, M., et al. 2005b, ApJ, 627, L25
- Trümper (1988) Trümper J. 1988, Hot Thin Plasmas in Astrophysics, Proceedings of a NATO Advanced Study Institute, held at Cargese, Corsica, September 8-18, 1987, Dordrecht: Kluwer, 1988, edited by R. Pallavicini. NATO Advanced Science Institutes (ASI) Series C, Volume 249, p.355
- van Gorkom et al. (2004) van Gorkom, J. H. 2004, in Clusters of Galaxies: Probes of Cosmological Structure and Galaxy Evolution, eds. J. S. Mulchaey, A. Dressler, & A. Oemler (Cambridge: Cambridge Univ. Press), 306
- Vollmer et al. (2001) Vollmer, B., Cayatte, V., & Balkowski, C. 2001, ApJ, 561, 708
- Wake et al. (2005) Wake, D.A., Collins, C.A., Nichol, R.C., Jones, L.R., & Burke, D.J. 2005, ApJ, 627, 186
- Weinmann et al. (2006) Weinmann, S.M., van den Bosch, F.C., Yang, X., & Mo, H.J. 2006, MNRAS, 366, 2
- Yasuda et al. (2001) Yasuda, N., Fukugita, M. Narayanan, V. K. et al. 2001, AJ, 122, 1104
- York et al. (2000) York, D. G., Adelman, J., Anderson, J.E., et al. 2000, AJ, 120, 1579