The ACS Virgo Cluster Survey. XIV. Analysis of Color-Magnitude Relations in Globular Cluster Systems11affiliation: Based on observations with the NASA/ESA Hubble Space Telescope obtained at the Space Telescope Science Institute, which is operated by the association of Universities for Research in Astronomy, Inc., under NASA contract NAS 5-26555.
Abstract
We examine the correlation between globular cluster (GC) color and magnitude using HST/ACS imaging for a sample of 79 early-type galaxies ( mag) with accurate surface-brightness fluctuation distances from the ACS Virgo Cluster Survey. Using the KMM mixture modeling algorithm, we find a highly significant correlation, , between color and magnitude for the subpopulation of blue GCs in the co-added GC color-magnitude diagram of the three brightest Virgo cluster galaxies (M49, M87 and M60). The sense of the correlation is such that brighter GCs are redder than their fainter counterparts. For the single GC systems of M87 and M60, we find similar correlations; M49 does not appear to show a significant trend. There is no correlation between and for GCs belonging to the red subpopulation. The correlation for the blue subpopulation is much weaker than . Using Monte Carlo simulations, we attribute this finding to the fact that the blue subpopulation in extends to higher luminosities than does the red subpopulation, which biases the KMM fit results. The highly significant correlation between color and , however, is a real effect: this conclusion is supported by biweight fits to the same color distributions. We identify two environmental dependencies which influence the derived color-magnitude relation: (1) the slope of the color-magnitude relation decreases in significance with decreasing galaxy luminosity, although it remains detectable over the full luminosity range of our sample; and (2) the slope is stronger for GC populations located at smaller galactocentric distances. These characteristics suggest that the observed trend is, at least partially, shaped by external agents. We examine several physical mechanisms that might give rise to the observed color-magnitude relation including: (1) presence of contaminants like super-clusters, stripped galactic nuclei, or ultra-compact dwarfs; (2) accretion of GCs from low-mass galaxies; (3) stochastic effects; (4) the capture of field stars by individual GCs; and (5) GC self-enrichment. Although none of these scenarios offers a fully satisfactory explanation of the observations, we conclude that self-enrichment and field-star capture, or a combination of these processes, offer the most promising means of explaining our observations.
Subject headings:
galaxies: clusters: individual: Virgo – galaxies: dwarf – galaxies: fundamental parameters – galaxies: nuclei – globular clusters: general1. Introduction
It is by now an accepted paradigm that the formation of globular clusters (GCs) is closely linked to the formation of their host galaxies (e.g. Searle & Zinn 1978, Ashman & Zepf 1992, Kissler-Patig 1997, Hilker et al. 1999b, Forbes et al. 1997, Côté et al. 1998, Beasley et al. 2002). In recent years, observational data for extragalactic GC systems have made a huge leap forward in quality, thanks mainly to high-resolution imaging from the Hubble Space telescope, and to wide field imaging and multi-object spectroscopy from 8m-class ground based telescopes (see West et al. 2004 and references therein).
As a rule, studies of extragalactic GCs have tended to focus on correlations between the global photometric properties of the GC systems (GCSs) and those of their host galaxy. For instance, Peng et al. Peng05, examined the color distributions for GCs belonging to 100 galaxies observed in the ACS Virgo Cluster Survey (ACSVCS; Côté et al. 2004; see also below), finding nearly all of these galaxies ( mag) to possess bimodal, or at least asymmetric, GC color distributions. Consistent with previous findings (e.g., Gebhardt & Kissler-Patig 1999; Kundu et al. 2001; Larsen et al. 2001), the mean GC color was found to correlate with galaxy luminosity in the same sense as the well-known color-magnitude relation for early type galaxies (e.g. Bower, Lucey & Ellis 1992; Karick et al. 2003; Hilker et al. 2003; Ferrarese et al. 2006). A corresponding GC color - galaxy color relation was also found by Peng et al. Peng05, confirming previous findings (e.g., Burgarella et al. 2001; Larsen et al. 2001; Lotz et al. 2004).
At the same time, analyses of the color magnitude diagrams for the GCSs of early-type galaxies revealed some tentative evidence for a dependence of individual GC color on luminosity. Ostrov et al. Ostrov98 found from Washington photometry of NGC 1399 that the color peaks of the GC color distribution seem to merge at the highest luminosities. Dirsch et al. Dirsch03 confirmed this finding for the same galaxy based on an expanded sample of GCs. There have also been hints of such a behavior in other galaxies such as NGC 5128 (Harris et al. 2004) and M87 (Whitmore et al. 1995; Larsen et al. 2001).
With the improved imaging capabilities of HST provided by the Advanced Camera for Surveys (ACS; Ford et al. 1998), it has become possible to investigate this issue in more detail. Harris et al. Harris06 used ACS imaging to investigate the distribution of GCs in the color magnitude plane for eight brightest cluster galaxies in the range km s. For the four galaxies with the largest number of GCs — and also the joint sample of eight GC systems — they found a significant trend towards redder colors for increasing luminosity for the subpopulation of blue GCs. This finding led them to suggest a mass-metallicity relation of the form for this subpopulation. Curiously, no color-magnitude relation was found for the red GCs.
Strader et al. Strade05 used the publicly available data from the ACSVCS to look for color-magnitude trends in the three brightest Virgo Cluster galaxies M49, M87 and M60. For the blue GC populations of M87 and M60, they found a significant trend of redder color with brighter GC -band luminosity similar to that found by Harris et al. Harris06. They too interpreted this trend as evidence for a mass-metallicity relation among the blue (metal-poor) GCs and suggested self-enrichment as a possible explanation. No significant color-magnitude trend was found for M49, the brightest member of the Virgo Cluster.
Both the Harris et al. Harris06 and Strader et al. Strade05 studies used heteroscedastic mixture models to fit the colors of an assumed double-Gaussian color distribution to the observed GC color-magnitude diagrams (CMDs) as a function of magnitude. Harris et al. use KMM (e.g. Ashman, Bird & Zepf 1994), while Strader et al. use Nmix (Richardson & Green 1997). Two important issues that were not addressed by these studies are the subject of this paper: first, we will investigate the color-magnitude correlations not only in the red (i.e., ), but also in the blue band (i.e., ); second, we will investigate how the blue peak slope varies as a function of host galaxy luminosity and galactocentric distance. Note that the Harris et al. Harris06 study targeted only brightest cluster galaxies, so it spanned a relatively limited range in galaxy luminosity.
We finally point out that there is recent evidence for the existence of a GC color-magnitude relation also in spiral galaxies. Based on ACS imaging, Spitler et al. Spitle06 found a significant color-magnitude trend for the Sombrero galaxy (NGC 4594) implying , which is a somewhat weaker trend than suggested by Harris et al. Harris06 and Strader et al. Strade05 for giant ellipticals.
The aim of this paper is to investigate the color-magnitude trend of GCs over the entire host galaxy luminosity range covered by the ACSVCS. Special emphasis will be put on environmental dependencies of this trend and checks of the fitting technique. The paper is structured as follows: In §2 we outline how GC candidates are selected in the ACSVCS. In §3 we compare KMM fits to simulated CMDs with fits to observed CMDs. In §LABEL:environment we investigate the environmental dependence of the color-magnitude trend. In §LABEL:discussion we examine a variety of physical effects that may create these trends. We finish this paper with the summary and conclusions in §LABEL:conclusions.
2. Selection of Globular Clusters from the ACSVCS
The ACSVCS represents the most complete and homogeneous study of extragalactic GCs performed to date. The sample consists of 100 early-type (E, S0, dE, dE,N, dS0) members of the Virgo cluster. Each galaxy was imaged in the F475W and F850LP filters ( and , respectively) for a total of 750 seconds and 1210 seconds, respectively. This filter combination gives roughly a factor-of-two improvement in wavelength baseline and metallicity sensitivity compared to the “canonical” color index. The identification of bona-fide GCs from these images is performed in the size-magnitude plane as described in Peng et al. Peng05. This selection procedure — which is possible because the half-light radii of GCs are marginally resolved (Jordán et al. Jordan05a) at the distance of Virgo ( Mpc; Tonry et al. Tonry01; Mei et al. Mei05) — greatly reduces contamination from foreground stars and background galaxies.
The ACS images had been reduced using a dedicated pipeline described in detail by Jordán et al. (2004ab; Papers II and III). In brief, the reduction steps are: image combination, galaxy modeling and model subtraction, rejection of obvious background galaxies, and the measurement of magnitudes and sizes for candidate GCs using the program KINGPHOT (Jordán et al. 2005; Paper X). The result is a catalog of integrated and magnitudes, colors and half-light radii, , for each candidate GC. Magnitudes and colors are corrected for foreground extinction using the reddening maps of Schlegel et al. Schleg98.
To estimate the contamination by background galaxies, an identical reduction procedure was applied to 17 blank high-latitude fields observed by ACS in the and filters. Because background galaxies are typically larger at comparable luminosities (or, conversely, fainter at comparable sizes), a statistical decontamination is performed in size-magnitude space (see Peng et al. 2006 and Jordán et al. 2006, in prep. for details): to this end, first a non-parametric density model is fitted to the size-magnitude distribution of sources detected in background fields. For the GC candidate magnitude distribution, a Gaussian luminosity function is assumed. The GC candidate size distribution is fitted by a non-parametric kernel estimate plus a power law tail. The resulting surface densities in the size-magnitude plane for background sources and GCs then make it possible to assign a GC probability, , to every source detected in the galaxy image. All candidates with probabilities are considered GCs. The remaining contamination by background galaxies that are assigned is negligible for the sake of this study. We have tested this by statistically cleaning the GC CMDs for each galaxy, using the color-magnitude distribution of sources with in the 17 blank background fields.
3. Analysis of the Color Magnitude Diagrams
3.1. Results from KMM
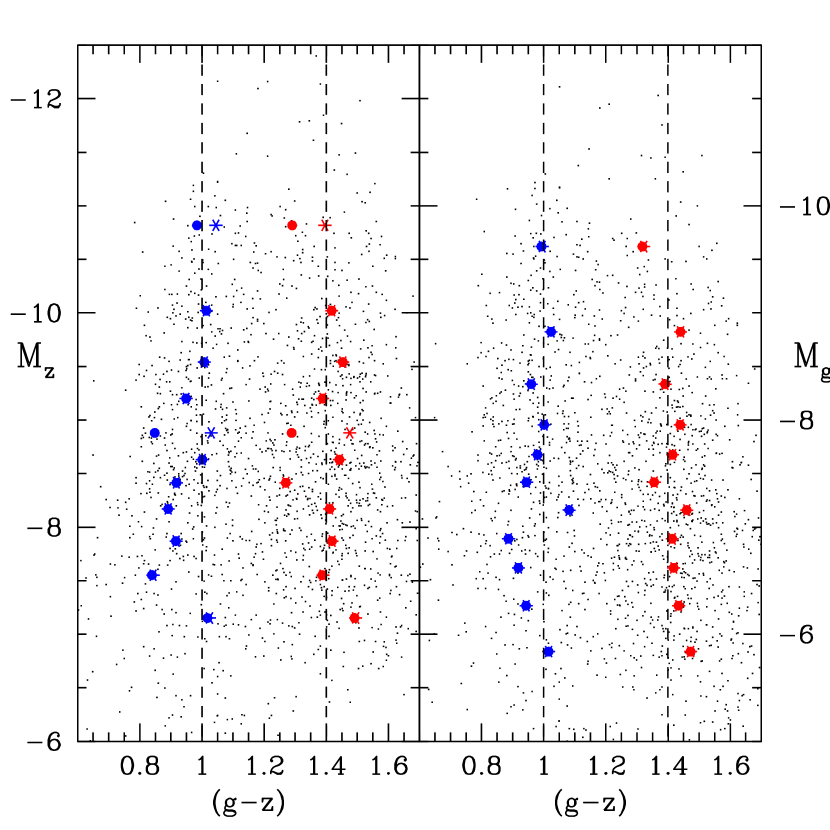
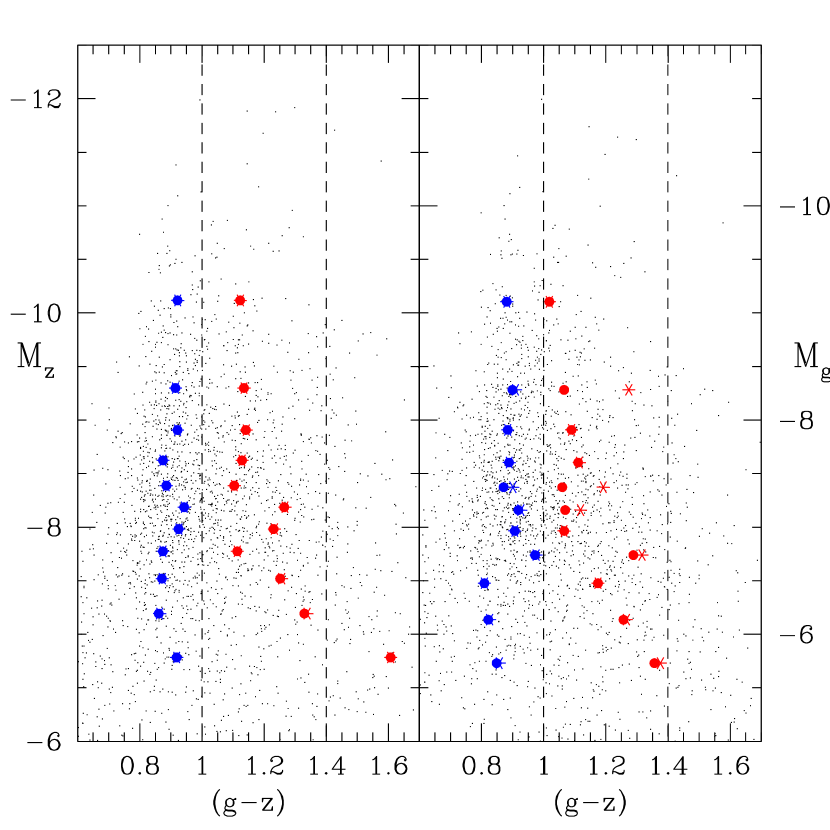
Figure 1 shows - and - CMDs for the GCS of M87 (= NGC4486 = VCC1316), the central galaxy of the Virgo Cluster and the galaxy with the singlest largest population of GCs. For comparison, Figure 2 shows the co-added CMDs for the 79 ACSVCS galaxies that have reliable SBF distances (Mei et al. 2005, 2006) and which have a discernible GC population (see Peng et al. 2006). We use the SBF distance moduli from Mei et al. (2005, 2006), which have an internal precision of mag, to assign absolute magnitudes to the associated GC candidates. To better visualize trends across host galaxy magnitude, the 79 galaxies are subdivided into four broad luminosity groups such that the number of GCs per group falls in the range 2400 to 3300.
Luminosity Group 1 consists of the three brightest AVCVCS galaxies M49 (= NGC4472 = VCC1226; mag), M87 (= NGC4486 = VCC1316; mag), and M60 (= NGC4649 = VCC1978; mag). Group 2 consists of six ACSVCS galaxies with mag. Group 3 consists of 17 ACSVCS galaxies with mag. The remaining 53 ACSVCS galaxies with mag make up Group 4. The three galaxies in Group 1 are all so-called “core-Sérsic galaxies” (Ferrarese et al. 2006), while those in Groups 2 and 3 are a mixture of core-Sérsic and Sérsic elliptical and lenticular galaxies. The 53 galaxies in Group 4 consist mainly, but not exclusively, of early-type dwarfs (e.g., dE, dE,N, dS0 and dS0,N).
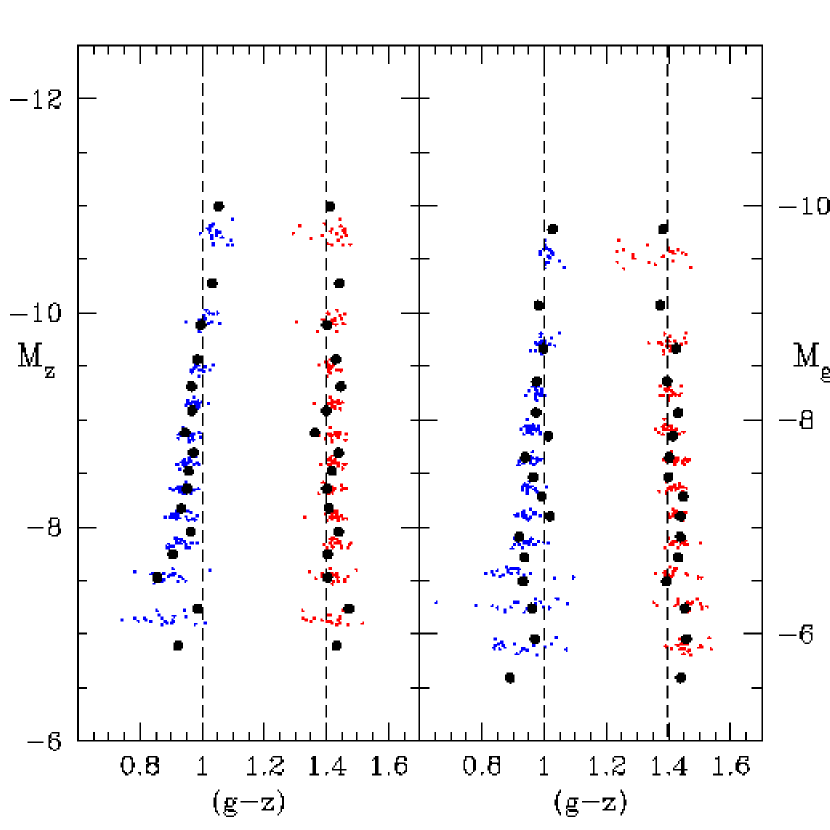
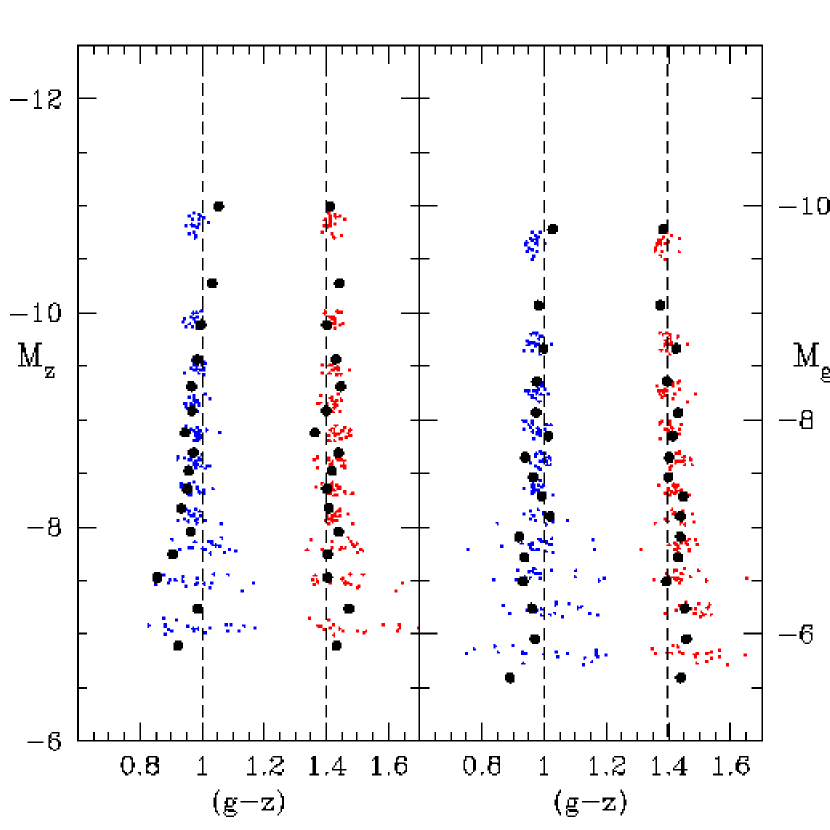
We have applied KMM to the combined CMDs for these four groups, as well as to the individual CMDs for the three galaxies in Group 1. To this end, we subdivided the CMDs into luminosity bins, each bin containing the same number of data points. For the CMDs of M49 and M60, the size of each luminosity bin is 100, for M87 the size is 150, and for the combined CMDs the bin size is 200 GCs. KMM was then run on the GC color distribution in each luminosity bin. As in the paper by Harris et al. Harris06, we use the heteroscedastic option of KMM: we allow for Gaussians of different widths to be fitted to the blue and red GC populations. The fitted mean positions are plotted over the respective CMDs in Figures 1 and 2. We show the KMM results for two different initial guesses for the mean colors of the blue and red GC populations: one for the pair and 1.2 mag, another one for and 1.4 mag. These different guesses were chosen to cover: (1) the range of peak positions between CMDs of the various luminosity groups; and (2) the range caused by the color-magnitude trend itself (see Figure 2). Linear slopes between color and absolute magnitude are obtained from ordinary least square fits to the KMM peak positions for both pairs of initial guesses, fitting color as a function of magnitude. GCs fainter than mag and mag were excluded from the fits, to avoid effects of photometric incompleteness on the measured slopes. The mean of both fits is adopted as the final best-fit slope. The fit errors of the slope are derived from re-sampling the points using as dispersion the observed scatter around the fitted relation. We note that this scatter is for all luminosity groups larger (by 30% for luminosity group 1 and by 100% for group 4) than the average statistical error estimate for the peak position, given by . Here, is the KMM width of the Gaussian peak and the average number of GCs per magnitude bin associated to the peak. We are therefore confident that our error estimates are not too optimistic. For the few cases where the difference between the results obtained using the two initial guesses was larger than the formal fit errors, we adopted the difference as the error. The resulting slopes of those fits are shown in Table 1.
We first consider vs. for Group 1. In this case, we detect a very significant slope for the blue peak position. When restricting the fit to mag (i.e., rejecting the two brightest magnitude bins in Figure 2), the result is . This is significant at the 4.5 level, indicating that the color-magnitude trend is not restricted to just the brightest GCs. For M87 and M60 alone, a comparable slope is derived, albeit at somewhat lower () significance. The slope for M49 is consistent with zero, in agreement with the findings of Strader et al. Strade05. When excluding M49 from Group 1, the slope for the blue population rises slightly to . The non-detection of a color-magnitude trend for M49 is intriguing, since this galaxy has a similar number of GCs as M60 and is similar to M60 and M87 in terms of luminosity, color, surface brightness and GC dynamics (Peng et al. 2006; Ferrarese et al. 2006; Mei et al. 2005; Côtê et al. 2001; 2003). The fact that M49 is located at the center of its own sub-cluster — being offset by from the Virgo Cluster center — may hint at some environmental effect on the strength of the observed color-magnitude trend.
In contrast to the strong correlation exhibited by the blue GCs in Group 1, is insignificant for the red GCs in this group. However, the situation changes when using instead of as magnitude in the color-magnitude diagram (see Table 1). The slope for the blue population is more than 50% smaller than and, as a result, has a lower level of significance (1.7.) Considered individually, of the blue population becomes insignificant for all three galaxies in this group. In turn, the slope of the red population becomes marginally positive — i.e., opposite in sense to that defined by for the blue population.


| Sample | ||||
|---|---|---|---|---|
| M49 () | -0.008 0.024 | 0.013 0.018 | 0.021 0.018 | 0.043 0.008 |
| M87 () | -0.042 0.015 | 0.003 0.023 | -0.016 0.023 | 0.025 0.017 |
| M60 () | -0.028 0.009 | 0.012 0.018 | -0.003 0.033 | 0.072 0.017 |
| Simulated M87 NoCM | 0.002 0.012 | 0.010 0.015 | 0.008 0.015 | 0.028 0.022 |
| Simulated M87 CM | -0.039 0.009 | 0.010 0.014 | -0.028 0.010 | 0.031 0.024 |
| Group1 () | -0.037 0.004 | -0.001 0.007 | -0.015 0.009 | 0.032 0.019 |
| Group2 () | -0.033 0.011 | 0.001 0.014 | -0.022 0.016 | 0.042 0.018 |
| Group3 () | -0.032 0.012 | -0.043 0.024 | -0.010 0.007 | 0.055 0.029 |
| Group4 () | -0.009 0.013 | 0.028 0.028 | 0.025 0.012 | 0.058 0.040 |
| Group1, inner regions | -0.061 0.014 | -0.006 0.014 | -0.007 0.018 | 0.059 0.018 |
| Group1, outer regions | -0.026 0.008 | 0.003 0.020 | -0.004 0.015 | 0.050 0.014 |
| Group1+2, inner regions | -0.066 0.007 | -0.024 0.006 | -0.022 0.020 | 0.043 0.018 |
| Group1+2, outer regions | -0.023 0.013 | 0.009 0.013 | -0.018 0.007 | 0.029 0.013 |
Notes: For the samples in column 1, columns 2 to 5 give the slopes between and the respective magnitude of the blue and red GC subpopulations, as derived from KMM determined peak positions. Errors come from random resampling of the data points using their measured dispersion around the fit. For the two simulated sets of CMDs, “CM” refers to an implemented slope 0.040 in the blue peak and no slope in the red peak. “NoCM” refers to no implemented slope. Errors quoted for the simulations are rms around the mean for 20 simulated M87 CMDs. The faint limiting magnitude for fitting was mag in and mag in . The separation between inner and outer region for the lower four samples was defined at a galactocentric distance of 65. By that, the inner and outer sample were of approximately equal size.