A Subaru/Suprime-Cam wide-field survey of globular cluster populations around M87 - I: Observation, data analysis, and luminosity function
Abstract
In this paper and a companion paper, we report on a wide-field imaging survey of the globular cluster (GC) populations around M87 carried out with Suprime-Cam on the 8.2m Subaru telescope. Here we describe the observations, data reduction, and data analysis and present luminosity functions of GC populations around M87 and NGC 4552, another luminous Virgo elliptical in our survey field. The imaging data were taken in the , , and bands with a sky coverage of extending from the M87 centre out to 0.5 Mpc. GC candidates were selected by applying a colour criterion on the and diagram to unresolved objects, which greatly reduces contamination. The data from control fields taken with Subaru/Suprime-Cam were also analyzed for subtraction of contamination in the GC sample. These control field data are compatible with those in the M87 field in terms of the filter set (), limiting magnitudes, and image quality, which minimizes the possibility of introducing any systematic errors into the subtractive correction. We investigate GC luminosity functions (GCLFs) at distances ( 45 kpc) from the host galaxy centre in detail. By fitting Gaussians to the GCLFs, the -band turnover magnitude () is estimated to be mag and mag for the GC population in M87 and NGC 4552, respectively. The GCLF is found to be a function of GC colour; of the red GC subpopulation () is fainter than that of the blue GC subpopulation () in both M87 and NGC 4552, as expected if the colour differences are primarily due to a metallicity effect and the mass functions of the two subpopulations are similar. The radial dependence of the GCLF is also investigated for the GC population in M87. The GCLF of each subpopulation at is compared with that at but no significant trend with distance is found in the shape of the GCLF. We also estimate GC specific frequencies () for M87 and NGC 4552. The of the M87 GC population is estimated to be 12.5 0.8 within 25′. The value of the NGC 4552 GC population is estimated to be 5.0 0.6 within .
keywords:
galaxies: elliptical and lenticular, cD — galaxies: star clusters — galaxies: evolution — galaxies: formation — galaxies: individual: NGC 4486, NGC 4552— galaxies: clusters: individual: Virgo cluster.1 INTRODUCTION
Globular clusters (GCs) are homogeneous stellar systems containing stars with a single age and metallicity, which are in principle simpler to interpret than photometric and spectroscopic observations of the integrated stellar light of a galaxy. GCs are therefore considered to be powerful probes with which to understand the star formation and chemical enrichment history of their host galaxy. One of the basic findings from observations about GC populations in luminous galaxies is that while thousands of GCs are associated with luminous elliptical galaxies, a significantly smaller number of GCs exist around spiral galaxies with similar luminosities (e.g., Harris 1991; Barmby 2003). This indicates that the specific frequency of GCs (), which is considered to be related to the relative efficiency of GC formation and/or survival compared to galactic halo/bulge stars, depends on galaxy morphology. In fact, has also been suggested to be correlated with local galaxy density, with galaxies in denser environments having larger values (West 1993). The fact that this trend appears to exist even when the sample of galaxies is restricted to ellipticals suggests that GC formation efficiency is more physically linked with galaxy environment. One possibility to explain this observation is biased GC formation in galaxies inhabiting denser environments (West 1993; Blakeslee 1999; McLaughlin 1999). Alternatively, a substantial number of GCs in a luminous galaxy may have an external origin; GCs could be captured from other galaxies through galaxy interactions and accrete onto luminous galaxies in clusters, which would then enhance values as observed.
Recent studies of GCs in the central regions of luminous ellipticals conducted with the Hubble Space Telescope (HST) have revealed that many luminous ellipticals have bimodal or multimodal colour distributions of GCs (Gebhardt & Kissler-Patig 1999; Larsen et al. 2001; Brodie et al. 2005). It is found that the mean colours of both red (metal-rich) and blue (metal-poor) GC subpopulations are correlated with the host galaxy luminosities and colours (Larsen et al. 2001; Strader, Brodie & Forbes 2004; Strader et al. 2005; Peng et al. 2006), which will be important constraints on the proposed scenarios for the formation and evolution of GC population such as multiphase collapse scenario (Forbes, Brodie & Grillmair 1997), merger scenario (Ashman & Zepf 1992), hiearchical merging scenario (Beasley et al. 2002), and accretion scenario (Côté, Marzke & West 1998). The small field of view of the HST, however, does not allow one to collect GC populations in the outer halo of a galaxy and investigate their spatial structures, which will also be key pieces of the puzzle (e.g., Moore et al. 2005). Much wider-field studies (e.g., out to 100 kpc from the galaxy centre) of GC populations therefore need to be performed using ground-based data (Rhode & Zepf 2001, 2004; Dirsch et al. 2003; Bassino et al. 2006). Studying GC populations at large distances from the host galaxy is of great importance because the outer halo of the host galaxy, and even the intergalactic space, are presumed to be large reservoirs of blue and metal-poor GCs in the accretion scenario.
| Field ID | Field centre | Integration time () | Seeing size | ||||||
|---|---|---|---|---|---|---|---|---|---|
| [sec (mag)] | [arcsec] | ||||||||
| (1) | (2) | (3) | (4) | ||||||
| (J2000) | (J2000) | (J2000) | |||||||
| Field 1 | 746 | 3680 (25.6) | 1350 (25.1) | 3480 (24.6) | 1.8 | 1.0 | 1.0 | ||
| Field 2 | 748 | 2640 (25.9) | 1350 (25.2) | 3690 (24.7) | 1.2 | 1.0 | 1.0 | ||
| Field 3 | 749 | 1800 (25.7) | 1350 (25.2) | 2640 (24.5) | 1.5 | 1.0 | 1.1 | ||
| Field 4 | 750 | 2280 (26.1) | 1350 (25.2) | 4380 (24.8) | 1.1 | 1.0 | 1.0 | ||
| HDF-N | 548 | 6000 (26.6) | 4800 (25.5) | 4200 (25.2) | 0.8 | 1.1 | 0.9 | ||
| Lockman Hole | 513 | 6000 (26.9) | 4800 (26.0) | 3600 (24.8) | 1.0 | 1.1 | 1.3 | ||
In this paper and a companion paper (Tamura et al. 2006; Paper II hereafter), we report a wide-field imaging survey of the GC populations around M87 conducted with Suprime-Cam on the Subaru telescope. Several moderately wide-field studies of GCs surrounding M87 have already been carried out using photometry (Strom et al. 1981; McLaughlin, Harris, & Harris 1994; Harris, Harris, & McLaughrin 1998; Hanes et al. 2001) and spectroscopy (Cohen & Rizhov 1997; Cohen, Blakeslee & Rizhov 1998; Kissler-Patig & Gebhardt 1998; Côté et al. 2001), but all of these studies explored only the regions ( 45 kpc or 5 ) from M87. In contrast, the area of our survey is approximately (560 kpc 140 kpc) extending from the centre of M87 out to 0.5 Mpc, which is the widest survey yet undertaken of the GC populations in luminous galaxies. In this paper, we focus on describing the observations, data reduction (§ 2) and data analyses such as selection and photometry of GC candidates, incompleteness correction, and subtraction of foreground and background contamination in the GC candidates (§ 3). We derive GC luminosity functions around M87 and NGC 4552, another Virgo luminous elliptical galaxy in our survey field, and estimate the global GC specific frequencies of these luminous ellipticals in § 4. We investigate colour distributions and spatial distributions of GC candidates in Paper II. We adopt distances of 16.1 Mpc (distance modulus of 31.03) to M87, and 15.4 Mpc (distance modulus of 30.93) to NGC 4552, based on measurements using the surface brightness fluctuation method (Tonry et al. 2001). An angular scale of 1′ corresponds to 4.7 kpc and 4.5 kpc at the distance of M87 and NGC 4552, respectively.
2 OBSERVATIONS, DATA REDUCTIONS, AND CALIBRATIONS
2.1 The M87 Fields
2.1.1 Observations and data reductions
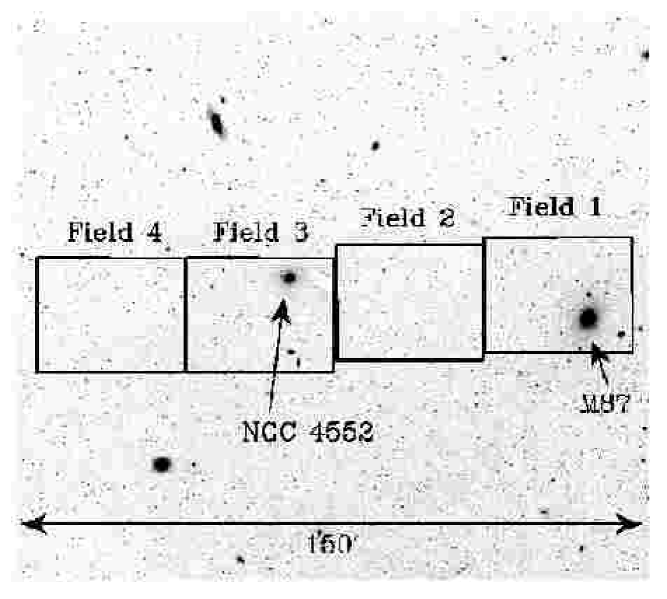
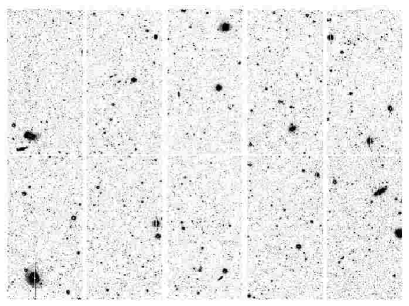
Imaging observations were performed on 17 and 18 March 2004, with Suprime-Cam (SCam) (Miyazaki et al. 2002) on the Subaru telescope. SCam is a mosaic CCD camera with 10 2K4K CCD chips and the field of view is approximately on the sky. The pixel scale is pixel-1. In this observing program, a field of approximately 1 square degree () extending from M87 towards the east was covered by 4 telescope pointings through -, -, and -band filters. The field IDs and locations are shown in Fig. 1 and the observation log is presented in Table 1. Each field was observed with the telescope dithered by . Since this dithering scale is smaller than the gap between the CCDs, the 10 CCD frames are not mosaiced into one continuous frame but are reduced and analyzed individually. A typical exposure time of one frame is 360 sec, 270 sec, and 240 sec in , , and band, respectively; several frames were co-added to give the total exposure times listed in Table 1. On the first night, the sky condition was non-photometric and the transparency was highly variable. On the second night, it was much better but was still hazy with a little variation. We therefore scale the data taken on the first night by shifting the magnitude zeropoints to match with those of the data on the second night, calibrate the reduced data based on the standard stars taken on the second night, and check the calibration using GC photometry in the literature (see next section for details). Typical seeing sizes during the observations were in band and in and bands.
Data reduction was performed with IRAF111IRAF is distributed by
the National Optical Astronomy Observatories, which is operated by the
Association of Universities for Research in Astronomy, Inc. under
cooperative agreement with the National Science Foundation. in a
standard manner; bias subtraction, flat-fielding, masking bad columns
and saturated pixels, sky subtraction, registration, and average
stacking with a 3 clipping algorithm.
Sky subtraction was performed by employing the following two steps.
Firstly, an image was divided into a mesh of 128 128 pixels
() and a median sky
value was estimated in each window after bright objects were masked. A
sky value in each pixel was then estimated by an interpolation of the
median sky values for the adjacent windows. A background image of an
object frame was created with this process which was then subtracted.
For CCD frames where bright galaxies or their envelopes are quite
extended (e.g., near M87 and NGC 4552), this method cannot be applied.
Instead, an average background was estimated as a single value using a
“blank” CCD frame within the same exposure. It was corrected for the
sensitivity difference between the two CCD frames using the flat-field
frames.
In stacking CCD frames, aperture photometry of bright stellar
objects selected using SExtractor (Bertin & Arnout 1996) based on the
CLASS_STAR index was performed in each frame and the zeropoint of
the frame was shifted so as to match that in a frame taken on the second
night. PSF matching was not performed to avoid degradation of image
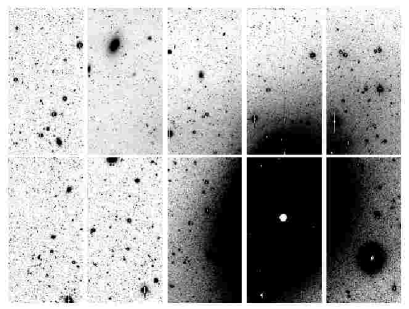
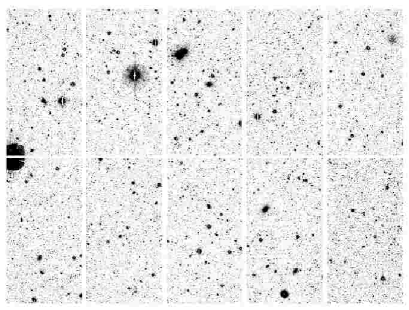
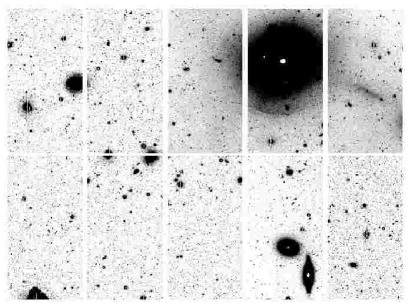
quality. The stacked images are presented in Fig. 2
5.
2.1.2 Photometric and astrometric calibration
Photometric calibration of the M87 fields was performed using standard stars from Landolt (1992) which were observed at the beginning and end of the second night. Several standard stars were imaged on each CCD chip so that the calibration could be carried out individually. Photometry of standard stars was performed within a diameter aperture. After excluding saturated stars and those in crowded regions, magnitude zeropoints and the trends with sec and colours were calculated. The estimated accuracy in the fitting procedure is mag.
Since our data include frames which were taken under non-photometric sky
conditions, we check the photometric calibration by comparing our
photometry of GCs around M87 with that in the literature. We make use of
GC photometry in the and bands by Harris, Harris, & McLaughlin
(1998, HHM hereafter) and that in the Washington system ( and )
by Hanes et al. (2001, H01 hereafter). The GC photometry by H01 is
converted to the standard system by using the formulae obtained by
Geisler (1996).
PSF-fitting photometry was carried out for GCs using the PSF and ALLSTAR
tasks in the DAOPHOT package of IRAF. A PSF was determined using moderately bright (unsaturated) stellar objects in each CCD frame,
which were selected using SExtractor based on the CLASS_STAR
index. The PSF obtained was also used for GC photometry, since the GCs
at the distance of the Virgo cluster are unresolved at the seeing sizes
of our images.
Galactic extinction was then corrected using reddening maps from
Schlegel, Finkbeiner, & Davis (1998).
We are primarily concerned about zeropoint offsets for -band
magnitude and and colours; the band image is used as a
selection band to make a catalog of GCs and and colours are
used to isolate GC candidates from other unresolved objects (see
§ 3.3 for details). While can be converted into
with a small error, it is not converted to with a good
accuracy (Geisler 1996). We therefore decided to estimate the zeropoint
offset in from the comparison with H01 and those in and
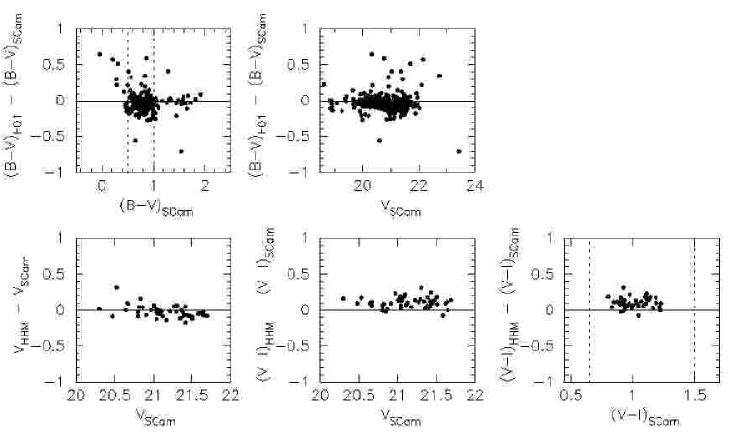
from the comparison with HHM. Our GC photometry is compared with that
from H01 and HHM in Fig. 6. Dotted lines in these plots
indicate the approximate edges of the colour range which is expected to
be occupied by GCs. These comparisons suggest that there are some
zeropoint offsets between our photometry and that in the literature. The
zeropoint offsets in , and are 0.04 mag, 0.05 mag and
0.10 mag, respectively. Our magnitude and colours are corrected for these
zeropoint offsets in the following analyses.
We performed astrometric calibration against the 2MASS catalog using the CCMAP task in IRAF. A plate solution (second order polynomial with full cross terms) was computed for each CCD chip using stars with mag. The fitting accuracy is typically .
2.2 The Control Fields
In addition to the M87 field data, we also analyze images of the (blank) fields, HDF-N and Lockman Hole (LH), retrieved from the Subaru-Mitaka-Okayama-Kiso Archive (SMOKA) system (Baba et al. 2002). These data were taken with SCam on the Subaru telescope during several observing runs in 2001: 23 and 24 Feb for on HDF-N and on LH, and 22 and 23 Apr for and on LH (Capak et al. 2004). This information is also summarized in Table 1. These control field data are used to estimate contamination in the sample of GC candidates and to statistically subtract it, which is essential for investigating properties of GC populations such as the luminosity function and colour distribution. We emphasize that these control fields are also at high galactic latitudes (Table 1), and that the data cover reasonably wide sky areas (one SCam field of view: 900 arcmin2) and are comparable with our data in the M87 field in terms of the filter set, limiting magnitudes, and image quality. This minimizes the possibility of introducing any systematic errors into the subtractive corrections for foreground and background contamination in the GC sample.
The data reduction was carried out with SDFRED (Yagi et al. 2002; Ouchi et al. 2004), which is a reduction pipeline optimized for SCam data of blank fields. The basic reduction procedure is the same as that applied to the M87 field data. The large scale of telescope dithering () for these control field data enables the CCD frames to be stacked into one continuous image with sensitivity differences between CCDs corrected by using stellar objects in the overlap regions. To avoid any complications due to a possible drop of limiting magnitude near the field edge, we use only the central region in the following analyses. The magnitude zeropoints of the HDF-N data were calculated using the photometry catalog by Capak et al. (2004). These authors did not observe any standard stars during the observations and determined magnitude zeropoints by exploiting the accurate photometry of objects in the region where deep HST/WFPC2 data are available. The best-fit SEDs to the multi-band photometry of the objects (Fernández-Soto, Lanzetta & Yahil 1999) were used to account for the slight differences in the filter responses between Subaru/SCam and HST/WFPC2. Since the band data of the LH field were taken in the same runs as for the HDF-N, the same zeropoint is adopted. The and band data of the LH field were taken on different observing runs and standard stars were observed at elevations similar to those of the LH field during the night. Magnitude zeropoints were derived from these data. Galactic extinction was then corrected using Schlegel et al. (1998).
3 DATA ANALYSES
3.1 Halo Light Subtraction
As shown in Figs. 2 and 4, M87 and NGC 4552 extend
across several CCD frames and their halos have to be subtracted to
reveal the GC populations. We removed the halos by conducting an
iterative median smoothing and subtraction (e.g., McLaughlin, Harris, &
Hanes 1994). First, we subtract unresolved objects from an image. This
process is not mandatory, but it helps better model the extended halo
light distributions or their residuals in subsequent iterations. Object
detection was performed with SExtractor and unresolved objects were
picked out based on the CLASS_STAR index. A PSF was determined
using moderately bright stars, which was then fitted to unresolved
objects and the fitted profiles were subtracted from the original image
using the ALLSTAR task. The resulting image was median-smoothed
to create an image with a halo light distribution which was subtracted
from the original image. This procedure was repeated 4 times with the
mesh size successively reduced (128, 64, 32, and 32 pixels).
3.2 Artificial Star Tests

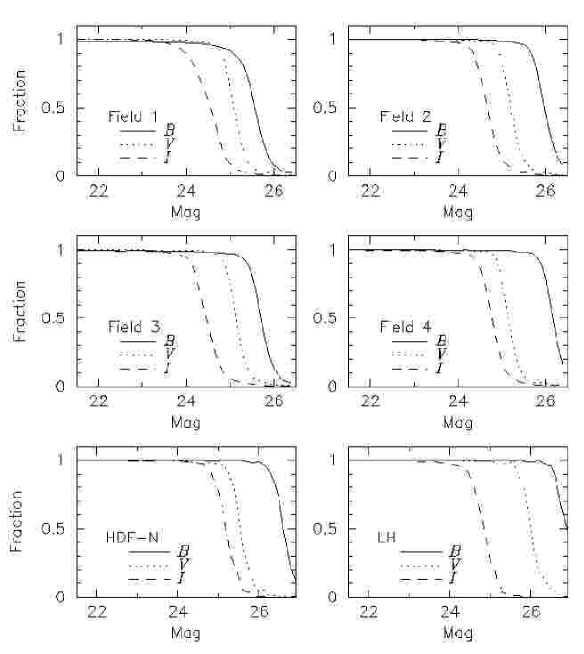
We performed artificial star tests for investigating detection completeness to point sources on the -, -, and -band images, after bright galaxies were subtracted if necessary. Using the IRAF STARLIST and MKOBJECT tasks, artificial stars with the same PSF as that determined using real unresolved objects were distributed on the original image. For a series of tests, 500 artificial stars within a certain range of magnitude mag were generated while successively changing the magnitude range as the test progressed. SExtractor was then used for object detection and the fraction of artificial stars detected (i.e., detection completeness) was calculated as a function of magnitude. Note that faint stars could be rejected by DAOPHOT even if they are detected by SExtractor, but the fraction of such artificial stars turns out to be small ( 1 %) throughout the magnitude range investigated in our artificial star tests. We performed these artificial star tests on all the CCD frames in all the observed fields (Field 1 4) and the overall completeness in each observing field is plotted against -, -, and -band magnitude in the top and middle panels of Fig. 7. This indicates the presence of a slight field-to-field variation in limiting magnitude. The detection completeness is also a function of galactocentric distance; for instance, limiting magnitudes are 0.5 mag brighter near the centre of M87 where the noise is higher. Therefore, when investigating the luminosity function and colour distribution of GC candidates within an annulus at a certain distance from the host galaxy, we correct for incompleteness using the completeness functions estimated within the same annulus. Especially near the luminous ellipticals, we divide the annulus into sub-annuli to follow the local variation of the incompleteness in the annulus. The artificial star tests were also executed on the control field images and the overall completeness functions are indicated in the bottom panels of Fig. 7. The magnitudes giving 50 % completeness on the M87 fields and the control fields are listed in Table 1.
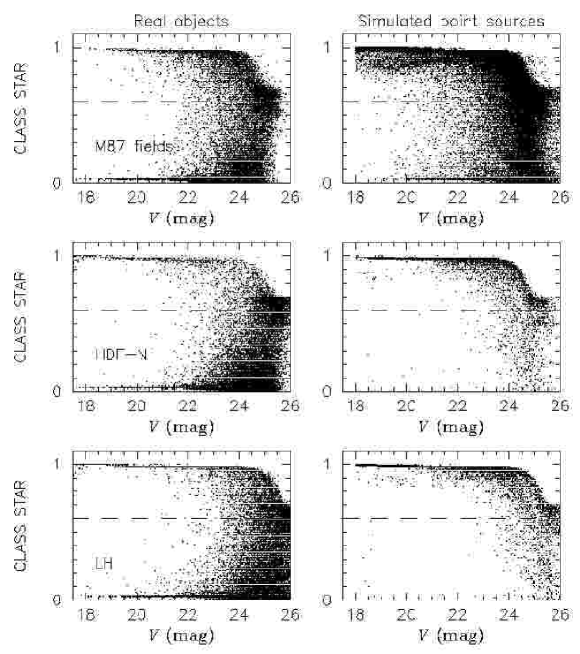
Since unresolved objects are firstly selected based on the
CLASS_STAR indices on the -band image when selecting GC
candidates (see § 3.3), one also needs to consider biases
associated with the selection of unresolved objects in addition to the
simple detection incompleteness as mentioned above. In the top panels of
Fig. 8, CLASS_STAR indices of the detected objects
(left panel) and the artificial stars (right panel) in the M87 fields
are plotted against -band magnitude. In the middle and bottom panels,
the results in the control fields are shown. These plots indicate that
the CLASS_STAR index of a point source tends to be underestimated
at fainter magnitudes and more stellar objects are expected to be
excluded when we classify objects with CLASS_STAR indices larger
than a certain value as unresolved. We quantify this selection effect as
functions of magnitude and distance from the host galaxy based on
these artificial star tests.
3.3 Selection and Photometry of GC Candidates
We begin selection of GC candidates with object detection using
SExtractor. Firstly, we picked out all objects having at least 20
connected pixels ( arcsec2, which is approximately equal to
the FWHM area of the PSF) more than 2 above the local
background (only objects selected in all the three -, -, and
-bands were used for analysis). Secondly, we selected objects with
CLASS_STAR indices larger than 0.6 as unresolved objects. The
-band image was used for this classification because it has the best
image quality in our data. The subsequent results do not change if this
cutoff for the CLASS_STAR index is set to 0.5 or 0.7. We note
that our criterion (CLASS_STAR ) is more stringent than
those adopted in previous GC studies ( in Dirsch et al. 2003
and in Forbes et al. 2004) using data with better image
quality than our data.
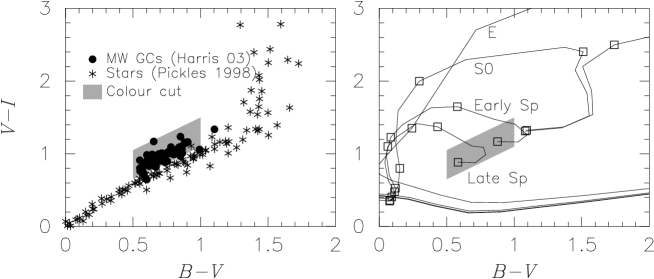
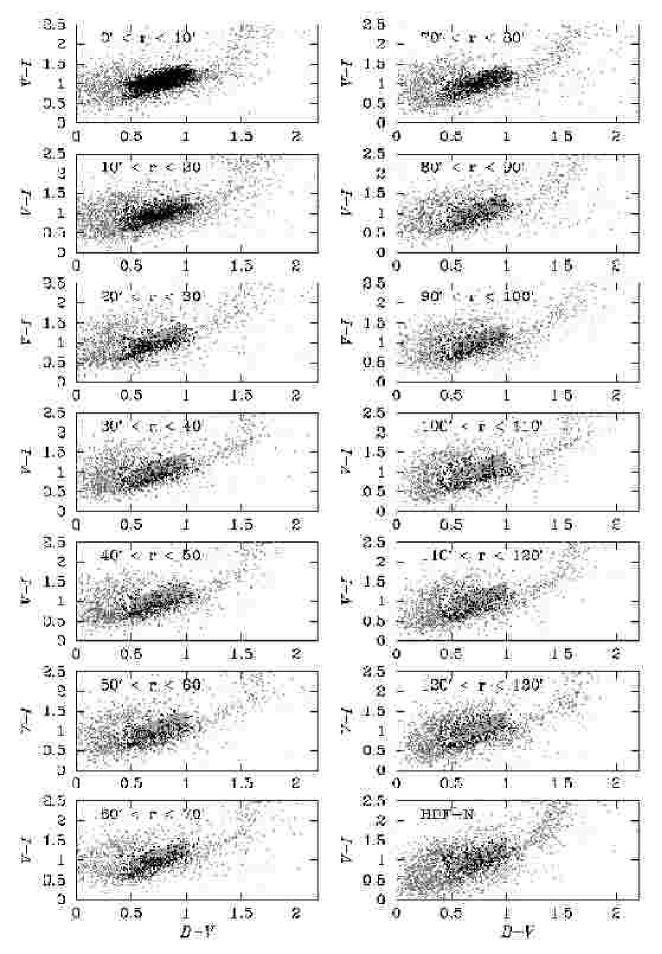
PSF-fitting photometry was performed for these unresolved objects and their , , and magnitudes were measured. In this process, a residual sky background around an object is estimated within an annulus 10′′ away from the object with a 4′′ width and is subtracted. Errors in the -band magnitude and and colours due to a PSF fitting error and sky subtraction error are plotted as a function of -band magnitude in the top, middle, and bottom panels of Fig. 9 for unresolved objects in the M87 fields, HDF-N field, and LH field, respectively. A colour criterion was then imposed on these unresolved objects to isolate GC candidates. We show this colour criterion as the shaded region in Fig. 10 which includes almost all the Galactic GCs in the catalog by Harris (1996)222The catalog used here is the version last updated in 2003. but minimizes the contamination by foreground stars and background galaxies. The and colour-colour diagrams of the unresolved objects on our images are indicated in Fig. 11; the objects are divided into panels based on their distances from M87, apart from those in the HDF-N field, which are plotted in the bottom right panel for reference. Black dots indicate unresolved objects which pass the colour selection, while grey dots are those which do not satisfy the colour criterion. Some unresolved objects sitting outside the colour criterion are accepted as GC candidates by taking into account errors in the colours (e.g., Rhode & Zepf 2001); if colours of unresolved objects can satisfy the colour criterion within their errors, they are sampled as GC candidates. This “inclusive” colour selection allows us to incorporate fainter GCs which are more likely to be scattered out of the colour criterion due to larger errors in the colours. Although contaminating objects may also be included, they are expected to be corrected for by the control field data (see § 3.4).
3.4 Correction of Incompleteness and Foreground and Background Contamination
In deriving a GC luminosity function (GCLF) and colour distribution, incompleteness correction is undertaken as follows. The number of GC candidates at a certain magnitude is firstly corrected for the incompleteness in detection and selection of unresolved objects on the -band image. Detection incompleteness on the and band images is then corrected; GCs with a given -band magnitude are divided into bins according to their and colours, and the numbers of objects are multiplied by a factor to correct for the incompleteness at the and magnitudes (, ). These incompleteness corrections are also applied to GC candidates found in the control fields.
Although the selection using the two colour diagram is expected to
efficiently isolate GCs from foreground stars and background unresolved
galaxies, there are still likely to be some contaminating objects, and a
subtractive correction of this contamination is essential to investigate
GC properties in the outer halo of the host galaxy where the GC surface
number density is very low. We extract contaminating populations of
unresolved objects from the control fields by using selection criteria
identical to those adopted in the M87 fields; objects with
CLASS_STAR 0.6 are selected as unresolved objects and GC
candidates are isolated by using the same colour criterion on the
vs. colour-colour diagram.
When subtracting contamination in a certain region within the M87 survey field, we take into account differences in data quality, especially errors in the colours at a certain magnitude, between the M87 field and control field. Since the errors in the control fields are smaller than those in the M87 field, a smaller number of objects would be scattered into the colour criterion in the control fields and the contamination could be underestimated. We pick out unresolved objects within narrow ranges ( mag) of , and from both the M87 field and control field and calculate the differences of typical errors in the colours between the two samples of unresolved objects. We then randomize the measured colours of the unresolved objects in the control field by an amount which is determined from a Gaussian distribution whose average is zero and whose standard deviation is estimated from the difference of the typical errors in the colours. The observational errors in the colours of the unresolved objects in the control field are therefore replaced with the typical errors of those in the M87 field. This sequence is repeated in the control field for different magnitudes and the colours successively changed, which provides a mock catalog of unresolved objects in the control field whose error characteristics are compatible with those in the M87 field. Based on the colours and errors in this mock catalog, the colour selection is performed to pick up contaminating objects in the control field333Because this sequence involves random numbers, the GC candidates in a control field needs to be defined by a number of attempts based on the Monte Carlo technique. But in fact, the variance of the average population is small because the “inclusive” selection of GC candidates does not give a sharp cutoff on the and colour-colour diagram.. The luminosity function and colour distribution of these contaminating objects including the incompleteness corrections are then subtracted from those in the M87 field with the survey area normalized.
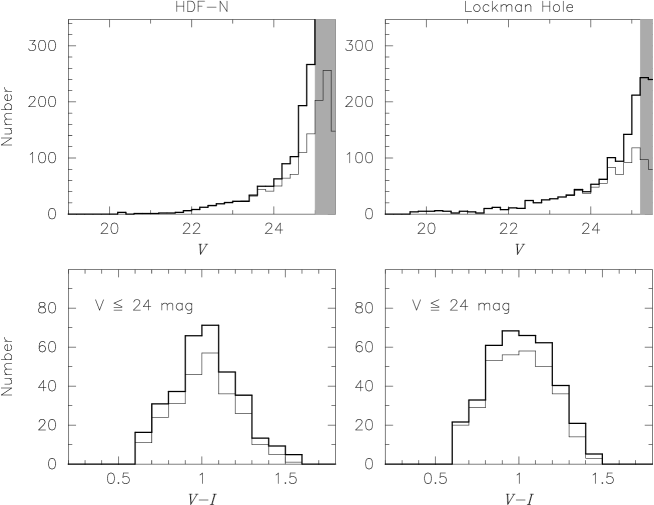
In Fig. 12, the -band luminosity functions and colour distributions of GC candidates found in the control fields are displayed. Note that these are obtained by considering the entire region of the M87 survey field. The LF and colour distribution in the control fields are normalized to the survey area of a target field when subtracted. Most of these contaminating objects are likely to be background galaxies with compact morphology; candidates are dwarf ellipticals and blue compact dwarfs, the latter of which need to be at higher redshifts than the former to meet the colour criterion. Foreground stars can also be scattered into the GC colour selection due mainly to photometric errors, but since the errors in the colours are mag even at mag, which is approximately the faintest magnitude of GCs studied in this work, their contribution is presumed to be smaller than the background galaxies.
| Galaxy | All GCs | Red GCs | Blue GCs | ||||
|---|---|---|---|---|---|---|---|
| (mag) | (mag) | (mag) | (mag) | (mag) | (mag) | ||
| M87 | () | ||||||
| M87 | () | ||||||
| M87 | () | ||||||
| M87 | (; K99) | ||||||
| M87 | (; L01) | ||||||
| NGC 4552 | () | ||||||
| NGC 4552 | () | ||||||
| NGC 4552 | (; KW01) | (fixed) | |||||
| NGC 4552 | (; L01) | ||||||
4 RESULTS AND DISCUSSIONS
4.1 Globular Cluster Luminosity Function
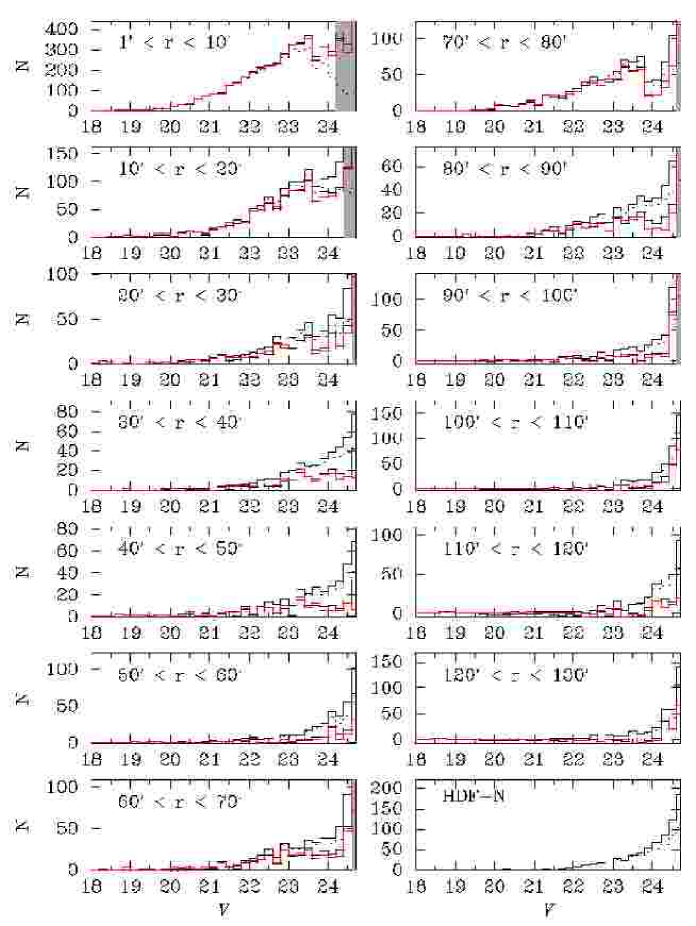
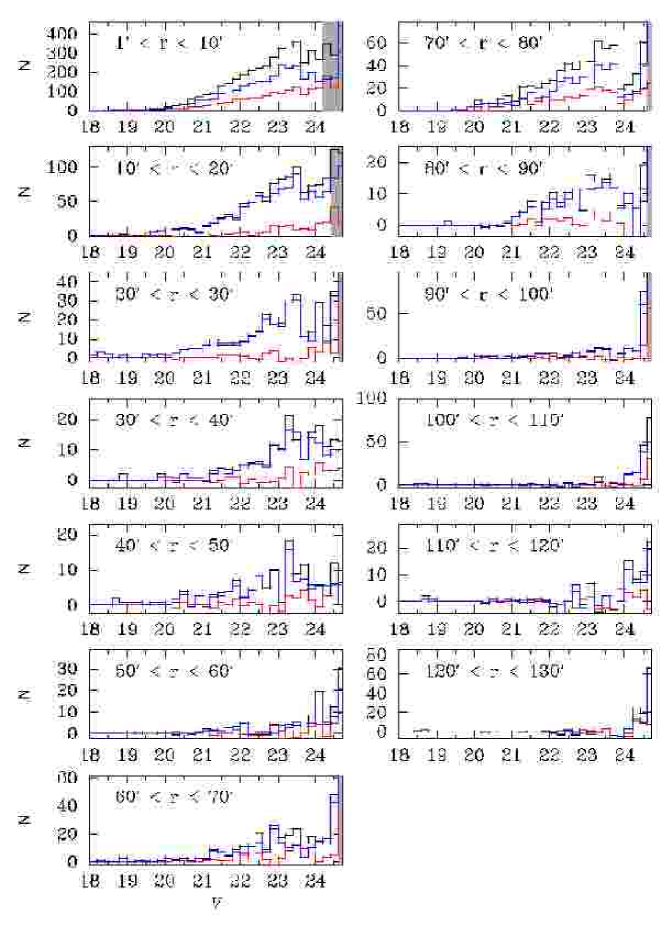
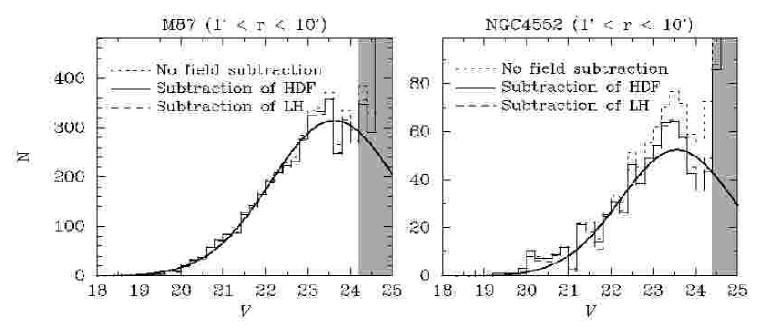
In Fig. 13, GCLFs obtained within annuli centered on M87 are
presented. The dotted lines indicate raw GCLFs without incompleteness
correction or control field subtraction, and the thin black lines show
GCLFs after the incompleteness is corrected for (but no subtractive
correction for contamination is performed yet). The red (thick black)
lines show GCLFs after the control field subtraction is also performed
based on the HDF-N (LH) field, respectively.
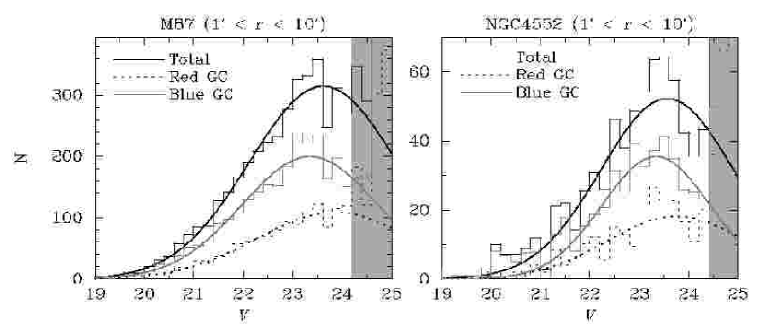
In Fig. 14, the GCLFs after the incompleteness correction and
field subtraction using the HDF-N data are divided into red () and blue () GC subpopulations. The black line shows
the GCLF for the total GC population (blue red). The boundary colour
of the blue and red GCs corresponds approximately to the middle of the
peak colours in the bimodal colour distributions (see Paper II). Note
that there is a local maximum of GC number in the bin due to the GC population of NGC 4552 at a distance of
75′ from M87. GCLFs in the outermost regions tend to
have some negative bins due to the field subtraction. In both of these
figures, the shaded region indicates the magnitude range where the
completeness is lower than 50 %. Note that the completeness is
calculated by considering not only the simple detection completeness on
the band image but also the selection efficiency of unresolved
objects based on the CLASS_STAR index and the completeness in
and bands at the corresponding magnitudes depending on the GC
colours.
We investigate and discuss the spatial distributions of GC populations
in detail in Paper II.
A Gaussian fitted to the GCLF obtained using only GCs at distances smaller than ( 45 kpc) from the host galaxy is plotted in Fig. 15 (we fit a Gaussian to the binned data). The fainter part of the GCLF in the shaded region where the completeness is lower than 50 % is not used in this fitting process. The turnover magnitude () and dispersion () of the GCLF are then estimated to be mag and mag for the GC population in M87. For the NGC 4552 GCs, and mag. In Fig. 16, the GCLFs of the red and blue GC subpopulations are shown with fitted Gaussians. Again the shaded region indicates the magnitude range where the completeness calculated by using all the GCs (i.e., blue red) is lower than 50 %. This limiting magnitude does not change a lot if only the red or blue GC subpopulation is considered since our B- and I-band images are deep enough not to miss a significant number of red or blue globular clusters detected on the V-band image. The fitted Gaussians suggest that the GCLF depends on subpopulation; the of the red GC subpopulation is mag and 0.4 mag fainter than that of the blue one for M87 and NGC 4552, respectively, although the results for the NGC 4552 GCs are less significant due to the large errors. Larsen et al. (2001) present similar results using the HST/WFPC2 data, although their values tend to be brighter than those from other studies. This difference of between the GC subpopulations is perhaps because of a metallicity difference (Ashman, Conti & Zepf 1995; Elson & Santiago 1996; Jordán et al. 2002). and of the GCLFs are summarized in Table 2.
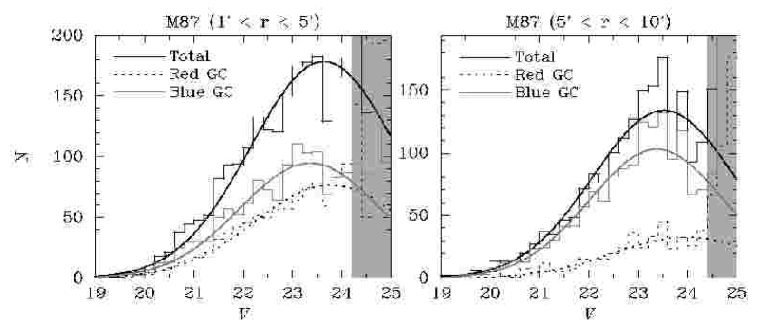
The GCs within of M87 are further divided into two samples at a boundary of and the GCLFs of all GCs, red GCs, and blue GCs in the inner and outer regions are presented in Fig. 17. Gaussians are also fitted to these GCLFs and the and are summarized in Table 2. This indicates that the shape of GCLF is not significantly different between the inner region () and the outer region () for red GCs or blue GCs. Furthermore, the GCLF shape for all GCs is consistent with that in the core region () obtained by Kundu et al. (1999) using HST/WFPC2: mag (). This suggests that the GCLF shape of the M87 GCs is not a strong function of distance from the host galaxy. We note that the fainter part of the GCLF for all GCs tends to be more deficient at the larger distance; this is due to the lower contribution of the red GC subpopulation in the outer region. Any radial dependence of the GCLF is unclear for the GC population around NGC 4552 because the number of GCs is not substantial enough especially in the outer region (). Nevertheless, the of the GCLF obtained at is consistent with that in the core region obtained by Kundu & Whitmore (2001) using HST/WFPC2 who found mag with a fixed value of , again suggesting that the GCLF shape does not depend significantly on distance from the host galaxy.
4.2 GC Specific Frequency
Using the and of the Gaussians fitted to the GCLFs presented in Fig. 15, we can estimate the total number of GCs associated with M87 or NGC 4552 and calculate a GC specific frequency (). We first integrate a GCLF obtained in an annulus ( width) centered on the host galaxy down to the magnitude where the completeness becomes 50 %. This number is then multiplied by a correction factor to include the fainter GCs based on the Gaussian GCLF. This calculation is repeated out to a certain distance from the galaxy centre. We note that it is ideal to fit a Gaussian to a GCLF obtained in each annulus but this is difficult in practice, especially at large distances because the number of GCs is not substantial and statistical errors are significant. We therefore use the fitted Gaussian in the inner region () of M87 or NGC 4552 independently of the distance from the host galaxy. In order to estimate the number of GCs at distances smaller than , where the brightness of host galaxy halo light exceeds the linearity regime of the CCD, the radial profile of GC surface density outside the core region is fitted with a de Vaucouleurs law profile (see Paper II for details) and the fitted formula is extrapolated towards the galaxy centre. The estimated total number of M87 GCs is within from the galaxy centre (cf. by HHM). For NGC 4552, the total number of GCs is estimated to be within . Note that the fraction of GCs at estimated from the extrapolation is 8.5 % for M87 GCs and 17 % for NGC 4552 GCs. If we adopt mag as the -band absolute magnitude of M87, which is also adopted by HHM (a difference in adopted distance modulus of 0.03 mag is corrected), the value of M87 is calculated to be , which is only slightly smaller than obtained by HHM. The -band luminosity of NGC 4552 is obtained from our data by fitting a de Vaucouleurs law to the -band surface brightness profile and integrating it out to the same distance (10′); mag. The value of NGC 4552 is then estimated to be .444We calculated the total number of GCs and within 10′ for NGC 4552 to avoid possible contributions of M87 GCs and intergalactic GCs outside of this radius (see Paper II). If we fit a de Vaucouleurs law to the GC surface density profile within 10′ from the NGC 4552 centre and integrate it out to 25′ as done for M87 GCs, the number of GCs and are estimated to be and , respectively.
5 SUMMARY
We have performed a wide-field imaging survey of the globular cluster (GC) populations around M87 with Suprime-Cam on the 8.2m Subaru telescope. A (560 kpc 140 kpc) field extending from M87 to the east was observed through the filters. In addition to this unprecedented large survey area, our data analysis has been optimized to study the statistical properties of GCs as follows:
-
•
GC candidates are isolated not only with an extended source cut but also with a colour cut, where only unresolved objects falling on a specific region of the and colour-colour diagram are accepted. The colour criterion is defined so as to include almost all the Galactic GCs and to avoid foreground stars and background galaxies. This is expected to efficiently isolate bona-fide GCs from other unresolved objects on our imaging data.
-
•
In order to assess foreground and background contamination which needs to be statistically subtracted, we analyze the imaging data on the HDF-N field and the Lockman Hole field as control field data. These fields cover reasonably wide sky areas () and are compatible with the data of the M87 fields in terms of the filter set (), limiting magnitudes, and image qualities. We therefore extract contaminating populations using identical criteria to those adopted in the M87 fields, minimizing the possibility of introducing any systematic errors into the subtractive correction.
In this paper, we have investigated the luminosity function and global specific frequency () of GC candidates surrounding M87 or NGC 4552. The -band GC luminosity functions (GCLFs) were obtained in the inner regions of M87 and NGC 4552 at distances from the galaxy centres. By fitting Gaussians to the GCLFs, the turnover magnitude is estimated to be mag for M87 GCs and mag for NGC 4552 GCs. The GCLF appears to depend on GC colour; the turnover magnitude in the GCLF of the red GC subpopulation () is 0.5 mag and 0.4 mag fainter than that of the blue GC subpopulation () for the M87 GCs and NGC 4552 GCs, respectively.
For the M87 GCs, the GCLFs at were compared with those at but no obvious trend with radius was found in the shape of the GCLF for either the red or blue subpopulations. The global of M87 GCs and NGC 4552 GCs is estimated to be 12.5 0.8 within and 5.0 0.6 within , respectively.
ACKNOWLEDGEMENTS
We are grateful to the anonymous referee for careful reading of our manuscript and helpful comments. This work was based on data collected at Subaru Telescope and obtained from the SMOKA science archive at Astronomical Data Analysis Center, which are operated by the National Astronomical Observatory of Japan. We acknowledge the members of the Subaru telescope operation team, especially Dr. Hisanori Furusawa for supports during the observation. This work was partly supported by Grants-in-Aid for Scientific Research (Nos. 16540223 and 17540216) by the Japanese Ministry of Education, Culture, Sports, Science and Technology.
References
- (1) Ashman, K. M., Conti, A., & Zepf, S. E. 1995, AJ, 110, 1164
- (2) Ashman, K. M., & Zepf, S. E. 1992, ApJ, 384, 50
- (3) Baba, H., et al. 2002, ADASS XI, eds. D. A. Bohlender, D. Durand, & T. H. Handley, ASP Conference Series, Vol. 281, 298
- (4) Barmby, P. 2003, in Extragalactic Globular Cluster Systems, ed. M. Kissler-Patig (New York, Springer), p. 143.
- (5) Bassino, L. P., Faifer, F. R., Forte, J. C., Dirsch, B., Richtler, T., Geisler, D., & Schuberth, Y. 2006, A&A, in press (astro-ph/0603349)
- (6) Beasley, M., Baugh, C. M., Forbes, D. A., Sharples, R. M., & Frenk, C. S. 2002, MNRAS, 333, 383
- (7) Bertin, E., & Arnouts, S. 1996, A&AS, 117, 393
- (8) Blakeslee, J. P. 1999, ApJ, 118, 1506
- (9) Brodie, J. P., Strader, J., Denicoló, G., Beasley, M. A., Cenarro, A. J., Larsen, S. S., Kuntschner, H., & Forbes, D. A. 2005, AJ, 129, 2643
- (10) Capak, P., et al. 2004, AJ, 127, 180
- (11) Cohen, J. G., & Ryzhov, A. 1997, ApJ, 486, 230
- (12) Cohen, J. G., Blakeslee, J. P., & Ryzhov, A. 1998, ApJ, 496, 808
- (13) Côté, P., Marzke, R. O., & West, M. J. 1998, ApJ, 501, 554
- (14) de Vaucouleurs, G., & Nieto, J. -L. 1978, ApJ, 220, 449
- (15) Dirsch, B., Richtler, T., Geisler, D., Forte, J. C., Bassino, L. P., & Gieren, W. P. 2003, AJ, 125, 1908
- (16) Elson, R. A. W., & Santiago, B. X. 1996, MNRAS, 280, 971
- (17) Fernández-Soto, A., Lanzetta, K. M., & Yahil, A. 1999, ApJ, 513, 34
- (18) Fioc, M., & Rocca-Volmerange, B. 1997, A&A, 326, 950
- (19) Forbes, D. A., Brodie, J. P., & Grillmair, C. J. 1997, AJ, 113, 1652
- (20) Forbes, D. A., et al. 2004, MNRAS, 355, 608
- (21) Gebhardt, K., & Kissler-Patig, M. 1999, AJ, 118, 1526
- (22) Geisler, D. 1996, AJ, 111, 480
- (23) Geisler, D., Lee, M. G., & Kim, E. 1996, AJ, 111, 1529
- (24) Hanes, D. A., Côté, P., Bridges, T. J., McLaughlin, D. E., Geisler, D., Harris, G. L. H., Hesser, J. E., & Lee, M. G. 2001, ApJ, 559, 812 (H01)
- (25) Harris, W. E. 1986, AJ, 91, 822
- (26) Harris, W. E. 1991, ARA&A, 29, 543
- (27) Harris, W. E. 1996, AJ, 112, 1487
- (28) Harris, W. E., Harris, G. L. H., & McLaughlin, D. E. 1998, AJ, 115, 1801 (HHM)
- (29) Jordán, A., Côté, P., West, M. J., & Marzke, R. O. 2002, ApJ Letters, 576, L113
- (30) Kissler-Patig, M., & Gebhardt, K. 1998, AJ, 116, 2237
- (31) Kundu, A., Whitmore, B. C., Sparks, W. B., Macchetto, D., Zepf, S. E., & Ashman, K. M. 1999, ApJ, 513, 733 (K99)
- (32) Kundu, A., & Whitmore, B. C. 2001, AJ, 121, 2950
- (33) Landolt, A. U. 1992, AJ, 104, 340
- (34) Larsen, S. S., Brodie, J. P., Huchra, J. P., Forbes, D. A., & Grillmair, C. J. 2001, AJ, 121, 2974 (L01)
- (35) McLaughlin, D. E. 1999, AJ, 117, 2398
- (36) McLaughlin, D. E., Harris, W. E., & Hanes, D. A. 1994, ApJ, 422, 486
- (37) Miyazaki, S., et al. 2002, PASJ, 54, 833
- (38) Moore, B., Diemand, J., Madau, P., Zemn M., & Stadel, J. 2005, MNRAS, submitted (astro-ph/0510370)
- (39) Ouchi, M., et al. 2004, ApJ, 611, 660
- (40) Peng, E. W., et al. 2005, ApJ, 639, 95
- (41) Pickles, A. 1998, PASP, 110, 863
- (42) Rhode, K. L., & Zepf, S. E. 2001, AJ, 121, 210
- (43) Rhode, K. L., & Zepf, S. E. 2004, AJ, 127, 302
- (44) Schlegel, D. J., Finkbeiner, D. P., & Davis, M. 1998, ApJ, 500, 525
- (45) Strader, J., Brodie, J. P., & Forbes, D. A. 2004, AJ, 127, 3431
- (46) Strader, J., Brodie, J. P., & Forbes, D. A. 2004, AJ, 127, 3431
- (47) Strader, J., Brodie, J. P., Spitler, L., & Beasley, M. A. 2005, AJ, submitted (astro-ph/0508001)
- (48) Strom, S. E., Forte, J., Harris, W., Strom, K. M., Wells, D., & Smith, M. 1981, ApJ, 245, 416
- (49) Tamura, N., Sharples, R. M., Arimoto, N., Onodera, M., Ohta, K., & Yamada, Y. 2006, MNRAS, submitted (Paper II)
- (50) Tonry, J. L., Dressler, A., Blakeslee, J. P., Ajhar, E. A., Fletcher, A. B., Luppino, G. A., Metzger, M. R., & Moore, C. B. 2001, ApJ, 546, 681
- (51) West, M. J. 1993, MNRAS, 265, 755
- (52) White, R. E. 1987, MNRAS, 227, 185
- (53) Yagi, M., Kashikawa, N., Sekiguchi, M., Doi, M., Yasuda, N., Shimasaku, K., Okamura, S. 2002, AJ, 123, 66