The evolution of binary star clusters and the nature of NGC2136/NGC2137
Abstract
We study the evolution of bound pairs of star clusters by means of direct N-body simulations. Our simulations include mass loss by stellar evolution. The initial conditions are selected to mimic the observed binary star cluster NGC 2136 and NGC 2137 in the Large Magellanic Cloud. Based on the rather old ages ( Myr), masses, sizes of the two clusters and their projected separation, we conclude that the cluster pair must have been born with an initial separation of 15–20 pc. Clusters with a smaller initial separation tend to merge in Myr due to loss of angular momentum from escaping stars. Clusters with a larger initial separation tend to become even more widely separated due to mass loss from the evolving stellar populations. The early orbital evolution of a binary cluster is governed by mass loss from the evolving stellar population and by loss of angular momentum from escaping stars. Mass loss by stellar winds and supernovae explosions in the first Myr causes the binary to expand and the orbit to become eccentric. The initially less massive cluster expands more quickly than the binary separation increases, and is therefore bound to initiate mass transfer to the more massive cluster. This process is quite contrary to stellar binaries in which the more massive star tends to initiate mass transfer. Since mass transfer proceeds on a thermal timescale from the less massive to the more massive cluster, this semi-detached phase is quite stable, even in an eccentric orbit until the orbital separation reaches the gyration radius of the two clusters, at which point both clusters merge to one.
keywords:
gravitation – stellar dynamics – methods: N-bodysimulations – galaxies: star clusters – globular clusters: individual: NGC2136 – globular clusters: individual: NGC21371 Introduction
The large Magellanic cloud (LMC) is a rich environment with many relatively young star clusters (Mackey & Gilmore, 2003b, a). Several of these clusters appear closer together on the sky than expected from statistical arguments, i.e, they look like binary clusters (Bhatia et al., 1991; Dieball et al., 2002). The LMC contains a total of 69 cluster pairs with a separation (Bhatia & Hatzidimitriou, 1988) which corresponds to pc by adopting distance modulus of 18.5 mag to the LMC (Groenewegen & Salaris, 2003), many of which have similar colors (Kontizas et al., 1988). The small Magellanic cloud also contains a relatively large number of paired clusters (Hatzidimitriou & Bhatia, 1990). Binary star clusters are expected to merge on a time scale of a few times 10 Myr (Bhatia & Hatzidimitriou, 1988), and NGC 2214 may be an LMC cluster in the process of merging (Bhatia & MacGillivray, 1988) (but see Banks et al. (1995) for counter arguments).
Well known examples of such binary clusters are SL 538/NGC 2006 (SL 537) (Dieball & Grebel, 1998), NGC 1850 (Fischer et al., 1993) and NGC 2136 (SL 762, at 5h 53m 17s; 32”)/NGC 2137 (Hilker et al., 1995). Confirmation of the binarity of such apparent pairs of star clusters should come from detailed measurements of their orbital parameters, rather than statistical arguments. However, with an orbital period of tens of million years such measurements are not trivial. In the Antennae galaxies (Whitmore et al., 2005; Fall et al., 2005) and in the young starburst galaxy M51 (Larsen, 2000; Bastian et al., 2005), star clusters appear to be formed in groups often consisting more than two. Apparently, star clusters in general are born in conglomerates in which several clumps tend to form within a relatively small time interval presumably initiated by galaxy-galaxy interactions. The individual star clusters in such conglomerates may subsequently merge in due time (Fellhauer & Kroupa, 2002; Fellhauer et al., 2002). Cluster binaries may form in a comparable environments, in which case their ages have to be at least comparable. Alternatively, a more massive cluster could possibly captures a lower mass cluster in a tidal event, resulting in two cluster with different ages. However, this process is likely to result in a single cluster rather than a binary (de Oliveira et al., 1999).
In this study we mainly concentrate on the two star clusters NGC 2136 and NGC 2137, which attract attention because the projected distance between them is only about 20 pc (1’.34) (Stein et al., 1994). In addition, both clusters have similar ages of about Myr (Dirsch et al., 2000) and identical metalicity (Hilker et al., 1995). With a primary mass of 26300–28200 (Mackey & Gilmore, 2003a) and a mass ratio , their orbital period is about 46 Myr. If bound, both clusters have orbited each-other about twice within their lifetime. Regretfully it is currently not known whether or not the clusters really form a bound pair, but at the moment this seems to be the most logical conclusion.
In this study we explore the initial conditions for which a pair of star clusters could survive until an age of about 100 Myr. We focus in particular on the observed pair NGC 2136 and NGC 2137 (Hilker et al., 1995), as they form an observational motivation for this exercise. Assuming that the two clusters form a bound pair we are able to limit the initial cluster parameters. We identify two main regimes in binary cluster evolution. Small initial orbital separation ( pc) tends to lead to a merger on a time scale of less than about 60 Myr, whereas large initial separation ( pc) causes the two star clusters to recede. Clusters with initially a larger separation become very vulnerable to disruption by passing other star clusters, giant molecular clounds or the background potential of the host galaxy. Between about 12 pc and 17 pc is a range of orbital separations between which the period changes little and in which the cluster binary is able to survive for more than 100 Myr. In these cases the change in orbital angular momentum by stellar mass loss and escapers is compensated by the redistribution of internal angular momentum in the rotation of the clusters.
2 Validation and analytic considerations
We perform direct -body simulations of binary star clusters using the kira integrator of the starlab simulation environment (Portegies Zwart et al., 2001). This -body code computes inter-particle forces by direct summation and the integration of the equations of motion is carried out with a fourth-order Hermite predictor-corrector scheme (Makino & Aarseth, 1992) with block time steps (McMillan, 1986). The greatest speed is obtained with the GRAPE-6 special purpose computer (Makino et al., 1997, 2003; Makino, 2004; Makino & Taiji, 1998) and we use the MoDeStA111see http://modesta.science.uva.nl platform in Amsterdam. Some of our calculations incorporate the evolution of single stars and binaries via the SeBa package (Portegies Zwart & Verbunt, 1996). However, since our simulations all started with single stars, binaries play a minor role as only a few are formed during the course of the simulations by 3-body dynamical capture (Aarseth & Heggie, 1976).
Following the stellar evolution package SeBa, stars more massive than about 25 turn into black holes in a supernova explosion, and stars more than about 8 turn into neutron stars. The latter receive a kick velocity upon formation from the Paczinsky-Hartman distribution with a dispersion of 300 (Hartman, 1997), black holes of mass receive kicks from the same distribution but with a dispersions of (see Portegies Zwart & Yungelson (1998) for details). During the simulation we keep track of the individual clusters by using a clump-finding algorithm (Eisenstein & Hut, 1998). Masses referring to the individual clusters when discussing the results in Tab. LABEL:Tab:Results are therefore an over estimate as the potential of a possible companion cluster is ignored in this procedure.
2.1 Binary-cluster evolution without stellar evolution
To test the merger time for binary clusters we started by reproducing the calculations of (Sugimoto & Makino, 1989; Makino et al., 1991). They performed for that time large scale N-body simulations using a tree code (Barnes & Hut, 1986) with a softening of . Here is the initial virial radius of the primary cluster. All stars in their models had the same mass and they ignored stellar evolution. The initial density profile for all simulations was a King (1966) model with , the tidal radius is then . When on a circular orbit with separation both clusters are initially in Roche-lobe contact. We summarize the initial conditions and results in Tab. LABEL:Tab:Makinoetal. These simulations are carried out in dimension less -body units (Heggie & Mathieu, 1986) in which . Here is the total cluster mass and is Newton’s constant.
| Model | ||||||||
|---|---|---|---|---|---|---|---|---|
| [] | ||||||||
| A | 2048 | 2048 | 10 | 0.0 | 370 | 0.95 | 270 | 0.93 |
| B | 2048 | 2048 | 6 | 0.5 | 190 | 0.96 | 150 | 0.95 |
| C | 4096 | 2048 | 6 | 0.0 | 105 | 0.97 | 100 | 0.96 |
| D | 4096 | 2048 | 6 | 0.0 | 145 | 0.97 | 120 | 0.96 |
When adopting the same initial conditions as Sugimoto & Makino (1989) and Makino et al. (1991) we reproduced their results. However, when adopting zero softening our clusters tended to merge somewhat earlier and the merger product was somewhat less massive (see Tab LABEL:Tab:Makinoetal for details). This is not unexpected as softening in the simulations has the effect of reducing close encounters causing the relaxation time for the cluster pair to increase. As a result, softening tends to reduce mass loss, by reducing the number of close encounters, and increases the merger time.
2.2 Analytical considerations
The relation between mass loss and angular momentum loss from the binary can be computed from the conservative assumption that both clusters are in synchroneous rotation. Since in our simulations the clusters are initially not rotating we then overestimate the rate of angular momentum loss.
The angular momentum of two point masses in a circular orbit is
| (1) |
Here , with and . The full differential can then be written as
| (2) |
With Kepler’s Kepler (1609) third law ()
| (3) |
we cen reduce Eq. 2 by eliminating the orbital velocity
| (4) |
With the assumption that mass is lost from the binary with angular momentum
| (5) |
Eq. 4 reduces to
| (6) |
Which, after integrating from the initial conditions to the final conditions results in
| (7) |
If mass is predominantly lost by stellar evolution and if both clusters have the same initial mass function, we may adopt that the mass ratio remains constant throughout the mass loss process. In this case Eq. 2 reduces to
| (8) |
which after making the same assumption about the amount of angular momentum lost per unit mass reduces to
| (9) |
Integrating between the initial and final parameters then gives
| (10) |
If mass is lost adiabatically and isotropically (i.e, ) Eq. 10 reduces to the classical result in which constant.
2.2.1 Results for the analytic prescription
With the above prescription we can calculate the orbital evolution of a binary star clusters in the absence of dynamical friction. In the presence of stellar evolution most mass is likely to be lost via the evolving stellar population.
To calculate the evolution of the cluster mass we adopte an initial mass function, for which we use a Salpeter (1955) between a minimum mass of and a maximum of . We now assume that all stars with a mass are lost from the clusters. The lifetime of a star of mass is calculated using the fit to detailed stellar evolution tracks by (Eggleton et al., 1989)
| (11) |
According to this methodology stellar remnants are lost from the cluster. As long as the cluster is younger than about 40 Myr this assumption does not result in an overestimate of the mass loss since black holes and neutron stars are likely to receive a velocity kick upon formation. As a result the majority of compact objects are ejected from the cluster in an early stage. At later time, when white dwarfs form, the use of Eq. 11 tends to overestiemate the mass loss, as white dwarfs tend to stay in the cluster. In fig. 1 we present the evolution of the cluster mass for several choises of .
In fig. 2 we present the evolution of the orbital separation under several assumptions for the amount of angular momentum carried away per unit mass (see Eq. 7). These calculations are performed under the assumption that the time scale for mass loss is long compared to the orbital period. We will later see that this is not a valid assumption in the first few tens of million years.


2.2.2 Results for two-body integration
To test the above derivation we implement the mass loss prescription adopted in § 2.2.1 and integrate the equations of motion of a two-body system. During integrating the equations of motion we allow the two point masses to lose mass. Note than since the prescription for stellar mass loss depends on physical scales we provide a scaling to stellar units to the 2-body integration.
To enable a direct comparison with the simulations reported in § 3 we perform our calculations with similar initial conditions. In figs 3 and 4 we present the evolution of the orbital parameters ( and , respectively) for two point masses. The initial orbit was circular, and we adopted a primary mass of 27500 and a mass ratio of and .
The mass loss prescription described in § 2.2.1 is then combined with the Salpeter (1955) initial mass function, from which we then can calculate the rate of mass loss. Calculations are performed with a maximum mass of and with a minimum of and . The evolution of the cluster mass for these parameters are presented in Fig. 1.

The orbital expansion (Fig. 3) is comparable to that of the analytic prescription using (see Fig. 2). The semi-major axis for the choise of increases more quickly than for . In this two-body approach, the friction between the clusters and possible transfer of stars from one to the other are ignored. As a result, the initial mass ratio and the initial orbital separation have little influence on the lifetime of the binary cluster. For orbital separations smaller than about 10 pc, it will turn out that dynamical friction has an important effect on the orbital evolution. We will quantify this in § 3 where we perform the full -body simulation of the binary star cluster.

In Fig. 4 we show the evolution of the orbital eccentricity of two orbiting objects. The initially circular orbit picks up a considerable eccentricity due to the copious mass loss in the first Myr.
At later time, for several simulations around 20 Myr, the orbital eccentricity reduces again. This is a conseqence of mass loss in an eccentric orbit. If mass is lost near apocenter the orbit tends to become less eccentric whereas mass loss at pericenter tends to increase the eccentricity. An orbit with a smaller initial mass ratio tends to become somewhat more eccentric than for a large mass ratio.
Our assumption that mass is lost adiabatically, clearly, is not supported by the 2-body simulations (see fig. 4). According to that hypothesis the orbit should remain circular. But mass in the first few 10 Myr is lost at such a high rate that it should in part be treated as an impulsive event.
Impulsive mass loss is a two body system tends to reduce the absolute value of the potential energy and the orbital kinetic energy by decreasing the mass of the system. Such sudden mass loss imposes no torgue on the system, so the angular momentum per unit mass remains the same, but the total angular momentum is reduces as a result of the decrease in the mass. Following (Hills, 1983) we can then calculate the orbital eccentricity if the total mass of the binary cluster drops from to . Assuming that the initial orbit is ciruclar the final eccentricity becomes (Hills, 1983).
| (12) |
3 The -body Simulations
We now focus on the -body simulations of binary star clusters. With the analytic analysis in § 2.2.1 and by integrating the 2-body systems in § 2.2.2 we have acquired some qualitative understanding of the range of initial conditions to search in order to reproduce the observed cluster pair NGC 2136/NGC 2137.
3.1 Setting up the realistic simulations
The main problem in generating proper initial conditions for NGC 2136/NGC 2137 is that we only approximately know the conditions at an age of about 100 Myr. In our simulations we will attempt to start with reasonable initial conditions and see what effect small changes to those have on the final configuration, and whether or not the final system has any resemblance with the observed cluster pair. We explain here how to obtain such initial conditions.
Assuming an initial mass function (Salpeter), age (80–120 Myr) and metallicity the mass of the primary cluster (NGC 2136) can be estimated from its observed luminosity (B = 10.99, V = 10.7) and turns out to be about –28200 (Mackey & Gilmore, 2003a). The secondary cluster (NGC 2137) is then with , about , i.e. the mass ratio . At a distance of about 50 kpc and with a separation between the two clusters of 1’.34, the current projected separation between the two cluster is pc. Assuming that their orbit is circular we can compute the tidal radii of the two clusters by estimating the size of their respective Roche radii with the approximated equation of Eggleton (1983). With the adopted parameters this result in a tidal radius for the primary cluster of pc, and for the secondary pc. The observed core radius of the primary cluster pc (Mackey & Gilmore, 2003a). It turns out that if we assume that the tidal radius for the primary cluster (NGC 2136) equals to its Roche radius, it has an unusually shallow density profile which cannot be described by a King (1966) model or a Plummer (1911) sphere. During the cluster lifetime its structure is likely to have changed quite substantially and we are unable to determine the initial density profile. For consistency with § 2.1 we adopt non-rotating King density profiles as the initial conditions for each of the two clusters in a binary.
We set up the simulations by determining the orbit of the two clusters. For clarity we adopt here model A_20 as an example, initial conditions for the other simulations are presented in Tab. LABEL:Tab:Results. We start by generating parameters for two point masses ( and , for the primary and secondary cluster, respectively) in a circular orbit with a orbital separation of pc. Later we replace the point masses with the two clusters. Each of the clusters is generated by selecting a number of stars for the primary and for the secondary cluster, both of which are sprinkled in a King (1966) model with and a virial radius of pc for the primary and pc for the secondary cluster. With these parameters both clusters are initially precisely filling their respective Roche lobes. We subsequently assign a random mass to each of the stars from a Salpeter initial mass function between and 100 , leading to a total mass of about for the primary cluster and for the secondary. We call this models A_20. Additional simulations are performed with larger total initial mass to compensate the mass loss from the evolving stellar populations. These other models (called B, C and D) are computed with a primary cluster mass of and . We repeated these simulations with varying from 10 to 20 pc, and we vary the minimum mass of the initial mass function from (model B), (model C) to (model D). To study the effect of the initial mass ratio we performed several additional simulations with , and . The initial conditions are summarized in Tab. LABEL:Tab:Results.
| Simulation | |||||||||||
|---|---|---|---|---|---|---|---|---|---|---|---|
| [] | [pc] | [Myr] | [pc] | ||||||||
| A_10 | 10 | 1.0 | 9000 | 1500 | 1.09 | 0.35 | 54 | 10499 | |||
| A_10Q03 | 10 | 1.0 | 7875 | 2625 | 1.01 | 0.41 | 50 | 10466 | |||
| A_10Q06 | 10 | 1.0 | 6300 | 4200 | 0.94 | 0.48 | 60 | 10441 | |||
| A_12 | 12.5 | 1.0 | 9000 | 1500 | 1.35 | 0.43 | 90 | 9449 | 932 | 11.2 | |
| A_15 | 15 | 1.0 | 9000 | 1500 | 1.63 | 0.52 | 82 | 9286 | 1214 | 18.4 | |
| A_15Q03 | 15 | 1.0 | 7875 | 2625 | 1.51 | 0.62 | 96 | 8093 | 2310 | 19.5 | |
| A_17 | 17.5 | 1.0 | 9000 | 1500 | 1.98 | 0.60 | 81 | 8961 | 1539 | 25.5 | |
| A_20 | 20 | 1.0 | 9000 | 1500 | 2.14 | 0.71 | 82 | 8948 | 1552 | 54.6 | |
| A_20Q03 | 20 | 1.0 | 7875 | 2625 | 2.02 | 0.83 | 87 | 7840 | 2655 | 32.4 | |
| A_20Q06 | 20 | 1.0 | 6300 | 4200 | 1.88 | 0.97 | 107 | 6215 | 4211 | 23.5 | |
| A_20Q10 | 20 | 1.0 | 5250 | 5250 | 1.42 | 1.42 | 117 | 5218 | 5207 | 26.6 | |
| B_20 | 20 | 1.0 | 13285 | 2215 | 2.14 | 0.71 | 51 | 13228 | 2272 | 32.5 | |
| C_15 | 15 | 0.63 | 19543 | 3257 | 1.62 | 0.51 | 100 | 20052 | 2566 | 16.9 | |
| C_20 | 20 | 0.63 | 19543 | 3257 | 2.14 | 0.71 | 100 | 19703 | 2978 | 29.5 | |
| D_20 | 20 | 0.50 | 24855 | 4145 | 2.14 | 0.71 | 73 | 25039 | 3911 | 23.1 | |
3.2 The evolution of simulation models A
We will now discuss the results for model A, and continue discussing models B, C and D in § 3.3. The mass lost by the primary and secondary clusters in model A_20 and D_20 are presented in fig. 5. For model C_20 we only present the result for the primary cluster. Over-plotted with thin curves are the results of a semi-analytic calculation presented in fig. 1. The two thin curves in fig. 5 follow the evolution of simulation models A_20 (and C_20) quite satisfactorily.

Mass loss from both clusters in the first few million years is negligible as only the most massive stars lose mass on the main sequence. After that the cluster loses mass rapidly, and its effect becomes quit important. By about 20 Myr the clusters have lost about 20% of their mass. The cluster mass loss closely follows the semi-analytic description we presented in fig. 1. Apparently little mass is lost in the form of escaping stars, consistent with the earlier simulations presented in § 2.1.
As we discussed in § 2.2 the copious mass loss in the first few tens of million years drives an expansion of the orbit and, since the time scale for mass loss and the orbital time scale are comparable the orbital eccentricity increases.
In simulation A_20, for example the combined effect of the adiabatic/impulsive mass loss induces an eccentricity of about in the first Myr, and the fact that the cluster approaches apocenter causes the distance between the two clusters to increase from 20 pc initially to pc at Myr. The induced eccentricity on the orbit is consistent with Eq. 12 (see also fig. 4), and also the evolution of the orbital separation is consistent with the 2-body simulations in § 2.2.2.

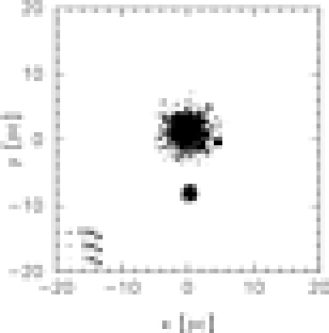
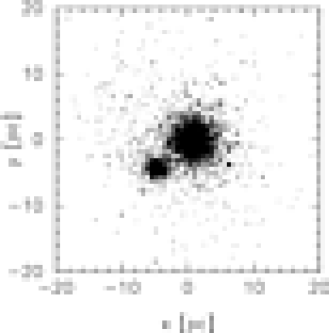
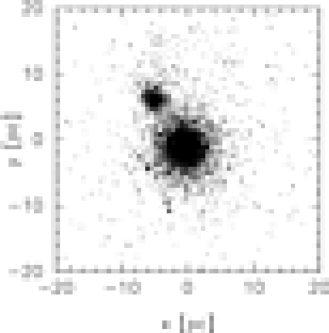
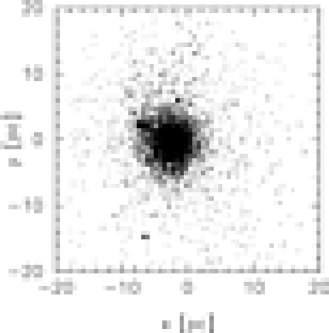
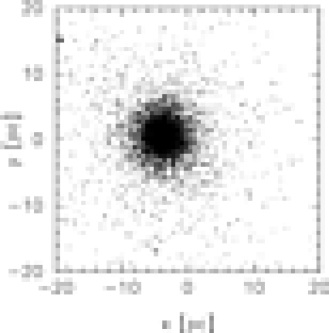
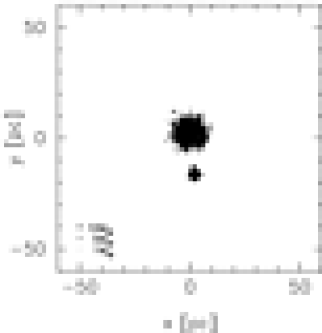
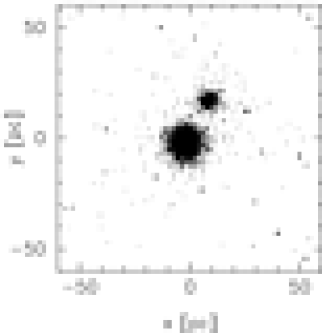
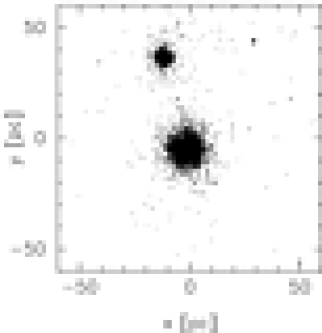
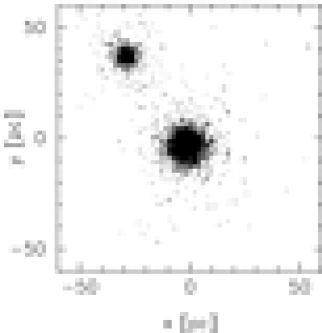
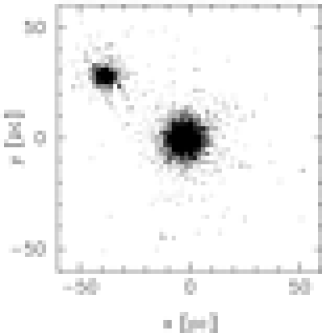
In fig. 7 we present a representation of the stellar positions for simulation model A_10 (top panels) and A_20 (bottom) at various moments in time. We stop both simulations when they reach an age of at least Myr. The three cluster pairs of model A_10 have merged before that time, whereas the distance between the two clusters of model A_20 has then increased beyond 50 pc.
The simulations in which the clusters are initially rather widely separated can satisfactorily be described by the semi-analytic analysis in § 2.2. In close proximity the transport of angular momentum from the orbit to the internal rotation becomes gradually more important (see § 2.1): tighter cluster binaries are able to transport angular momentum more effectively from the orbit to the rotation of the individual clusters, but also to stellar escapers. These dynamical interferences dramatically reduces the predictability of a simple semi-analytic model, because it is not apriory clear what amount of specific angular momentum in stored in the cluster. For close pairs, stellar mass loss appears to be relatively less important whereas the redistribution and loss of angular momentum dominates the evolution of the orbital parameters. This is illustrated in Fig. 6, where we present the evolution of the orbital separation for simulation models A with an initial separation of 20 pc, 17.5 pc, 15 pc, 12.5 pc and 10 pc (solid curves from top to bottom). The orbits of the clusters at 10 pc, 12.5 pc and 15 pc expand less dramatically than expected on the amount of mass lost from the evolving stellar populations.
The separation between the two clusters in models A_15 increases in the first Myr by mass loss and the orbital eccentricity increases but the loss of angular momentum prevent that the clusters continue to recede, as is the case in model A_20. In the latter model the two clusters approach periclustron again at about 140 Myr. Simulations A_12 to A_17 approach apoclustron at an age of about Myr, afther which their separations decreases again. These clusters can survive for a long time as binaries as they spiral-in only rather slowly. Once stellar evolution becomes less important (at a turn-off mass of i.e; after about 40 Myr) the dynamical redistribution of angular momentum becomes dominant again in driving the orbital evolution of the binary.
In simulation model A_10 (lower solid curve in Fig. 6) the stellar mass loss cannot compete with the loss of orbital angular momentum. The two clusters merge as soon as the gyro-dynamical instability sets in, which happens as soon as the gyration radius of the two clusters exceeds the orbital separation (see Eq.17 of Makino et al. (1991)). This happens at about 50 Myr. Stellar evolution in this case delays the merger by about a factor of two, but cannot prevent it. The gyration radius of a self gravitating system of stars can to first order be approximated with .
Clusters with an initial separation between about 12 and 18 pc, have the best change to survive to an age of Myr. In this range of initial separations the orbital evolution is strongly affected by stellar mass loss, but also by the redistribution of angular momentum, making this regime the most interesting to study numerically. If the orbital separation exceeds about 20–30 pc the background tidal field starts to perturb the orbital evolution of the cluster binary. In addition, clusters with such wide separations are also vulnerable to being ionized by passing giant molecular clouds, making such wide binaries unlikely to survive for an extensive period of time.
In the range in orbital separation between about 12 pc and 18 pc both clusters fill their respective Roche lobes throughout the simulation, and stars stream through the first Lagrangian point from the secondary cluster to the primary, and vice versa. Note that few stars are lost through the other Lagrangian points and we find no evidence for tidal tails in any of our simulations, contrary to what is observed in some apparent binary clusters in the LMC (Leon et al., 1999).
The number of stars transferred from one cluster to the other is generally small. By the end of the simulations a total of stars that are originally born in the primary cluster end up as members of the secondary cluster, whereas stars from the secondary cluster are found in the primary cluster (the error here is estimated from the dispersion between the different runs). The mass ratio of the binary remained roughly constant with time, as is illustrated in fig. 8. In this figure we present the evolution of the mass ratio for simulation model A_20 with various initial mass ratios. Also in the other simulations the mass ratio hardly changes with time (see Tab. LABEL:Tab:Results). The simulation without stellar mass loss (dotted curve in fig. 8) experiences the largest variation in mass ratio, as in this model stars effectively stream from the secondary to the deeper potential well of the primary cluster (see also Makino et al. (1991)).

For completeness, in fig. 9 we present the evolution of the orbital separation for some of the simulation models presented in fig. 8.

The behavior of the cluster binary is substantially affected by stellar mass loss, and the lower limit of the initial mass function is therefore an important parameter (see § 2.2). Mass loss in the early stage is governed by the choise of and the slope of the IMF. In the next section we will further explore the range in initial cluster separations for which stable binaries exist by varying the choise of .
3.3 The evolution of simulation models B, C and D
Mass loss in the early evolution of binary star clusters is of major importance (see figs. 2, 3, 5 and 6). Most mass is lost by the evolving stellar population and a different initial mass function may therefore have dramatic consequences to the orbital evolution of the binary. One of the effects of mass loss is that the simulated clusters in model A were substantially less massive than observed. To compensate for this we increase the initial mass of the primary cluster from 27500 to 40800 . Since the mass ratio for the more realistic models remains roughly constant with time (see fig. 8) we keep the same mass ratio of .
Much of the mass loss behavior in our simulation models is dominated by the choise of the lower limit to the initial mass function. Our adopted lower limit of can be considered on the high side (see however Smith & Gallagher (2001); Figer et al. (2002); Stolte et al. (2005)). We study the effect of reducing while increasing the number of stars to keep the total mass constant, but keeping all other parameters as much as possible the same. For a minimum mass we requires a total of 22800 stars, and for the total number of stars in the simulation increases to . For practical reasons we do not simulate larger clusters, though in principle it is possible to redo these simulations with a Kroupa (2001) initial mass fucntion with the hydrogen burning limit as a minimum mass. This would increase the number of stars in our simulation to , which is beyond the scope of the current paper.
The evolution of the mass of the primary cluster for models C_20 and D_20 are presented in fig. 5, and both match the observed mass of NGC 2136 and NGC 2137. We present the evolution of the orbital separation for these runs in fig. 10. For comparison we also show models A_20 with and without stellar mass loss. Due to the larger proportion of low mass stars in simulation model C_20 and D_20 stellar mass loss is less important than in model A_20. As a consequence the orbit (and clusters) expans less dramatically. In addition, the increased number of stars, and therefore the number density in the cluster, allows for angular momentum to be carried away by escapers more effectively. The result is a less pronounced increase in the orbital separation compared to model A_20 (see § 3.2). The induced orbital eccentricity is also smaller. For comparison with the observations we over-plot the projected distance between NGC 2136 and NGC 2137 in Fig. 10.

Over-plotted with the thin solid and dash-3-dotted curves in fig. 10 are the result of orbital expansion by solving the two-body problem which includes stellar mass loss (see § 2.2.2). The lower (thin) solid curve gives the orbial evolution of the 2-body results of model A_20, whereas the thick curve gives the results of the full -body simulation of the same model. We also show the 2-body and the full -body results for model C_20 (see the thin and thick dash-3-dotted curves, respectively). To illustrate the effect of the redistribution of angular momentum we also show the result of the full -body simulation of model A_20 but without stellar mass loss (dotted curve).
One expects naively that the -body integration should systematically overestimate the orbital expansion, but for model A_20, this is clearly not the case, as here the 2-body model falls short by about 40% with respect to the -body simulation (thick solid curve). The orbital expansion of simulation model C_20, however, is quite well reproduced with the 2-body solution. Remember here, however, that the semi-analytic models are rather simplistic, as the 2-body problem is solved without accouting for the drag and friction between the clusters and, ignores the possibility of the redistribution of rotational angular moment of the clusters and the orbital angular momentum, whereas Eq. 7 gives only an orbital average result.
The best match between the simulations and the observed clusters is obtained with an initial separation of about 20 pc with an initial mass function that extends to lower masses (0.5–0.6 ). For these models, also the total mass and the mass ratio of the clusters at an age of 100 Myr matches the observations quite satisfactorily. For model C_15 the orbital separation at an age of 100 Myr falls short of the observed separation. We therefore conclude that models C_20 and D_20 most satisfactorily reproduce the characteristics of the oberved cluster pair NGC 2136/NGC2137.
3.4 Evolution of the cluster structure
In figure 11 we present the evolution of the Lagrangian radii for simulation model C_20. Stellar mass loss has a dramatic effect on the evolution of the internal structure of the clusters. In particular the secondary cluster (thin lines in fig. 11) experiences a dramatic expansion in the first several 10 Myr due to stellar mass loss and internal dynamical evolution. Core collapse in this cluster occurs at about 2 Myr, for the primary cluster a shallow core collapse is reached at about 70 Myr. Due to the induced rotation by their mutual tidal coupling, the core collaps in both clusters may happen somewhat earlier than naively expected for isolated clusters. Rotation can initiate a gravogyro catastrophe through the transport of angular momentum (Akiyama & Sugimoto, 1989; Spurzem & Einsel, 1999).
The post collapse expansion of the secondary cluster exceeds the adiabatic expansion driven by stellar mass loss. Since the secondary cluster expands more quickly than the orbital separation it continues to over-fill its Roche lobe and transfer mass to the primary cluster, whereas the primary cluster detaches from its Roche lobe. As a result the orbital separation between 10 Myr and 40 Myr increases even more dramatically than naively expected from the rapid mass loss by stellar evolution alone (see fig. 10). It is interesting to note that the evolution of a binary cluster is governed by the more rapid dynamical evolution of the secondary cluster, contrary to stellar binaries in which it is generally the primary star which evolves first.

4 Discussion
We studied the evolution of bound pairs of star clusters by means of direct N-body simulations while including the effects of stellar mass loss. The initial parameters selected for our study are loosely based on the binary star cluster NGC 2136 and NGC 2137 in the large Magellanic cloud.
When starting with an initial cluster mass of about 40800 and 6800 in a circular orbit with a separation of 15–20 pc our simulations at about 100 Myr are consistent with the masses and orbital separation of the observed cluster pair. The observations are reproduced most satisfactorily when we adopt a Salpeter mass function with a lower mass limit of 0.5–0.6 , but lower mass cut-offs may also produce a satisfactory comparison with the observations.
A word of caution, however, is well placed here, as we did not cover the entire parameters space in excruciating detail. The initial density profile, not varied in our study, may have a profound effect on the evolution of the binary cluster. The main aim of this paper is therefore not to constrain the initial conditions for NGC 2136/NGC 2137, but rather to obtain a better understanding of the general evolution of binary star clusters. Earlier numerical studies of binary star clusters ignored the stellar mass spectrum, stellar evolution and used approximate N-body techniques (Sugimoto & Makino, 1989; Makino et al., 1991; de Oliveira et al., 1998). In our simulations all these effects are included in a self consistent fashion.
We are pleasantly surprised by the rich dynamics embedded in the evolution of binary star clusters. In particular the finding that stellar mass loss in the early evolution of the cluster is rapid enough to be considered a shock for the orbital elements of the binary cluster came somewhat unexpected. The consequence is that the orbits of star clusters with an age Myr are not circular, but small eccentricities are induced upon the orbit, even if the two clusters are in Roche-lobe contact. The evolution of the distance between the two clusters is than a consequence of the orbital evolution (adiabatic/impulsive expansion) and the fact that cluster pair aproaches apoclustron. Note, however, that all our models started with circular orbits. This choise was to limit parameters space as introducing an initial eccentricity also requires the choise of an eccentric anomaly.
Our initial clusters are not rotating. Since the redistribution of angular momentum turns out to be a mayor effect in the evolution of the cluster binary, future simulation may study the evolution of star cluster binaries by taking this extra parameter into account.
Another interesting aspect of our study that the less massive cluster is more likely to overfill its Roche lobe. The secondary cluster experiences core collapse in an earlier stage than the primary clusters. The resulting expansion of the post collapsed secondary cluster subsequently drives the transfer of mass through the first Lagrangian point to the primary cluster. Mass transfer proceeds from the less massive to the more massive component but the total number of stars transferred is relatively small (1–3%). The orbital evolution is dominated by stellar mass loss and by redistribution of angular momentum and by escaping stars
During the exchange of stars from one cluster to the other hardly any stars are lost through the second and third Lagrangian points. Stars do escape the clusters through the first Lagrangian point and isotropically. The isotropic escapers are mainly neutron stars which often receive high kick velocities in a supernova explosion. We therefore see no indication that tidal tails form in binary clusters. The origin of the tidal tails in several observed multiple clusters in the small Magellanic cloud by Leon et al. (1999) and de Oliveira et al. (2000) is therefore unlikely to be caused by the binarity of these clusters.
Binary star clusters in the LMC with a separation exceeding about 20 pc are vulnerable to ionization by giant molecular clouds. Our initial conditions approach this boundary. Such widely separated clusters can survive because the encounter rate between clusters in the LMC is rather small, making it unlikely that a cluster binary is ionized within a few times 10 Myr. However, as we demonstrated with our simulations, the orbital separation may increase considerably, making such clusters much more vulnerable to close (ionizing) encounters with other clusters or giant molecular clouds. Ionization by the background tidal field of the LMC is also possible. We did not take these effects into account in our simulations, but the consequences may be profound. One consequence is that there are (at least) two reasons why binary clusters in older populations are rare: close cluster pairs tend to merge and wide cluster pairs are likely to be ionized by the background tidal field or by passing Molecular clouds. Of course, we cannot exclude that binary clusters are simply rarely formed.
If the distance between the two clusters is initially sufficiently large that the redistribution of angular momentum and escapers has little effect on the orbital evolution, semi-analytic calculations about the orbital evolution of the binary cluster produce satisfactory results. As soon as dynamical effects start to become important (at separations pc) these approximations break down.
Acknowledgments
The first version of this paper was written in ’Taylor house’ and SPZ is grateful to Helen Thompson-Taylor for her wonderful hospitality. We are grateful to Alessia Gualandris, Thijs Kouwenhoven, Jun Makino and Steve McMillan for many discussions. SPR thanks the Astronomical institute ’Anton Pannekoek’ and the Section Computational Science of the University of Amsterdam for their hospitality. This research was supported in part by the Netherlands Organization for Scientific Research (NWO grant No. 635.000.001 and 643.200.503), the Netherlands Advanced School for Astronomy (NOVA), the Royal Netherlands Academy for Arts and Sciences (KNAW), the Leids Kerkhoven-Bosscha fonds (LKBF) by NASA ATP grant NNG04GL50G and by the National Science foundation under Grant No. PHY99-07949. All calculations are performed using the MoDeStA GRAPE-6 systems in Amsterdam.
References
- Aarseth & Heggie (1976) Aarseth S. J., Heggie D. C., 1976, A&A , 53, 259
- Akiyama & Sugimoto (1989) Akiyama K., Sugimoto D., 1989, Publ. Astr. Soc. Japan , 41, 991
- Banks et al. (1995) Banks T., Dodd R. J., Sullivan D. J., 1995, MNRAS , 274, 1225
- Barnes & Hut (1986) Barnes J., Hut P., 1986, Nat , 324, 446
- Bastian et al. (2005) Bastian N., Gieles M., Efremov Y. N., Lamers H. J. G. L. M., 2005, A&A , 443, 79
- Bhatia & Hatzidimitriou (1988) Bhatia R. K., Hatzidimitriou D., 1988, MNRAS , 230, 215
- Bhatia & MacGillivray (1988) Bhatia R. K., MacGillivray H. T., 1988, A&A , 203, L5
- Bhatia et al. (1991) Bhatia R. K., Read M. A., Tritton S., Hatzidimitriou D., 1991, A&AS , 87, 335
- de Oliveira et al. (1998) de Oliveira M. R., Dottori H., Bica E., 1998, MNRAS , 295, 921
- de Oliveira et al. (1999) de Oliveira M. R., Dottori H., Bica E., 1999, in Chu Y.-H., Suntzeff N., Hesser J., Bohlender D., eds, IAU Symp. 190: New Views of the Magellanic Clouds Star Cluster Encounters in the Magellanic Clouds. pp 443
- de Oliveira et al. (2000) de Oliveira M. R., Dutra C. M., Bica E., Dottori H., 2000, A&AS , 146, 57
- Dieball & Grebel (1998) Dieball A., Grebel E. K., 1998, A&A , 339, 773
- Dieball et al. (2002) Dieball A., Müller H., Grebel E. K., 2002, A&A , 391, 547
- Dirsch et al. (2000) Dirsch B., Richtler T., Gieren W. P., Hilker M., 2000, A&A , 360, 133
- Eggleton (1983) Eggleton P. P., 1983, ApJ , 268, 368
- Eggleton et al. (1989) Eggleton P. P., Fitchett M. J., Tout C. A., 1989, ApJ , 347, 998
- Eisenstein & Hut (1998) Eisenstein D. J., Hut P., 1998, ApJ , 498, 137
- Fall et al. (2005) Fall S. M., Chandar R., Whitmore B. C., 2005, ApJL , 631, L133
- Fellhauer et al. (2002) Fellhauer M., Baumgardt H., Kroupa P., Spurzem R., 2002, Celestial Mechanics and Dynamical Astronomy, 82, 113
- Fellhauer & Kroupa (2002) Fellhauer M., Kroupa P., 2002, Ap&SS , 281, 355
- Figer et al. (2002) Figer D. F., Najarro F., Gilmore D., Morris M., Kim S. S., Serabyn E., McLean I. S., Gilbert A. M., Graham J. R., Larkin J. E., Levenson N. A., Teplitz H. I., 2002, ApJ , 581, 258
- Fischer et al. (1993) Fischer P., Welch D. L., Mateo M., 1993, AJ , 105, 938
- Groenewegen & Salaris (2003) Groenewegen M. A. T., Salaris M., 2003, A&A , 410, 887
- Hartman (1997) Hartman J. W., 1997, A&A , 322, 127
- Hatzidimitriou & Bhatia (1990) Hatzidimitriou D., Bhatia R. K., 1990, A&A , 230, 11
- Heggie & Mathieu (1986) Heggie D. C., Mathieu R. D., 1986, LNP Vol. 267: The Use of Supercomputers in Stellar Dynamics, 267, 233
- Hilker et al. (1995) Hilker M., Richtler T., Stein D., 1995, A&A , 299, L37
- Hills (1983) Hills J. G., 1983, ApJ , 267, 322
- Kepler (1609) Kepler J., 1609, Astronomia nova. Vol. 1
- King (1966) King I. R., 1966, AJ , 71, 64
- Kontizas et al. (1988) Kontizas E., Metaxa M., Kontizas M., 1988, AJ , 96, 1625
- Kroupa (2001) Kroupa P., 2001, MNRAS , 322, 231
- Larsen (2000) Larsen S. S., 2000, MNRAS , 319, 893
- Leon et al. (1999) Leon S., Bergond G., Vallenari A., 1999, A&A , 344, 450
- Mackey & Gilmore (2003a) Mackey A. D., Gilmore G. F., 2003a, MNRAS , 338, 120
- Mackey & Gilmore (2003b) Mackey A. D., Gilmore G. F., 2003b, MNRAS , 338, 85
- Makino (2004) Makino J., 2004, Publ. Astr. Soc. Japan , 56, 521
- Makino & Aarseth (1992) Makino J., Aarseth S. J., 1992, Publ. Astr. Soc. Japan , 44, 141
- Makino et al. (1991) Makino J., Akiyama K., Sugimoto D., 1991, Ap&SS , 185, 63
- Makino et al. (2003) Makino J., Fukushige T., Koga M., Namura K., 2003, Publ. Astr. Soc. Japan , 55, 1163
- Makino & Taiji (1998) Makino J., Taiji M., 1998, Scientific simulations with special-purpose computers : The GRAPE systems. Scientific simulations with special-purpose computers : The GRAPE systems /by Junichiro Makino & Makoto Taiji. Chichester ; Toronto : John Wiley & Sons, c1998.
- Makino et al. (1997) Makino J., Taiji M., Ebisuzaki T., Sugimoto D., 1997, ApJ , 480, 432
- McMillan (1986) McMillan S. L. W., 1986, ApJ , 307, 126
- Plummer (1911) Plummer H. C., 1911, MNRAS , 71, 460
- Portegies Zwart et al. (2001) Portegies Zwart S. F., McMillan S. L. W., Hut P., Makino J., 2001, MNRAS , 321, 199
- Portegies Zwart & Verbunt (1996) Portegies Zwart S. F., Verbunt F., 1996, A&A , 309, 179
- Portegies Zwart & Yungelson (1998) Portegies Zwart S. F., Yungelson L. R., 1998, A&A , 332, 173
- Salpeter (1955) Salpeter E. E., 1955, ApJ , 121, 161
- Smith & Gallagher (2001) Smith L. J., Gallagher J. S., 2001, MNRAS , 326, 1027
- Spurzem & Einsel (1999) Spurzem R., Einsel C., 1999, in Merritt D. R., Valluri M., Sellwood J. A., eds, ASP Conf. Ser. 182: Galaxy Dynamics - A Rutgers Symposium Simulations of Star Clusters and Galactic Nuclei: Rotation and other Challenges. pp 105
- Stein et al. (1994) Stein D., Hilker M., Richtler T., 1994, in Astronomische Gesellschaft Abstract Series CCD Stroemgren photometry in the Magellanic Clouds. The binary star cluster NGC 2136/37.. pp 198–198
- Stolte et al. (2005) Stolte A., Brandner W., Grebel E. K., Lenzen R., Lagrange A.-M., 2005, ApJL , 628, L113
- Sugimoto & Makino (1989) Sugimoto D., Makino J., 1989, Publ. Astr. Soc. Japan , 41, 1117
- Whitmore et al. (2005) Whitmore B. C., Gilmore D., Leitherer C., Fall S. M., Chandar R., Blair W. P., Schweizer F., Zhang Q., Miller B. W., 2005, AJ , 130, 2104