e-mail: mzoccali@astro.puc.cl, dante@astro.puc.cl 22institutetext: Observatoire de Paris-Meudon, 92195 Meudon Cedex, France;
e-mail: Vanessa.Hill@obspm.fr, Aurelie.Lecureur@obspm.fr, Ana.Gomez@obspm.fr 33institutetext: Universidade de São Paulo, IAG, Rua do Matão 1226, Cidade Universitária, São Paulo 05508-900, Brazil;
e-mail: barbuy@astro.iag.usp.br 44institutetext: INAF - Osservatorio Astronomico di Padova, Vicolo dell’Osservatorio 2, I-35122 Padova, Italy;
e-mail: renzini@pd.astro.it 55institutetext: Università di Padova, Dipartimento di Astronomia, Vicolo dell’Osservatorio 5, I-35122 Padova, Italy;
e-mail: momany@pd.astro.it, ortolani@pd.astro.it
Oxygen abundances in the Galactic bulge: evidence for fast chemical enrichment
Abstract
Aims. We spectroscopically characterize the Galactic Bulge to infer its star formation timescale, compared to the other Galactic components, through the chemical signature on its individual stars.
Methods. We derived iron and oxygen abundances for 50 K giants in four fields towards the Galactic bulge. High resolution (R=45,000) spectra for the target stars were collected with FLAMES-UVES at the VLT.
Results. Oxygen, as measured from the forbidden line at 6300 Å, shows a well-defined trend with [Fe/H], with [O/Fe] higher in bulge stars than in thick disk ones, which were known to be more oxygen enhanced than thin disk stars.
Conclusions. These results support a scenario in which the bulge formed before and more rapidly than the disk, and therefore the MW bulge can be regarded as a prototypical old spheroid, with a formation history similar to that of early-type (elliptical) galaxies.
Key Words.:
Galaxy: bulge - Stars: Abundances, Atmospheres1 Introduction
The central regions of spiral galaxies, known as bulges, are made of stars in randomly oriented orbits for which two distinct formation processes have been proposed. In the so-called “classical bulges”, most stars originate in a short phase of star formation when the universe was only a few Gyr old. Instead, in the so-called “pseudobulges”, stars form in the disk over a more extended period of time, and the bulge results from the secular evolution of the disk driven by the development of a bar (Kormendy & Kennicutt 2004). It is currently believed that the pseudobulge mode dominates in late-type spirals (Sc and later) and the old-starburst mode (similar to the formation of elliptical galaxies) dominates in early-type spirals (Sb and earlier). The Sbc Milky Way galaxy sits on the borderline, and to establish the origin of its bulge (either old starburst or disk secular evolution), extensive spectroscopic observations have been undertaken to obtain precise element abundance ratios, in particular [Fe/H] and [O/Fe].
The detailed chemical composition of stars carries the signature of the enrichment processes undergone by the interstellar medium up to the moment of their formation. Thus, elemental ratios are sensitive to the previous history of star formation and can be used to infer whether there is a genetic link between different stellar groups. In particular, the relative abundances of iron and -elements play a key rôle because -elements are predominantly produced by Type II supernovae (SNII) while supernovae of Type Ia (SNIa) dominate instead the production of iron. The SNIIs come from massive, short-lived stars, while SNIas result from binary evolution and are characterized by a very broad distribution of delay times (from a few to over yr) between the star formation event and the SN explosion (Greggio 2005). As a consequence, the [/Fe] ratio depends on the relative contribution of SNIIs and SNIas, and therefore it depends on the timescale of star-formation and metal production (Matteucci & Greggio 1986).
Among the -elements, oxygen is especially important because produced only by SNII’s, and its forbidden line [OI] at 6300 Å is easily measured on the spectra of red giant stars. This line allows one to derive reliable abundances because its atomic parameters are well known; and since it is due to a transition from the ground state to a collisionally controlled higher level, it is not subject to non-LTE effects (Asplund et al. 2004). Based on this line, accurate measurements of the oxygen abundance in the Galactic thick and thin disk are also available (Bensby et al. 2004), while several efforts have been made to measure detailed abundances in the bulge (McWilliam & Rich 1994, 2003; Rich & Origlia 2005). However, the bulge data were rather scanty, and the resulting evidence was somewhat contradictory. To overcome these limitations, high quality spectra for a large sample of bulge stars are presented.
2 Observations and data analysis
| Nr. | Identification | RGC | E | ||
|---|---|---|---|---|---|
| (pc) | |||||
| 1 | Field | 0.21 | 850 | 0.48 | |
| 2 | Baade’s Window | 1.14 | 604 | 0.55 | |
| 3 | Blanco | 0.00 | 1663 | 0.20 | |
| 4 | NGC 6553 Field | 5.25 | 844 | 0.70 |
Spectra for a sample of K giants in four bulge fields have been collected at the VLT-UT2 with the FLAMES fibre spectrograph. All the stars were observed with the GIRAFFE arm of the instrument, with resolution R, while 58 of them have also been observed with the UVES arm, at higher resolution R, in the range 5800-6800 Å. A complete description of the whole GIRAFFE sample will be given elsewhere (Zoccali et al. 2006, in preparation), here we focus on the high-resolution UVES spectra, for which the S/N 50 per resolution element has allowed us to obtain accurate oxygen abundances. The bluer half of the UVES spectrum has lower S/N and was only used to derive carbon abundances from a C2 band at 5635 Å. Observed targets include 11 stars in a low reddening window at , 21 stars in Baade’s Window, 5 stars in the Blanco field at , and 13 stars in a field near the globular cluster NGC 6553 (Table 1). In the colour-magnitude diagram, these stars are located on the red giant branch, about 1 magnitude above the red clump, with the exception of 13 stars in Baade’s Window that instead are on the red clump itself.
Individual spectra were reduced with the standard FLAMES-UVES pipeline, including bias, flatfield, interorder background subtraction, extraction, wavelength calibration, and order merging. All the spectra for each star (a number between 7 and 17, depending on the field) were then registered in wavelength to correct for heliocentric radial velocity and averaged (rejecting the lowest and highest values) to a single spectrum per star. In each plate, one UVES fibre was allocated to an empty sky region. This spectrum was registered in flux to match the equivalent width of the sky emission lines of each object spectrum and then subtracted from it. The spectrum of a fast-rotating B star, thus containing only telluric absorption lines, was coadded to itself using different radial velocity shifts, reproducing the shifts applied to the target spectra to remove the heliocentric, variable component of the radial velocity. Stars with telluric absorption blended with the O line were rejected. Stars with such absorption in the wings of the O line were included with a different symbol. The strong sky oxygen emission line prevents a measurement of the oxygen stellar line when the radial velocity of the star is close to zero, and these stars were eliminated from the sample. In the end, 8 stars were discarded, leaving us with 50 stars.
All the stars have magnitudes, obtained either from photometry performed on wide field WFI images from the ESO 2.2m telescope at La Silla (fields 1,3,4) or from the OGLE catalogue (Udalski et al. 2002) (field 2). In addition, magnitudes are available for all of them from the 2MASS point source catalogue (Carpenter et al. 2001). The assumed reddening for each field is listed in Table 1, while standard extinction laws (Rieke & Lebofski 1985) were used to derive extinctions in the other bands. The five de-reddened magnitudes were combined to obtain photometric temperatures from , , , and colours, according to the latest empirical calibration (Ramírez & Meléndez 2005). The mean of the four values was used as a first guess for spectroscopic analysis. Photometric gravity was instead calculated from the classical relation
by adopting a mean distance of kpc for the bulge, T⊙=5770 K, =4.44, Mbol⊙=4.75, and M∗=0.85 M⊙.
The equivalent widths for selected lines of Fe, Na, Mg, Al, Si, Ca, Sc, Ti, and Ni were measured using the new automatic code DAOSPEC (Stetson and Pancino in prep.). The selection of clean Fe lines, and their atomic parameters was compiled using a spectrum of Leo as reference, observed at the Canada-France-Hawaii Telescope with the ESPaDOnS spectrograph, at resolution R=80,000 and S/N. The following parameters were determined for Leo: Teff=4550 K, logg=2.3, microturbulence velocity =1.3 km/s . Following Fulbright et al. (2006) we carried on our analysis relative to a nearby reference star; i.e., we derived relative log gfs using Leo as a reference, requiring [Fe/H]=+0.30 for each single line. More details on the analysis of Leo, the selection of clean lines, and the choice of its metallicity are given in Lecureur & al (2006). With the same atomic parameters, we obtain [Fe/H]= for Arcturus and [Fe/H]= ((Fe)⊙=7.55) for the Sun. This was then included as zero point for the iron determination of our target stars. Atomic parameters for the [OI] and NiI lines around 6300 Å were instead assumed to be identical to those employed in previous measurements for disk stars, so as to allow a meaningful comparison between bulge and disk abundance patterns (Table 2 in Bensby et al. 2004). For reference, the method outlined below returns [O/Fe]= and [O/Fe]= for the Sun and Leo, respectively. The damping constants were computed where possible, and in particular for most of the FeI lines, using the collisional broadening theory (Barklem, Anstee & O’Mara 1998, Barklem, Piskunov & O’Mara 2000).
The LTE abundance analysis was performed using well tested procedures (Spite 1967) and the new MARCS models (Gustafsson et al. 2002). Spectrum synthesis was performed with turbospec (Alvarez & Plez 1998) and counterchecked with Barbuy et al. (2003), including the effects of molecular lines on the derived atomic abundances, which is of special importance in the case of oxygen, due to the formation of CO molecules, locking part of the oxygen, and TiO molecules, changing the continuum shape. Excitation equilibrium was imposed on the FeI lines in order to refine the photometric Teff, while photometric gravity was imposed even if ionization equilibrium was not fulfilled. The reason for this choice is that FeII lines are all very weak and contaminated by CN. On the other hand, while the strong and differential reddening has a strong effect on the photometric Teff (why we prefer the excitation one), photometric gravity is robust. In fact, an error of implies an uncertainty of T in the photometric temperature but only logg=0.015 in the photometric gravity.
A synthetic spectrum was calculated for each star, with the parameters and Fe given above, adopting solar abundance (see below) as a first guess and then iterating until the oxygen line was reproduced well. Other elements whose abundance might affect the oxygen were also measured in the iterations, namely: carbon from the C2(0,1) bandhead of the Swan A-X system at 5635 Å, nitrogen from the CN band at 6498.5 Å, Ti, and Ni. The [C/Fe] ratio was found to range between 0.30 and +0.10 for our stars. The accuracy we have in these measurements is not very high ( dex), but we verified that a variation of dex in the adopted C implies a negligible variation in [O/Fe], except for the coolest stars at super-solar [Fe/H], for which it can introduce up to a 0.1 increase in [O/Fe]. Nitrogen, on the other hand, ranges between [N/Fe]=0.00 and [N/Fe]=+0.50. Particular care was taken in measuring Nickel, given that the [OI] 6300.304 Å line is blended with the two isotopic components of the NiI line at 6300.335 Å (Johansson et al. 2003). Thus isolated Ni lines were used to measure [Ni/Fe], and this value was assumed in the deblending of the [OI]6300 Å line. Standard solar abundances (Grevesse & Sauval 1998) were adopted as reference zero point for the abundances of bulge stars, except for the value of solar oxygen, where (O)⊙ = 8.77 was assumed (Allende Prieto, Lambert & Asplund 2001).
From the dispersion of Fe lines, we estimate a statistical error of 0.05 dex on Fe. On the other hand, a systematic error of 100K in Teff implies and a negligible effect on [O/H], while and a would be given by a +0.3 dex increase in log g.
A table with the complete list of parameters and abundances, including sodium, magnesium, and aluminum for each star will be published in a companion paper (Lecureur et al. 2006).
3 [O/Fe] ratios
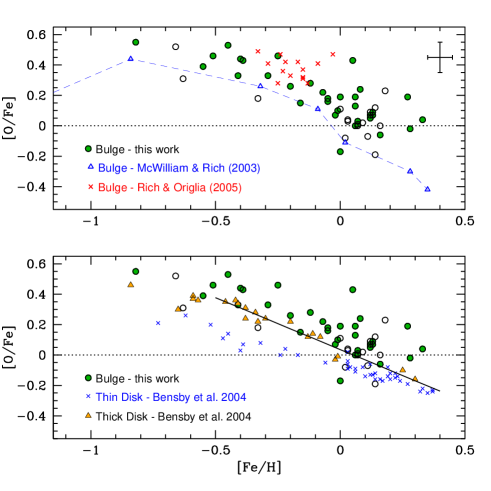
The resulting [O/Fe] vs. [Fe/H] plot is shown in Fig. 1. The upper panel shows the comparison between our measurements and recent oxygen abundance determinations for bulge stars. Earlier measurements (McWilliam & Rich 1994) are omitted here as more uncertain due to their much lower spectral resolution. A few corrections have then been applied to ensure consistency between our bulge abundances and those from previous determinations for bulge and disk stars. For the bulge optical data (McWilliam & Rich 2003), a shift of in [O/Fe] takes the difference in the adopted solar oxygen abundance into account, their (O)⊙=8.71 versus our 8.77, while a further +0.1 in [O/Fe] corrects for the different log= for the [OI] line, 0.1 dex lower than the one adopted here. Similarly, the bulge abundances from near-IR measurements (Rich & Origlia 2005) were shifted upwards by +0.06, due to their assumption of a higher solar oxygen, (O)⊙=8.83. This figure shows that our measurements do not conflict with previous results, but the larger size and metallicity coverage of the present sample allows us to draw much more robust conclusions.
The lower panel of Fig. 1 shows the main result of the present investigation: the [O/Fe] vs. [Fe/H] ratios in the bulge compared with those for the thick and the thin disks (Bensby et al. 2004). These measurements are as consistent as possible, in the sense that they come from the same line, and we have intentionally adopted the same atomic parameters both for oxygen and for nickel. The solar oxygen abundance to which the disk stars were referred was lower by 0.06 dex, so an identical downward shift was then applied to their measurements. This plot shows that the thin disk, thick disk, and bulge evolved through different chemical trajectories. In other words, bulge stars did not originate in the disk and then migrate inward to build up the bulge, but rather formed independently of the disk (Minniti 1995, Ortolani et al. 1995). Moreover, the chemical enrichment of the bulge, hence its formation timescale, has been faster than that of the thick disk, which in turn was faster than that of the thin disk (Matteucci, Romano & Molaro 1999).
A few stars in our sample show lower [O/Fe] than the mean locus of thick disk stars. Their number is consistent with the expected number of foreground disk contaminants. According to the Besano̧n model (Robin et al. 2003) and to the disk control field in Zoccali et al. (2003) the contamination fraction is 15 in all our fields except the Blanco one, where it is 45. All except two of these stars would indeed require stronger gravity according to the ionization equilibrium. Two extreme cases (logg3-4) have been excluded from the sample so are not shown here. We also excluded stars with radial velocity close to zero (with a sky emission line on top of the oxygen line), further biasing our sample against disk contaminants. We therefore conclude that the stars above the thick disk line in Fig. 1 are likely to be bona fide bulge stars.
It is evident from Fig. 1 that the dispersion in [O/Fe] for bulge stars is higher than for both thin and thick disks. While at least part of this effect is expected, given that disk stars are nearby, bright and isolated stars for which higher S/N spectra were obtained, the possibility that part of the dispersion is real cannot be excluded, given that in the bulge we are sampling stars in a region much larger than the solar neighbourhood. It is worth mentioning that no [O/Fe] gradient was present among the four different fields.
4 Conclusions
Age-dating of the bulge stars from their colour-magnitude diagram has already demonstrated that the bulk of them are older than Gyr, with no detectable trace of intermediate age stars (Ortolani et al. 1995; Kuijken & Rich 2002; Zoccali et al. 2003). Interpretation of the evidence now provided on the [O/Fe] ratios is that the formation of the Galactic bulge was faster than that of the disk and preceeded it. The most metal-rich bulge stars were the latest formed during the bulge evolution, and their ages correspond to the exhaustion of interstellar matter in the bulge. The present results reveal that the oxygen-to-iron starts to drop at the metallicity of [Fe/H]-0.2 due to the progressive enrichment by SNIa. A fast star formation rate is needed to explain this result.
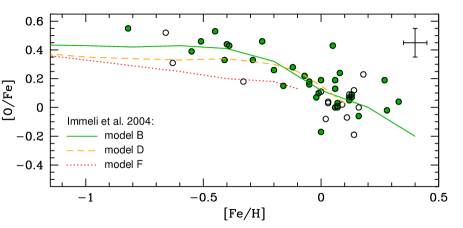
It should be noted that we have compared the elemental ratios of bulge stars to those of disk stars in the solar neighborhood. Strictly speaking, our result implies that the bulge stars did not originate in disk material (either already stellar or gaseous) coming from as far as the solar neighbourhood. Due to the possible presence of radial gradients in the disk, a comparison with stars in the inner disk would have been more conclusive. Unfortunately no such sample is available at the moment. An alternative approach to interpreting of these results is the comparison with theoretical simulations. In Fig. 2 we compare our results with the predictions of bulge [O/Fe] ratios by Immeli et al. (2004). They simulate the formation of galaxies from clouds with different dissipation efficiencies. The case with high dissipation (model B) rapidly forms massive clumps that spiral to the centre and merge to a central bulge component in a strong starburst. In contrast, when the dissipation efficiency is low (model F) the galaxy forms a thicker disk, and only at later times does instability set in, driving the formation of a bar and then a pseudobulge. Model D is the intermediate case. Clearly, our data can exclude model F, while it agrees with model B very well. This makes the MW bulge similar to early-type galaxies, in being -element enhanced, dominated by old stellar populations, and having formed on a timescale shorter than Gyr (Thomas et al. 2005). Therefore, like early-type galaxies the MW bulge is likely to have formed through a short series of starbursts triggered by the coalescence of gas-rich mergers, when the universe was only a few Gyr old.
Acknowledgements.
We thank Ortwin Gerhard for drawing our attention to the results of the Immeli et al. investigation. This work has been partly funded by the FONDAP Center for Astrophysics 15010003 (MZ and DM), DIPUC (MZ), and by a Fellowship of the John Simon Guggenheim Foundation (DM). DM acknowledges the European Commission’s ALFA-II programme, through its funding of the Latin-American European Network for Astrophysics and Cosmology (LENAC). BB and DM acknowledge grants from the CNPq and Fapesp. SO acknowledges the Italian Ministero dell’Università e della Ricerca Scientifica e Tecnologica (MURST) under the program ’Fasi iniziali di evoluzione dell’alone e del bulge Galattico’ (Italy).References
- (1) Allende Prieto, C., Lambert, D.L. & Asplund, M., 2001, ApJ, 556, L63
- (2) Alvarez R. & Plez B. 1998, A&A, 330, 1109
- (3) Asplund, M., Grevesse, N., Sauval, A.J., Allende Prieto, C. & Kiselman, D. 2004, A&A, 417, 751
- (4) Barbuy, B. et al. 2003, A&A, 404, 661
- (5) Barklem, P.S., Anstee, S.D. & O’Mara, B.J., 1998, PASA, 15, 336
- (6) Barklem, P.S., Piskunov, N.E. & O’Mara, B. J., 2000, A&AS, 142, 467
- (7) Bensby, T., Feltzing, S. & Lundström, I., 2004, A&A, 421, 155
- (8) Carpenter, J.M. 2001, AJ, 121, 2851
- (9) Dean, J.F., Warpen, P.R. & Cousins, A.J. 1978, MNRAS, 183, 569
- (10) Fulbright, J.P., McWilliam A. & Rich R.M., 2006, ApJ, 636, 821
- (11) Gratton, R.G., & Sneden C., 1990, A&A, 234, 366
- (12) Greggio, L. 2005, A&A, 441, 1055
- (13) Grevesse, N. & Sauval, J. 1998, Space Sci. Rev., 85, 161
- (14) Gustafsson, B., Edvardsson, B., Eriksson, K., Mizuno-Wiedner, M., Jorgensen, U.G., Plez, B. in Stellar Atmosphere Modeling (I.Hubeny, D.Mihalas, K.Werner eds.) ASP Conf. Ser. 2002, Vol. 288, , p. 331
- (15) Immeli A., Samland M., Gerhard O. & Westera P. 2004, A&A 413, 547
- (16) Johansson, S., Litzén, U., Lundberg, H. & Zhang, Z. 2003, ApJ, 584, L107
- (17) Kormendy, J., & Kennicutt, R.C.Jr. 2004, ARA&A, 42, 603
- (18) Kuijken, K. & Rich, R.M. 2002, AJ, 123, 2054
- (19) Martin, W.C. et al. NIST Atomic Database (version 2.0). National Institute of Standards and Technology, Gaithersburg, MD. 2002 (http://physics.nist.gov/asd)
- (20) Matteucci, F. & Greggio L. 1986, A&A, 154, 279
- (21) Matteucci, F., Romano, D., Molaro, P., 1999, A&A, 341, 458
- (22) McWilliam, A. & Rich, R.M. 1994, ApJ, 91, 749
- (23) McWilliam, A. & Rich, R.M. 2003, in Origin and Evolution of the Elements (http://www.ociw.edu/ociw/symposia/series/symposium4/proceedings.html)
- (24) Minniti D., 1995, AJ, 109, 1663
- (25) Ortolani S., et al. 1995, Nature, 377, 701
- (26) Ramírez, I. & Meléndez, J., 2005, ApJ, 626, 465
- (27) Rich, R.M. & Origlia, L., 2005, apJ, 634, 1293
- (28) Rieke, G.H. & Lebofsky, M.J., 1985, ApJ 228, 618
- (29) Robin, A.C., Reylé, C., Derrière S., & Picaud S., 2003, A&A, 409, 523
- (30) Spite, M., 1967, Annales d’Astroph., vol. 30, p.211
- (31) Thomas, D., Maraston, C., Bender R., Mendes de Oliveira, C., 2005, ApJ, 621, 673
- (32) Udalski, A. et al., 2002, Acta Astron., vol. 52, 217
- (33) Zoccali, M. et al. 2004, A&A, 423, 507
- (34) Zoccali, M. et al. 2003, A&A, 399, 931