A Distributed Population of Low Mass Pre-Main Sequence Stars near the Taurus Molecular Clouds
Abstract
We present a drift scan survey covering a 5o 50o region toward the Southern portion of the Taurus-Auriga molecular cloud. Data taken in the filters with the Quest-2 camera on the Palomar 48-inch telescope were combined with 2MASS near-infrared photometry to select candidate young stars. Follow-up optical spectroscopy of 190 candidates led to identification of 42 new low mass pre-main sequence stars with spectral types M4-M8, of which approximately half exhibit surface gravity signatures similar to known Taurus stars while the other half exhibit surface gravity signatures similar to members of the somewhat older Upper Sco, TW Hya and Beta Pic associations. The pre-main sequence stars are spread over 35o, and many are located well outside of previously explored regions. From assessment of the spatial and proper motion distributions, we argue that the new pre-main sequence stars identified far from the clouds cannot have originated from the vicinity of the 1–2 Myr-old subclusters which contain the bulk of the identified Taurus members, but instead represent a newly-identified area of recent star-formation near the clouds.
Subject headings:
open clusters and associations: individual (Taurus) – stars: low mass, brown dwarfs – stars: pre-main sequence1. Introduction
The Taurus-Auriga molecular cloud complex has, for decades, been considered the quintessential example of low density, isolated star formation. This fact along with the proximity of Taurus (140 pc) and its position in the northern hemisphere has caused Taurus to be one of the most often studied star-forming regions. Several authors (e.g., Briceño et al. 1999, Luhman 2000, Briceño et al. 2002, Luhman et al. 2003, Luhman 2004, Guieu et al. 2006) have used optical/near-infrared/x-ray imaging to identify young star candidates within the clouds. Follow-up optical spectroscopy of photometrically-selected candidates can distinguish members of Taurus from foreground or background field interlopers. These studies found the Taurus population is clustered into several loose aggregates (Gomez et al. 1993), and is predominantly very young ( 1–2 Myr; e.g., Briceño et al. 1998, Hartmann 2000). Thus far, no conclusive evidence has been established for a widespread population of older stars within or near the cloud (Briceño et al. 1999).
The phenomenon of short timescale (1–2 Myr) clustered star-formation is not unique to Taurus but has been found in almost all other nearby young associations (e.g., Carpenter 2000, Palla & Stahler 2000). The large numbers of very young stars and apparent lack of more evolved (5–10 Myr-old) objects in star forming regions contrasts with ages of a few tens of megayears (e.g., Blitz & Shu 1980) inferred for molecular clouds. Either star-formation takes place for only a small fraction of the cloud lifetime, or molecular clouds themselves live only a few megayears (e.g., Hartmann et al. 2001). This problem has been discussed in the literature for almost three decades, and is commonly known as the ‘Post T-Tauri Star Problem’ (Herbig 1978).
An alternative explanation for the apparent lack of older stars in molecular clouds is that such objects have been missed in previous surveys. Limitations in telescope time and instrument fields of view have constrained most previous deep imaging surveys in Taurus (e.g., Briceño et al. 1999, Luhman 2000) to small areas focused on subclusters (each 1 pc wide) that contain most of the known young members. Assuming a mean velocity dispersion of 2 km/s (Hartmann et al. 1986), a putative population of 5–10 Myr old stars in Taurus could travel up to 20 pc (8 deg) away from its birth site.
Several studies (e.g., Neuhäuser et al. 1997, Wichmann et al. 1996) have attempted to use the ROSAT All Sky Survey (RASS) with spectroscopic follow-up to identify G–mid K type post T-Tauri Stars (stars with ages 3–10 Myr; PTTSs) far from the current Taurus members. These observations revealed a distributed population of lithium-rich stars (indicating that they are younger than 100 Myr) that are widely dispersed across the cloud and beyond. However, because both the decay of x-ray emission and the depletion of lithium occur slowly for G–type stars with ages 100 Myr, these data alone cannot discriminate whether the RASS-selected stars represent a 1 Myr-old or 10 Myr-old Taurus population, or a 100 Myr-old population that originated elsewhere. Consequently, the origin of these stars and their relation to Taurus is still controversial (e.g., Briceño et al. 1997). The largest optical/near-infrared imaging survey to date that searched for Taurus members is that of Luhman (2006) who used a combination of USNO and 2MASS magnitudes to find young brown dwarfs within a 1515 square degree region centered on the known 1 Myr-old subclusters. The survey was aimed specifically at identifying young brown dwarfs with colors and magnitudes similar to known 1 Myr-old substellar Taurus members and was not targeted at finding older objects or comparably-aged low mass stars.
We have completed a new optical imaging survey of 250 deg2 near the Taurus molecular clouds. The specific survey area was chosen to include both well-known subclusters of stars and regions beyond previously studied parts of the cloud. The current work is a companion survey to a photometric and spectroscopic study we have carried out in the Upper Scorpius star-forming region (Slesnick, Carpenter, & Hillenbrand 2006; hereafter SCH06) where we identified 43 new brown dwarfs and low mass stars. Our primary goal in Taurus is to search for and characterize a possible distributed population of pre-main sequence (PMS) stars within and surrounding the clouds. We combine the Taurus photometric data with 2MASS photometry to select candidate young stars (Section 2). In Section 3 we present newly obtained spectral data for 190 of these candidates from which we identify a population of 42 low mass PMS objects. We assess the spatial and proper motion distributions of the new population in Section 4 and discuss why these objects may have been missed in previous surveys.
2. Quest Imaging Observations
2.1. Photometric Monitoring and Data Processing
observations were obtained with the Quest-2 Camera (Rabinowitz et al. 2003) on the 48-inch Samuel Oschin Schmidt Telescope at Palomar Observatory. The Quest-2 camera is a large-area mosaic consisting of 112 CCDs arranged in four columns of 28 detectors. The camera covers a 3.64.6o field of view, and taking into account gaps between columns and chips, the instantaneous on-sky coverage is 9.4 deg2. Each of the four columns views the sky through a separate filter (Johnson or in this case, though our data are calibrated to the Sloan photometric system; see below). We operated the camera in drift scan mode where the final data product is a strip of uniform width in declination and time-dependent length in RA that has been imaged in four filters.
One strip covering the RA range 4090o and spanning 4.6 deg in declination centered on =22.5o was observed twice per night on the nights of 27-30 November 2003 and 4-5 December 2003 for a total of 12 scans of the same portion of the sky. This spatial area includes the young regions of L 1536 and L 1529, as well as the Pleiades open cluster (=57o, =24o). The CCDs are less sensitive in the -band than anticipated and few sources were detected. We therefore exclude the data from the remainder of this discussion. Fourteen of the 84 CCDs have failed since installation due to bad connections or faulty chips, rendering our spatial coverage within the survey region non-uniform.
Data reduction, source extraction, and photometry were carried out using the Yale reduction pipeline as outlined in SCH06. After bias subtraction, dark correction and flat fielding (see SCH06 for more details), the pipeline performs aperture photometry for all stars through an aperture of half-width 3.5 pixels. We have matched detections within a 0.8” radius from the 12 different scans of the survey region. For each source we averaged coordinates from individual scans. The typical astrometric RMS deviation about the mean is 0.13” for stars detected in at least half of the scans. The average offset between Quest-2 and 2MASS coordinates (see Section 2.2) is +0.2” in RA and +0.04” in Dec.
To account for non-linearity and pixel-to-pixel variations within a chip, and zero point and color variations between chips, we matched a subset of data (600,000 stars) taken by the Quest-2 collaboration (Rabinowitz et al. 2003) in a different part of the sky (-2.5, 120) to the Sloan Digital Sky Survey (York et al. 2000). For each of the Quest-2 CCDs we computed a conversion from Quest-2 to Sloan magnitudes in the form of:
,
where are constants and ‘’ refers to a row of pixels (perpendicular to the drift scan direction) on the CCD. Only stars with both Sloan and Quest-2 photometric uncertainties 0.1 mag, and instrumental Quest-2 magnitudes between 11.5 19 and 14 21 were used to derive the calibrations. Constants were computed in discrete bins of 0.75 mag, 50 pixels and 0.2 mag in color and determined in an iterative manner for each equation above until each constant changed by 0.0005 mag for at least 3 iterations. We applied the derived calibrations to the Taurus scans by linearly interpolating between values in each parameter.
The Taurus data were taken primarily under non-photometric conditions. However, because the data consists of repeated scans, self-calibration is possible. To account for variable conditions during a night or from night to night, we applied a photometric offset as a function of RA to each scan. For a given CCD, the Yale reduction pipeline divides a drift scan into discrete frames 2048 pixels in length. Due to edge effects, along with the fact that some of the data were taken through thick clouds (2 mag of extinction), most sources were not detected in all 12 scans. The ‘best’ (i.e., most photometric) scan, taken on 27 Nov 2003, was used to define the photometric reference system. We selected a subset of 100,000 stars from the source catalog that were detected in at least 6 of 12 scans (including the reference scan) and had no neighbors within 5”. For each such star we computed the difference between the reference magnitude and the magnitude measured in an individual scan.
For every chip and scan we created a catalog of photometric offsets by stepping through in RA every 5 local calibrator stars (typically spanning0.5 deg) and calculating a median offset value between an individual scan and the reference scan. Typical values were 0.18 mag in , 0.15 mag in , or 0.23 mag in . We applied these offsets to the entire data set as a function of RA, scan, and CCD by linearly interpolating between values in RA. Offsets as a function of declination were also computed. However, upon examination, we found no systematic structure in the declination offsets and thus, only the RA offsets were necessary.
The photometric precision can be assessed from the repeatability of observations for individual stars. For each source, we computed an uncertainty-weighted average and RMS deviation of individual calibrated measurements. The RMS deviation can be affected by many factors, including photometric noise, uncertainties in the derived Quest-2–to–Sloan calibrations or scan-to-scan weather calibrations, and intrinsic photometric variability of the star. Because the 112 CCDs within the mosaic are of varying quality, defining ‘typical’ RMS deviation is meaningful only on a chip-by-chip basis. From analysis of RMS values as a function of magnitude for all CCDs, average RMS values for most chips range from 0.03 to 0.1 mag for stars brighter than 20 and 21, and are as high as 0.2 mag for a few CCDs. Scatter increases toward fainter magnitudes as expected (see Fig. 2 in SCH06).
The accuracy of the absolute photometry is harder to quantify. While we have accounted for relative extinction due to weather within our dataset, we are not able to account for zero point shifts between the Taurus drift scans and the scans used to derive the Quest-2–to–Sloan calibrations. Despite this fact, comparison of the average color for the calibrated Quest-2 photometry agrees to 0.01 mag with the average color of the 600,000 stars from Sloan used to derive the calibrations. Therefore, while we cannot claim the photometry is on a standard Sloan system, it should be fairly closely aligned with Sloan. Nevertheless, we select candidate PMS stars based on a combination of Quest-2 optical colors and absolute 2MASS near-infrared colors (see Section 2.2). The final source catalog contains 2.2 million sources within the 250 deg2 survey region with both – and –band photometry.
2.2. Candidate Pre-Main Sequence Selection
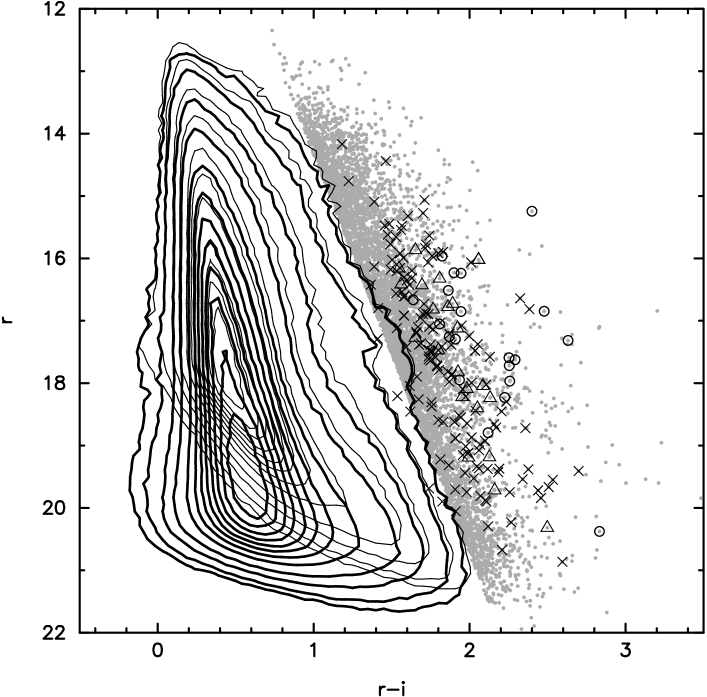
Our goal is to use the photometry to isolate PMS stars both within and surrounding the Taurus clouds from the field star population which dominates the source catalog. Nearby young stars still undergoing contraction are systematically more luminous than their main-sequence counterparts, and will therefore occupy a sequence in an optical color-magnitude diagram (CMD) that is correspondingly brighter than the sequence occupied by most of the field stars. Due to challenges in calibrating the photometric data to a standard system, we were reluctant to choose candidates based on the colors and magnitudes that correspond to particular isochronal ages. For the initial spectroscopic observations we considered for candidate PMS stars all sources redward of a linear approximation of the 1% data contour in an CMD (see Fig. 1).
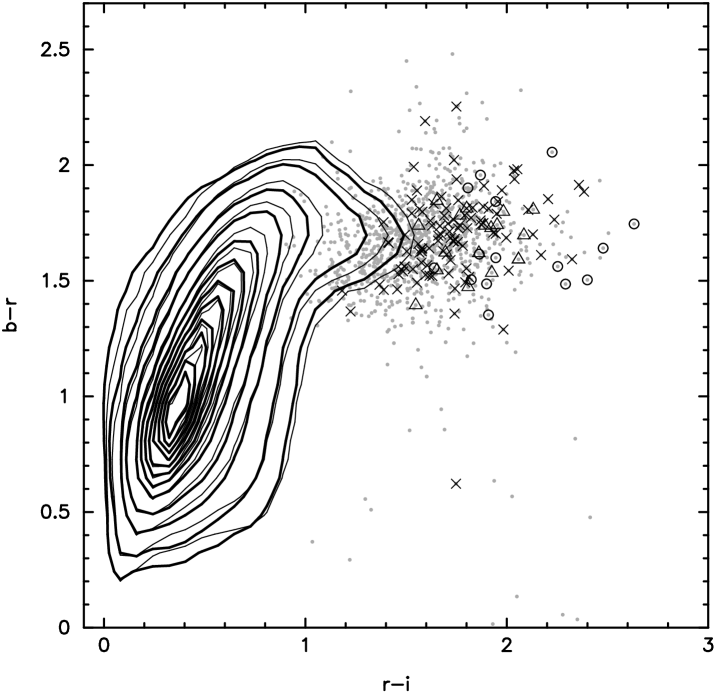
In addition to optical colors, the infrared colors and magnitudes of potential PMS candidates were also considered. We matched the entire source catalog to 2MASS and excluded from further consideration 1.2 million sources which did not have a 2MASS counterpart. In Fig. 1, optical CMDs for all sources, and for sources with a 2MASS counterpart are shown. As discussed in SCH06, requiring a 2MASS detection biases the list of potential PMS candidates against faint blue sources but does not exclude red objects bright enough to be observed spectroscopically at Palomar (20.5). The position of each star on a near-infrared color-color diagram was examined and any star with colors consistent with those of background giants [ or ] was excluded. We additionally considered colors and adopted the selection criterion as outlined in SCH06. After all selection criteria were applied, the final candidate list contains 1800 stars for spectroscopic follow-up.
Although –band data was not used in candidate PMS selection, 60% of our candidates and 136 out of 190 objects observed spectroscopically (see Section 3) have a detection. Fig. 2 shows an vs. color-color diagram for all stars with detections, and for stars which additionally have 2MASS detections. Data with –band detection meeting the selection criteria outlined above are shown as discrete points. In principle –band (and –band) photometry could be used to select candidate young stars based on blue excess attributed to accretion (e.g., Rebull et al. 2000), though we have not implemented any such criteria in the present work.
3. Optical Spectroscopy
Moderate-resolution spectra of 190 candidate PMS objects (chosen from the 1800 candidates discussed in Section 2.2) were taken with the Double Spectrograph on the Palomar 200-inch telescope on the nights of 2004 9-11 Dec and 2005 23-27 Nov. Candidates were prioritized by color with redder candidates observed first, and targets were selected primarily from the magnitude range 1519. The spatial distribution of observed stars is discussed in Section 4.1. Data were taken with the red side of the spectrograph through a 2” slit using a 5500Å dichroic and a 316 lines mm-1 grating blazed at 7500Å . This set-up produced wavelength coverage from 6300–8825Å at a resolution of 1250. Typical exposure times were 300–900 sec, and up to 1800 sec for the faintest targets (21). Spectrophotometric standard stars (Massey et al. 1988) were observed throughout each night for flux calibration. All sources were processed, extracted and calibrated using standard IRAF tasks.
In addition to our program targets we have also observed a range of spectral main sequence standards (K5-L3), giant standards (K7-M9), and previously identified Taurus objects (K3-M7.25; Briceño et al. 2002, Luhman 2004). We observed several members of the Hyades (650 Myr; Lebreton et al. 2001), Pleiades (115 Myr; Basri, Marcy, & Graham 1996), AB Dor (75–150 Myr; Luhman et al. 2005), Beta Pic (11 Myr; Ortega, et al. 2004) and TW Hya (8 Myr; de la Reza et al. 2006) associations. In the SCH06 survey we observed 50 members of the 5 Myr Upper Scorpius association. Together, these observations provide a large set of late spectral type (K–M) standards spanning a broad range of age (surface gravity).
3.1. Spectral Analysis
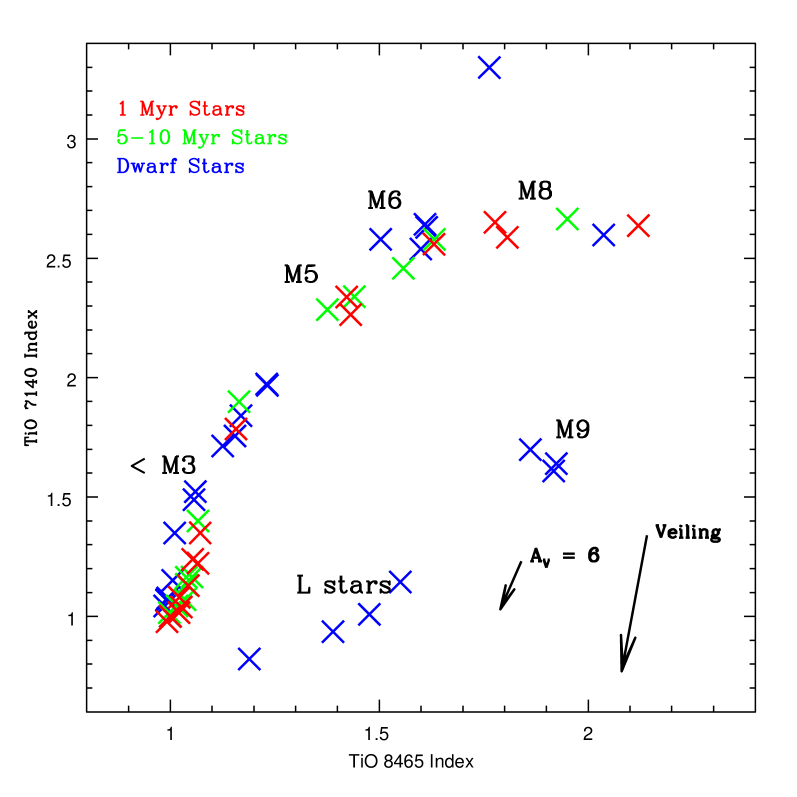
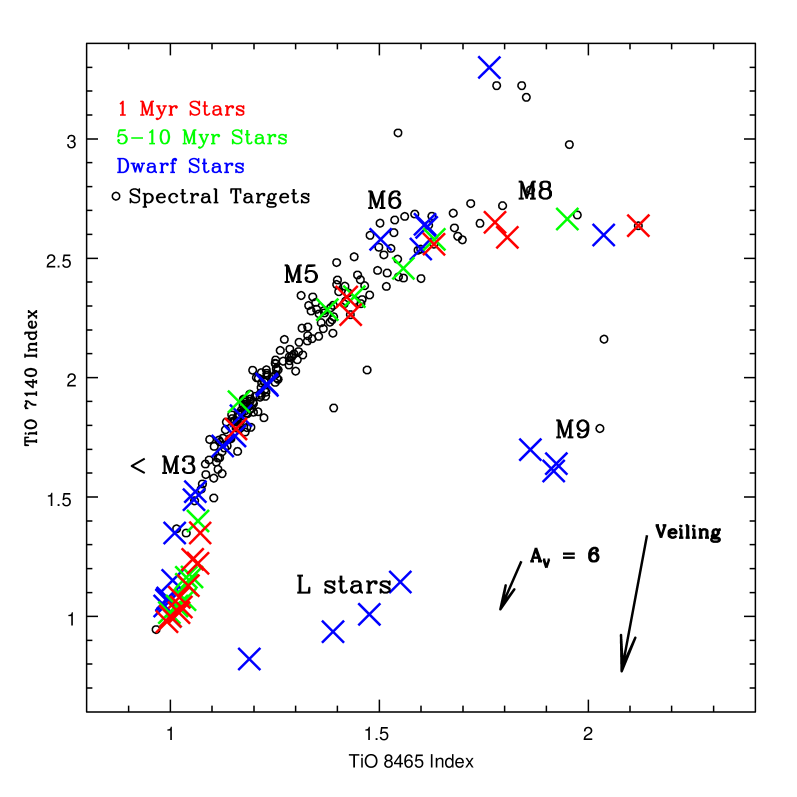
A detailed discussion of our classification methods is given in SCH06, and thus only a summary is provided here. We use the strength of titanium oxide (TiO) absorption which increases from mid-K through M7 spectral types (see Fig. 8 of SCH06) as the primary spectral type diagnostic. We have adopted from the literature two spectral indices that measure the strength of TiO features: TiO-7140 ( with bandwidths of 50Å; Wilking et al. 2005) and TiO-8465 ( with bandwidths of 20Å; SCH06). The left side of Fig. 3 shows a plot of TiO-8465 vs. TiO-7140 for observed spectral standards. This diagram is useful for classifying stars with spectral types M3–L3. No significant age dependence exists between measured TiO indices of older stars (ages 75 Myr; blue X’s) and young (ages 1–2 Myr; red X’s) or intermediate-age (ages 5–10 Myr; green X’s) PMS standard stars.
Measured indices for program sources are shown in the right side of Fig. 3. The measurements predominantly follow the locus determined by the spectral standards. Two outliers sit below the primary sequence of data points. Both objects are confirmed to be young stars (see below) with strong H emission and we attribute their position in Fig. 3 to a small amount of veiling present in their spectra (see Section 3.2). Spectral types were first estimated from quantitative analysis of the measured TiO indices. More weight was given to the TiO-8465 index, which is the less sensitive of the TiO indices to the effects of reddening and veiling (Section 3.2). Final spectral types were confirmed after visual inspection of each spectrum in comparison to spectral standards.
In addition to determining spectral types it was also necessary to determine which of the candidates are bona fide PMS stars. Because young stars are still undergoing contraction to the main sequence, they have systematically lower surface gravity than older main sequence stars. We therefore use surface gravity to roughly define stellar age. Several diagnostics of surface gravity exist in this wavelength regime which can be assessed in low and moderate resolution spectra. The most prominent gravity-sensitive features in the Palomar spectra are K I (7665 and 7669 Å) and Na I (8183 and 8195 Å) absorption doublets.
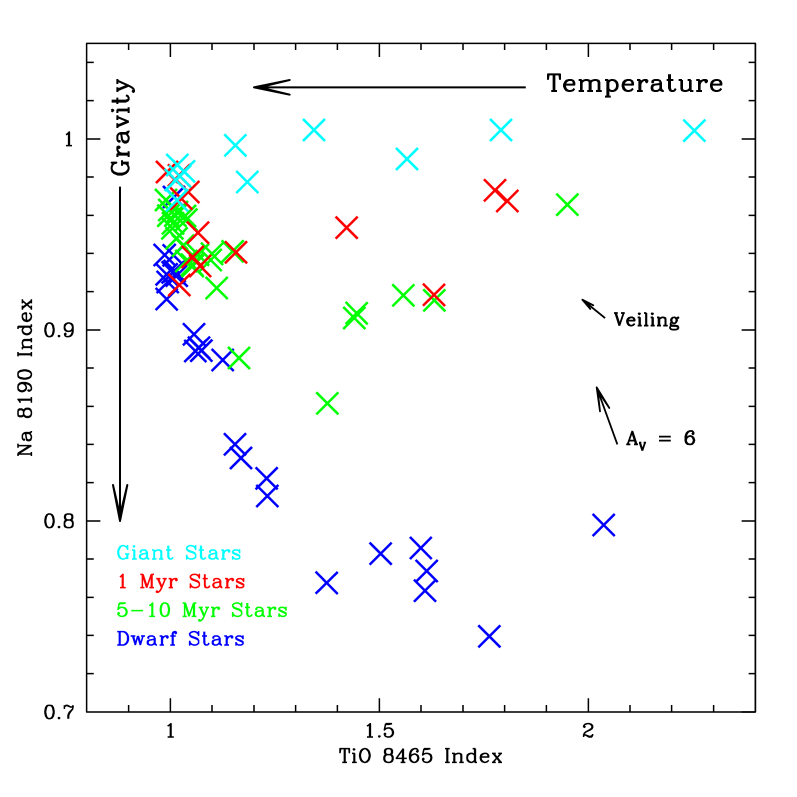
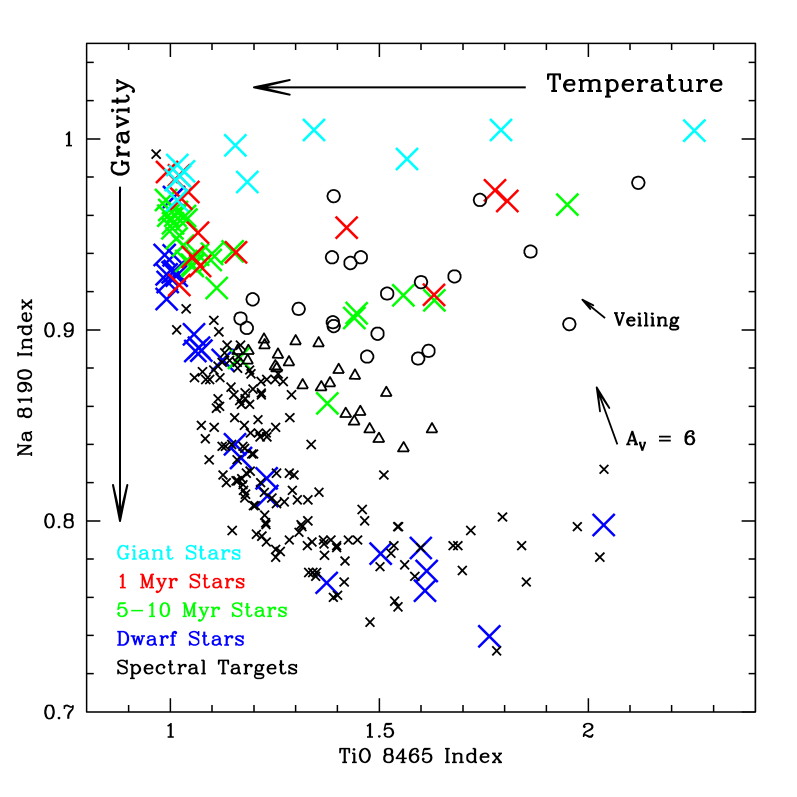
We assess surface gravity quantitatively by using the gravity-sensitive Na-8189 index ( with bandwidths of 30Å; SCH06) to measure the strength of the Na I doublet. Fig. 4 shows a plot of the temperature-sensitive TiO-8465 index as a function of the gravity-sensitive Na-8189 index for all stars earlier than M9. On the left is shown measured indices for spectral standards. Colors are as in Fig. 3 with the addition of cyan X’s for giant stars. The right side of Fig. 4 shows measured indices for objects that are classified as having low (circles) or intermediate (triangles) gravity, and candidates spectroscopically determined to be field dwarfs (black X’s; see below).
One difficulty in interpreting Fig. 4 directly is that the Na-8189 index is contaminated by telluric features. This point was not discussed in SCH06 because both the candidates and Upper Sco spectral standards were taken at similar airmasses and thus this effect did not influence the spectral classifications. However, the Taurus spectral data were taken at systematically lower airmasses than many of the spectral standards. As a result, a program star with intermediate gravity signatures observed at low airmass will have a lower Na-8189 index than an intermediate gravity standard of the same spectral type observed at high airmass. This effect causes a discrepancy between the positions of the green X’s and the triangles in Fig. 4.
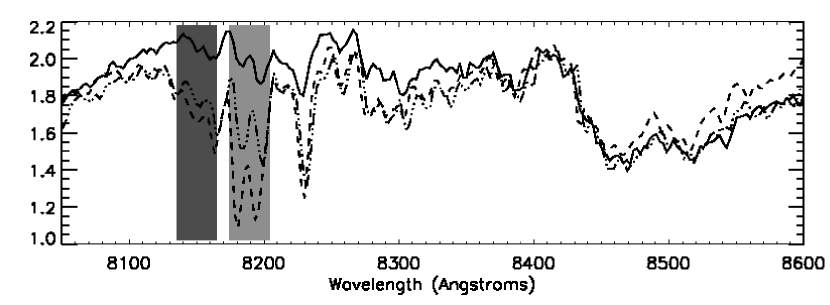
Fig. 5 shows a section of the spectra which highlights the Na I (8183 and 8195 Å) feature for dwarf, intermediate, and low gravity stars of the same spectral type. Both GJ 866 and USco CTIO 53 (the dwarf and intermediate-gravity stars) were observed at high airmass whereas MHO 7 (the low gravity Taurus member) was observed at low airmass. Telluric absorption (8161–8282 Å) seen in the spectra of GJ 866 and USco CTIO 53 affects both the continuum band and Na I band causing systematically high measurements of the Na-8189 index. However, the three spectra can be clearly distinguished through visual inspection of the NaI line strengths. Thus, we used the quantitative indices as a rough guide only and all final gravity classification was done by eye. All objects with surface gravity features weaker than those of the intermediate-age standards are considered by us to have low gravity; objects with gravity features similar to those exhibited by the intermediate-age standards are considered to have intermediate gravity. Based on this classification scheme we identify 42 new PMS stars (see Table 1). Of these, 19 exhibit low surface gravity features and the remaining 23 exhibit intermediate surface gravity features. A detailed discussion of both populations is given in Section 4.
3.2. Extinction and Veiling
Although most of the known low mass Taurus members have low extinction (A1; e.g., Kenyon, Dobrzycka, & Hartmann 1994), the quantitative indices used in classification are affected by interstellar reddening which we must account for in the classification process. To assess any potential effect, we artificially reddened all spectral standards by AV=6 mag, the maximum extinction within our survey region as inferred from large-beam dust maps (Schlegel et al. 1998). We then re-measured all classification indices. Results of this experiment for an M5 star are shown as vectors on Figs. 3 and 4. Reddening at this level is not sufficient to shift the indices by more than 0.5 subclasses in temperature, and can be easily identified upon visual assessment of overall spectral slope.
We must also consider the effects of veiling, either due to excess emission from an accretion shock or due to thermal emission from dust grains in a circumstellar disk. In SCH06 we explored possible biases introduced by these processes on our spectral classification by adding to the spectra hot or cold blackbody emission of constant temperature, or continuum excess of constant flux. SCH06 found that veiling due to thermal emission from dust grains in a disk does not significantly affect the spectral classification indices used here. Veiling from a hot accretion shock, however, does systematically decrease the TiO-7140 index. The maximum shifts produced from these experiments are shown as vectors in Figs. 3 and 4. We believe this effect to be the cause of measured indices for SCH J0429595+2433080 and SCH J0518028+2327126 lying beneath the primary sequence of points. In addition to this evidence for veiling, both stars are confirmed to have low gravity and strong H emission consistent with young, possibly accreting objects. SCH J0429595+2433080 also has CaII triplet emission.
4. New Pre-Main Sequence Objects
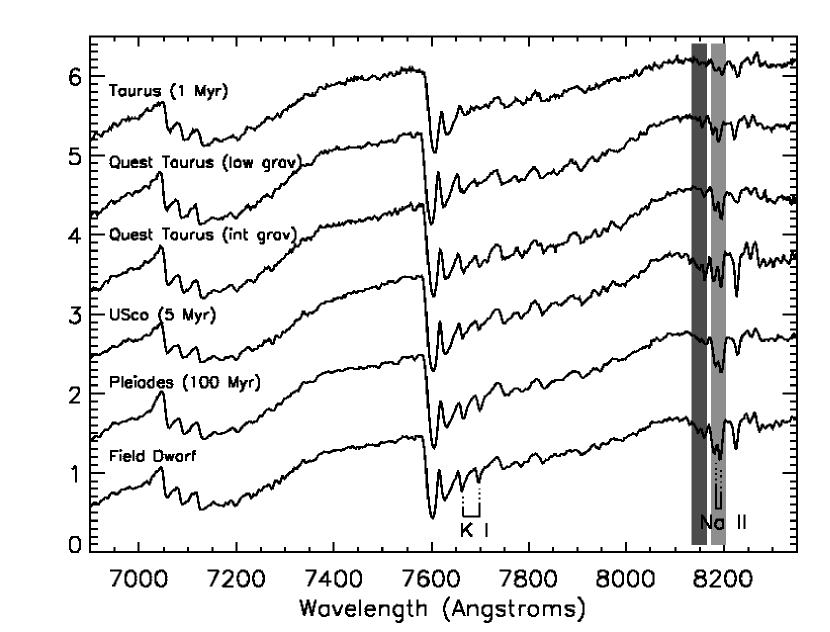
From the spectroscopic data we identify 19 objects having spectral features which indicate lower surface gravity than members of Upper Sco (5 Myr). Most of the new low gravity objects have inferred gravities as low as those similarly inferred for known 1–2 Myr Taurus members. Of these 19 objects, three were previously identified in the literature: SCH J04295950+2433080 (Guieu et al. 2006), SCH J04311908+2335048 (Luhman 2006) and SCH J0416272+2053093 (Wichmann et al. 1996). We additionally identify 23 objects which have intermediate-strength surface gravity features consistent with those observed in Upper Sco, TW Hya and Beta Pic stars. In Fig. 6 we present spectra of M4/M4.5 stars shown in order of decreasing surface gravity and decreasing Na I and K I absorption (bottom to top). All spectra of observed stars as old as AB Dor or the Pleiades (100 Myr) appear identical to those of dwarf stars. Therefore, the intermediate-age population in Taurus is likely significantly younger than 100 Myr, although the exact upper bound on the age of this population is unknown due to lack of comparison stars with ages between 10 and 100 Myrs. This interpretation may also apply to three objects identified by Luhman (2006) which were found to have gravity intermediate between Taurus and dwarf stars and presumed in that study to be 100 Myr-old due to lack of comparison stars with ages between those of Taurus members and field dwarfs.
Hereafter we refer to the low gravity objects as “young” and the intermediate gravity objects as “intermediate-age.” In the color-magnitude and color-color diagrams (Fig. 1 and Fig. 2), candidates for which we have obtained spectral data are shown as large symbols. For both figures, objects confirmed to be young (including SCH J04295950+2433080, SCH J04311908+2335048 and SCH J0416272+2053093) or intermediate-age PMS stars are distinguished from those determined to be older field objects. Photometric and spectral data for new PMS stars is given in Table 1. Appendix A contains magnitudes and spectral indice measurements for PMS candidates spectroscopically determined to be field dwarfs.
Understanding the relationship of the newly-identified PMS population to the known Taurus members requires distances to the new PMS stars which we cannot determine based on the current data set. If we assume they are located at the distance of Taurus, the derived ages from an HR diagram are 1–10 Myr, and the intermediate-age stars tend to have systematically lower derived luminosities than the young stars at a given spectral type. While these relative ages are consistent with those derived from surface gravity analysis, a range of distances could yield similar luminosity segregation results. In lieu of distance measurements, we constrain the origin of the PMS objects identified in this work by assessing the projected spatial distribution and kinematics of the new young and intermediate-age stars in relation to the known Taurus population.
4.1. Spatial Distribution
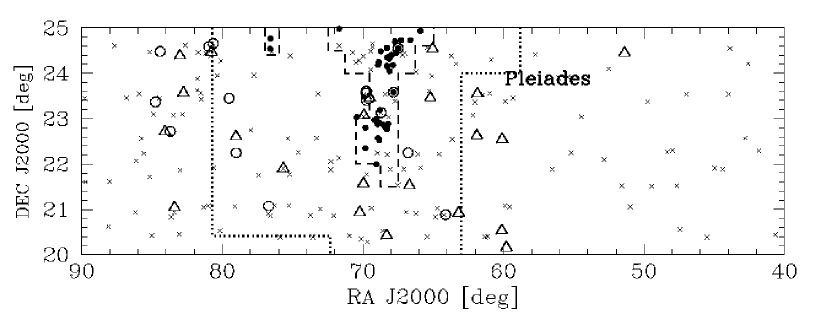
The new young and intermediate-age stars are distributed throughout the survey region, and many are located well beyond regions previously explored for young PMS stars. Fig. 7 shows the location of spectroscopically observed Quest-2 candidates, along with known low mass Taurus members from the literature (Briceño et al. 2002, Guieu et al. 2006, Hartmann et al. 2002, Luhman et al. 2003, Luhman 2004, Luhman 2006). The region that has been previously studied for low mass stars using deep optical/near-infrared imaging with spectroscopic follow-up (Briceño et al. 2002, Guieu et al. 2006, Luhman 2000, Luhman et al. 2003, Luhman 2004) is indicated, as is the Pleiades association. Based on comparison with CO maps of the region (Dame, Hartmann, & Thaddeus 2001), while some objects do lie in projection near molecular gas, we see no systematic correlation between the spatial distribution of the new PMS stars and the CO emission.
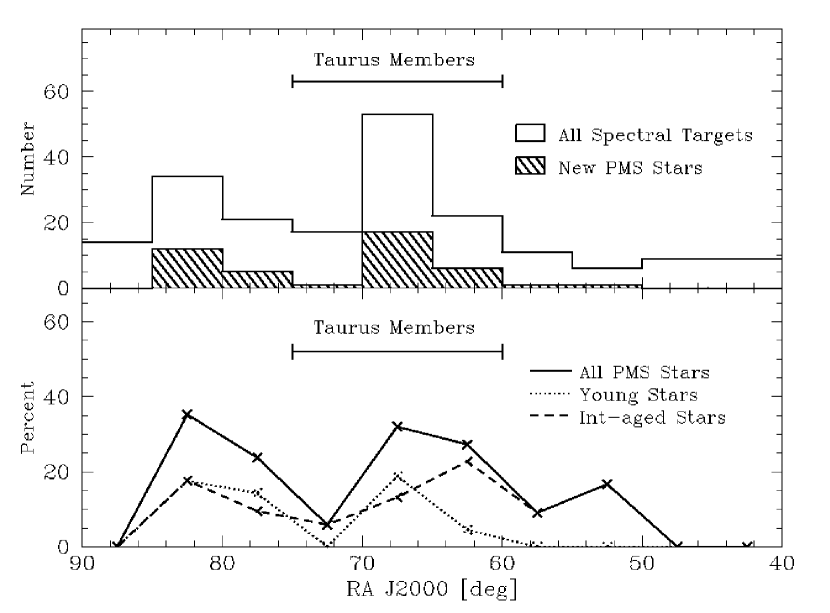
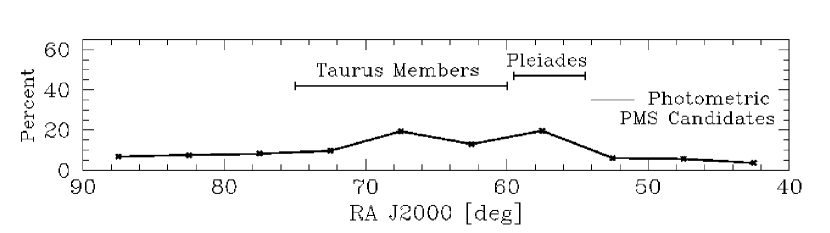
To assess whether the new PMS stars are associated with the known concentrations of Taurus members or whether they are more uniformly distributed, we show in Fig. 8 a histogram of the RA values for all sources with spectra presented here and for those sources confirmed as PMS objects. In the middle panel we present the percentage of spectroscopically observed objects determined to be PMS stars. These can be compared to the RA range that contains 98% of the known low mass Taurus members (Briceño et al. 2002, Guieu et al. 2006, Hartmann et al. 2002, Luhman et al. 2003, Luhman 2004, Luhman 2006). The bottom panel shows the percentage of the 1800 candidates located within a given RA range.
We note two spatial concentrations of new PMS stars: one near the known Taurus members at 68o, and a second in the Eastern portion of the cloud centered around . In Fig. 7 we indicate the approximate boundary within which a 5 Myr star with velocity 2 km/s relative to Taurus could have traveled from any of the known Taurus subclusters. Some of the young objects newly identified here are located well beyond this region. Assuming an age of 5 Myr as derived from surface gravity analysis, if these new young stars originated in the known star-forming subclusters they must, therefore, have arrived at their current positions at relatively high velocities.
An alternative, and perhaps more likely scenario is that we have identified previously unknown areas of recent star-formation outside of the current dense cloud complex. To further quantify the new PMS population and assess this possibility, we divide our PMS stars into 3 groups: those that lie in the same RA range as 98% of the known Taurus sample (60), those that are East () and those that are West () of this RA range. We find that of the 190 spectral candidates, 2/33 (6%) are confirmed to be PMS stars in the Western region, 23/89 (26%) in the central region, and 17/68 (25%) in the Eastern region. Spectroscopic confirmation rates of 25% in the East and only 6% in the West are contrary to the isotropic distribution we would expect to observe if these stars had been dispersed from the central regions. Using the two-tailed Fisher Exact test we compute a probability of 3% that the observed Eastern and Western distributions could have been drawn from the same population. We can therefore conclude with 97% confidence that the distributed PMS stars were not randomly dispersed from the known 1–2 Myr-old Taurus population. Instead, we suggest that they likely represent a population that is not associated with the currently visible areas of the dense Taurus-Auriga molecular cloud complex.
4.2. Proper Motions
A primary goal of our large-area survey is to search for and characterize any PMS stars that might exist far from the 1–2 Myr-old subclusters in Taurus. Having identified several tens of such stars, we can use proper motion information to further study the characteristics of this spectroscopically-selected sample.
We extracted USNO-B1.0 proper motions111We define an object to have a measured USNO proper motion if it has either a non-zero proper motion or a non-zero proper motion uncertainty in the USNO-B1.0 Whole Sky catalog. This cut will bias us against objects with intrinsically small (proper motion 2 mas/yr) but well-measured (uncertainty 2 mas/yr) proper motions which will be listed with RA=0, Dec=0, RA_err=0 and Dec_err=0. However, because the USNO proper motion measurements are rounded to the nearest mas/yr and non-measurements are not indicated, we are unsure when a measured proper motion uncertainty of zero refers to a very small uncertainty versus a non-detection. Therefore, we feel this is a necessary, if conservative, selection criteria. (Monet et al. 2003) for 141 of the 190 objects with spectra. Fig. 9 shows histograms of the and proper motion components for new young and intermediate-age PMS targets and for stars classified as field dwarfs. Because proper motions listed in the USNO catalog are relative rather than absolute (i.e., the proper motions of background stars have not been accounted for), it was necessary to extract similarly derived USNO proper motions of known Taurus members for comparison rather than using more accurate values listed in the literature (e.g., Frink et al. 1997). The bottom panels of Fig. 9 show histograms of USNO proper motions for 160 known Taurus members and for 58 Hipparcos-selected Pleiades members (Robichon et al. 1999).
The proper motions of the PMS stars appear strongly correlated (independent of RA) and distinct from the proper motions of Pleiades members, whereas the spectroscopic field dwarfs exhibit a very broad distribution of proper motions. These results indicate that the newly-identified PMS population is not associated with the Pleiades and is not a collection of random field stars. Further, the PMS stars farthest from the known Taurus population do not exhibit systematically higher proper motions, as would have been expected if they had been ejected from the current star-forming regions, giving further evidence that we have identified a new region of relatively recent star-formation within the Eastern regions of the clouds. The young sample in particular appears to have proper motions consistent with Taurus. A possible interpretation of these data is that the new PMS objects in the central regions are associated with the known Taurus population and the new PMS objects farther away were formed out of molecular material sharing a similar velocity and distance to that forming the current 1 Myr-old population. However, typical USNO proper motion uncertainties are large (4 mas/yr), and the Taurus data itself exhibit a large spread (bottom panels of Fig. 9). Therefore, a more detailed kinematic study of these objects is necessary before a definitive conclusion about their origin can be drawn (see Section 5).
4.3. A New Distributed Population and the Post T-Tauri Star Problem
There has been much debate over the last few decades as to whether there exists a population of 3–10 Myr old post T-Tauri stars associated with the current 1–2 Myr old Taurus members. Spectroscopic follow-up studies of RASS-selected sources have identified a wide-spread population of stars in the vicinity of Taurus (e.g., Neuhäuser et al. 1997, Wichmann et al. 1996), but the distances, ages, and origins of these stars remain controversial. Measures of x-ray emission and lithium equivalent widths are consistent with any ages from 1–100 Myr for these objects, and the nearly uniform spatial distribution of this population is consistent with its originating from a number of sources other than Taurus (e.g., Briceño et al. 1997). We have compared the spatial location of the new PMS sources identified here to the distribution of RASS sources in the area (eg., Guillout et al. 1998) and find no correlation between areas of dense x-ray sources detected in the RASS and the newly-identified stars in the Eastern part of our survey region.
Besides X-ray emission, an efficient method of identifying nearby older PMS stars over a large area is through optical and near-infrared imaging combined with spectroscopic follow-up observations. Surface gravity signatures present in optical spectra of late-K and M stars offer the advantage of clearly distinguishing young and intermediate-age PMS stars from 75–100 Myr-old stars. Considering the large number of imaging/spectroscopic surveys in the Taurus region, a natural question to ask is, how were the PMS stars presented here not discovered prior to our survey?
The primary reason these objects were not identified in earlier work is that we have searched much farther away from the clouds than most previous photometric/spectroscopic studies. The large-area work by Luhman (2006) probed only as far East as 5 hr and did not extend to the large number of newly discovered PMS stars in the Eastern portion of our survey at 80 deg. Additionally, our survey occupies a unique range in color/magnitude space. Low mass stars discovered in early CCD surveys (e.g., Briceño et al. 2002) are saturated in the Quest-2 data. More recent surveys (e.g., Luhman 2004, Guieu et al. 2006, Luhman 2006) have been concerned primarily with finding new brown dwarfs with spectral types M6, which will be predominantly fainter and redder than the candidates discussed here. Indeed, comparison of USNO- and 2MASS- photometry for the Quest-2 PMS candidates to those selected in the Luhman (2006) study reveals that the Quest-2 candidates are systematically bluer. Despite the large overlap in area (50 deg2), the only observed candidate in our survey with spectral type M6 selected as a candidate via the Luhman (2006) criteria is the one star (SCH J04311908+2335048) which our two works both identified. It is unlikely that the intermediate-age objects found in this work, which are predominantly bluer than the young objects (see Fig. 1), would have been selected as candidate Taurus members in any of the previous optical studies.
While we have discovered a new distributed population of both young and intermediate-age stars, we do not at this time claim that these objects represent the post T-Tauri stars in Taurus. The spatial distribution of the PMS stars identified far from the known members is not consistent with those stars being associated with the Taurus subclusters. Additionally, the fact that the proper motions for the new young stars located tens of degrees away are consistent with known Taurus members implies that they were not ejected at high velocities from the current star-forming regions. Because our dataset is not complete either spatially or in magnitude/color space (due to difficulties with weather and calibration), we cannot assess the full extent of this new population. Rather, we note that its existence hints there may be many more as-yet undiscovered PMS objects waiting to be identified in and surrounding the Taurus clouds.
5. Summary and Future Work
We have completed a large-area (250 deg2) imaging survey of the southern part of the Taurus molecular cloud using the Quest-2 camera. From a combination of these data and 2MASS photometry, candidate PMS objects were selected throughout the region. We have observed spectra of 190 of these objects (10% of the photometrically-selected candidates) and, based on comparison to spectra of Taurus members and members of other young associations, have determined 42 are bona fide PMS stars. From the strength of spectral features sensitive to surface gravity, we subdivide the new PMS objects into young and intermediate-age stars. We find members of both populations throughout the survey region and well beyond previously studied areas. In particular we find a new concentration of PMS objects in the Eastern portion of the cloud located at 82o and , which likely did not originate from the previously known star-forming regions. We have analyzed the USNO proper motions of 141 spectral targets and find a strong concentration of proper motions for the new PMS stars around those measured for known Taurus members. Conversely, the spectroscopic field dwarf population exhibits a very broad distribution of proper motions.
Radial velocities from high resolution spectra for all 42 new PMS stars combined with more robust proper motion measurements derived from existing catalogs will allow us to compute a 3D velocity for each object over a range of distances. In addition, lithium equivalent widths can help confirm the youth of the new PMS sample which is currently based on NaI and KI line strengths. While lithium depletion occurs slowly over 100 Myr for G type stars and is therefore not suitable for distinguishing PTTSs from 100 Myr objects at these temperatures, for K to mid-M type stars that are fully convective, lithium depletion occurs over much faster timescales (10 Myr; e.g., D’Antona & Mazzitelli 1994) and is a more robust indicator of youth. Finally, we emphasize that the new PMS population of 42 stars and a spectroscopic confirmation rate of 20% implies that several hundred similar young and intermediate-age PMS stars may be present in our larger photometric database.
6. Acknowledgments
The authors are appreciative of the Quest-2 collaboration including David Rabinowitz, Anne Bauer and Jonathan Jerke, for observing and processing the photometric drift scan data. We would like to thank Ashish Mahabal and Eilat Glikman for many discussions concerning the systematics and calibration of the Quest-2 data. We thank Lee Hartmann for his insights and suggestions which improved the quality of this manuscript. We are grateful to assistance from the entire Palomar staff, in particular Jean Mueller, Karl Dunscombe, and Dipali. This manuscript has made use of data from the Two Micron All Sky Survey.
References
- (1) Ardila, D., Martín, E.L., & Basri, G. 2001, AJ, 120, 479
- (2) Ballesteros-Paredes, J., & Hartmann, L. 2006, astro-ph/0605268
- (3) Basri, G., Marcy, G., & Graham, J. 1996, ApJ, 458, 600
- (4) Blitz, L., & Shu, F.H. 1980, ApJ, 238, 148
- (5) Bouvier, J., Stauffer, J.R., Martín, E.L., Barrado y Navascues, D., Wallace, B., & Beja, V.J.S. 1998, A&A, 336, 490
- (6) Briceño, C., et al. 1997, AJ, 113, 740
- (7) Briceño, C., Calvet, N., Kenyon, S., & Hartmann, L. 1999, AJ, 118, 1354
- (8) Briceño, C., Luhman, K.L., Hartmann, L., Stauffer, J.R., & Kirkpatrick, D. 2002, ApJ, 580, 317
- (9) Carpenter, J.M. 2000, AJ, 120, 3139
- (10) D’Antona, F., & Mazzitelli, I. 1994, ApJS, 90, 467
- (11) de la Reza, R., Jilinski, E., & Ortega, V.G. 2006, AJ, 131, 2609
- (12) Elmegreen, B.G. 1991, in NATO ASIC 342, The Physics of Star Formation and Early Stellar Evolution, ed. C. J. Lada & N. J. Kylafis (Dordrecht: Kluwer), 35
- (13) Frink, S., Neuhäuser, R., & Sterzik, M.F. 1997, A&A, 325, 613
- (14) Gomez, M., Hartmann, L., Kenyon, S. J., Hewett, R. 1993
- (15) Guieu, S., Dougados, C., Monin, J.-L., Magnier, E., & Martín, E. L. 2006, A&A, 446, 485
- (16) Guillout, P., Sterzik, M.F., Schmitt, J.H.M.M, Motch, C., & Neuhäuser, R. 1998, A&A, 337, 113
- (17) Hartmann, L. 2000, in ESLAB 33, Star Formation from the Small to Large Scale, ed. F. Favata, A. Kaas, & A. Wilson, 107
- (18) Hartmann, L. 2002, ApJ, 578, 914
- (19) Hartmann, L., Ballesteros-Paredes, J., & Bergin, E. 2001, ApJ, 562, 852
- (20) Hartmann, L., Hewett, R., Stahler, S., & Mathieu, R.D. 1986, ApJ, 309, 275
- (21) Herbig, G.H. 1978, in Problems of Physics and Evolution of the Universe, edited by L.V. Mirzoyan (Publishing House of the Acad. Sc. Armen. SSR, Yerevan), p.171
- (22) Kenyon, S., Dobrzycka, D., & Hartmann, L. 1994, AJ, 108, 1437
- (23) Kirkpatrick, J.D., Henry, T.J., & McCarthy, D.W. 1991, ApJS, 77, 417
- (24) Lebreton, Y., Fernandes, J., & Lejeune, T. 2001 A&A, 374, 540
- (25) Luhman, K.L. 2000, ApJ, 544, 1044
- (26) Luhman, K.L. 2004, ApJ, 617, 1216
- (27) Luhman, K.L. 2006, ApJ, 645, 676
- (28) Luhman, K.L., Briceño, C., Stauffer, J.R., Hartmann, L., Barrado Y Navascués, D., & Caldwell, N 2003, ApJ, 590, 348
- (29) Luhman K.L., Stauffer, J.R., & Mamajek, E.E. 2005, ApJ, 628, 69
- (30) Monet, D.G., et al. 2003, AJ, 125, 984
- (31) Myers, P.C., & Khersonsky, V.K. 1995, ApJ, 442, 186
- (32) Neuhäuser, R., Sterzik, M.F., Torres, G., & Martín, E.L. 1995, A&A, 299, L13
- (33) Neuhäuser, R., Torres, G., Sterzik, M.F., & Randich, S. 1997, A&A, 325, 647
- (34) Palla, F., & Stahler, S. W. 2000, ApJ, 540, 255
- (35) Ortega, V.G., de la Reza, R., Jilinski, E., & Bazzanella, B., 2004, ApJ, 609, 243
- (36) Rabinowitz, D. et al. 2003, BAAS, 203, 38.12
- (37) Rebull, L.M., et al. 2000, AJ, 119, 302
- (38) Robichon, N., Arenou, F., Mermilliod, J.-C., & Turon, C. 1999, A&A, 345, 471
- (39) Schlegel, D.J., Finkbeiner, D.P., & Davis, M. 1998, ApJS, 500, 525
- (40) Skrutskie, M.F., et al. 2006, AJ, 131, 1163
- (41) Slesnick, C.L., Carpenter, J.M., & Hillenbrand, L.A. 2006, AJ, 131, 3016 (SCH06)
- (42) Dame, T.M., Hartmann, Dap, Thaddeus, P. 2001, ApJ, 547, 792
- (43) White, R.J., & Basri, G. 2003, ApJ, 582, 1109
- (44) Wichmann, R., et al. 1996, A&A, 312, 439
- (45) Wilking, B.A., Meyer, M.R., Robinson, J.G., & Greene, T.P. 2005, AJ, 130, 1733
- (46) York, D.G., et al. 2000, AJ, 120, 1579
- (47)

| IDaaObject IDs given in J2000 coordinates. | b | r | i | JccNear-infrared photometry taken from 2MASS. | HccNear-infrared photometry taken from 2MASS. | KSccNear-infrared photometry taken from 2MASS. | TiO-7140 | TiO-8165 | Na-8195 | SpType | [Å] | Age |
|---|---|---|---|---|---|---|---|---|---|---|---|---|
| SCH J0325332+2426581 | 18.0 | 16.4 | 14.7 | 12.34 | 11.72 | 11.47 | 2.02 | 1.30 | 0.89 | M4.5 | -10 | int |
| SCH J0359099+2009362 | 19.8 | 18.0 | 16.1 | 13.47 | 12.89 | 12.53 | 2.32 | 1.42 | 0.85 | M4.75 | -7 | int |
| SCH J0400220+2232382 | – | 18.4 | 16.3 | 13.45 | 12.76 | 12.45 | 2.23 | 1.36 | 0.87 | M4.75 | -6 | int |
| SCH J0400279+2031593 | 20.0 | 18.2 | 16.1 | 13.14 | 12.56 | 12.23 | 2.54 | 1.49 | 0.84 | M5.75 | -16 | int |
| SCH J0407246+2332554 | 18.4 | 16.7 | 14.8 | 12.77 | 12.06 | 11.85 | 1.69 | 1.16 | 0.88 | M4 | -6 | int |
| SCH J0407350+2237396 | 18.6 | 16.8 | 15.0 | 12.16 | 11.60 | 11.25 | 2.38 | 1.51 | 0.86 | M5 | -16 | int |
| SCH J0412433+2055306 | – | 20.3 | 17.8 | 14.24 | 13.53 | 13.17 | 2.97 | 1.95 | 0.90 | M8 | -15 | int |
| SCH J0416272+2053093bbThree of our PMS objects were previously identified in the literature: SCH J0429595+2433080 (Gueiu et al. 2006), SCH J0431191+2335048 (Luhman 2006), and SCH J0416272+2053093 (Wichmann et al. 1996) | 18.6 | 16.8 | 14.9 | 12.05 | 11.47 | 11.11 | 2.26 | 1.43 | 0.93 | M5 | -5 | young |
| SCH J0420068+2432267 | 17.5 | 16.1 | 14.6 | 12.42 | 11.87 | 11.59 | 1.84 | 1.18 | 0.88 | M4 | – | int |
| SCH J0420491+2327370 | 18.3 | 16.7 | 14.9 | 12.07 | 11.39 | 11.09 | 2.03 | 1.25 | 0.88 | M4.25 | -8 | int |
| SCH J0426452+2131408 | 19.3 | 17.8 | 15.8 | 13.19 | 12.64 | 12.31 | 2.23 | 1.38 | 0.87 | M4.75 | -8 | int |
| SCH J0427074+2215039 | – | 17.7 | 15.4 | 12.27 | 11.64 | 11.29 | 2.64 | 1.74 | 0.96 | M6.75 | -18 | young |
| SCH J0429595+2433080bbThree of our PMS objects were previously identified in the literature: SCH J0429595+2433080 (Gueiu et al. 2006), SCH J0431191+2335048 (Luhman 2006), and SCH J0416272+2053093 (Wichmann et al. 1996) | – | 17.9 | 15.7 | 11.68 | 10.53 | 9.81 | 1.87 | 1.39 | 0.97 | M5.5 | -71 | young |
| SCH J0431191+2335048bbThree of our PMS objects were previously identified in the literature: SCH J0429595+2433080 (Gueiu et al. 2006), SCH J0431191+2335048 (Luhman 2006), and SCH J0416272+2053093 (Wichmann et al. 1996) | – | 20.3 | 17.5 | 13.50 | 12.71 | 12.19 | 2.63 | 2.12 | 0.97 | M8 | -32 | young |
| SCH J0433131+2025200 | – | 19.1 | 17.0 | 14.20 | 13.46 | 13.14 | 2.36 | 1.40 | 0.87 | M5 | -12 | int |
| SCH J0434454+2308035 | 20.2 | 18.2 | 16.0 | 12.80 | 12.02 | 11.70 | 2.31 | 1.45 | 0.93 | M5.25 | -11 | young |
| SCH J0438001+2327167 | 19.7 | 18.0 | 15.9 | 13.27 | 12.66 | 12.34 | 2.41 | 1.45 | 0.85 | M5.25 | -15 | int |
| SCH J0438163+2326404 | 17.7 | 16.2 | 14.3 | 11.80 | 11.24 | 10.96 | 2.24 | 1.38 | 0.93 | M4.75 | -7 | young |
| SCH J0438586+2336352 | 18.4 | 16.8 | 14.3 | 11.97 | 11.36 | 11.03 | 2.03 | 1.19 | 0.91 | M4.25 | -15 | young |
| SCH J0438587+2323596 | 19.1 | 17.5 | 15.3 | 12.49 | 11.93 | 11.59 | 2.62 | 1.68 | 0.92 | M6.5 | -14 | young |
| SCH J0439016+2336030 | 16.7 | 15.2 | 12.8 | 11.33 | 10.59 | 10.18 | 2.41 | 1.60 | 0.92 | M6 | -62 | young |
| SCH J0439064+2334179 | 19.0 | 17.3 | 14.6 | 12.09 | 11.53 | 11.19 | 2.78 | 1.86 | 0.94 | M7.5 | -8 | young |
| SCH J0439410+2304262 | – | 19.1 | 17.1 | 14.41 | 13.81 | 13.46 | 2.09 | 1.31 | 0.87 | M4.5 | -12 | int |
| SCH J0439507+2133564 | – | 19.7 | 17.5 | 14.43 | 13.80 | 13.43 | 2.67 | 1.62 | 0.84 | M6 | -8 | int |
| SCH J0440534+2055473 | 18.8 | 17.1 | 15.1 | 12.48 | 11.88 | 11.62 | 2.32 | 1.44 | 0.87 | M5. | -11 | int |
| SCH J0502377+2154050 | 19.2 | 17.4 | 15.6 | 13.16 | 12.53 | 12.20 | 1.99 | 1.25 | 0.88 | M4.25 | -10 | int |
| SCH J0506466+2104298 | 18.1 | 16.5 | 14.6 | 12.05 | 11.40 | 11.11 | 2.43 | 1.51 | 0.91 | M5.25 | -14 | young |
| SCH J0516021+2214530 | 17.4 | 15.9 | 14.1 | 11.67 | 11.13 | 10.75 | 2.25 | 1.39 | 0.90 | M5 | -10 | young |
| SCH J0516058+2236152 | 19.1 | 17.2 | 15.6 | 13.29 | 12.59 | 12.30 | 1.88 | 1.18 | 0.88 | M4 | -8 | int |
| SCH J0518028+2327126 | 18.6 | 17.2 | 15.3 | 12.99 | 12.32 | 11.88 | 2.03 | 1.47 | 0.88 | M5 | -21 | young |
| SCH J0522333+2439254 | 18.9 | 17.0 | 15.2 | 12.75 | 12.04 | 11.72 | 2.18 | 1.38 | 0.90 | M4.75 | -7 | young |
| SCH J0522335+2439197 | 19.2 | 17.2 | 15.3 | 12.79 | 12.14 | 11.79 | 2.10 | 1.30 | 0.91 | M4.5 | -8 | young |
| SCH J0523020+2428087 | 18.1 | 16.4 | 14.8 | 12.60 | 11.92 | 11.61 | 1.78 | 1.16 | 0.90 | M4 | -3 | int |
| SCH J0523500+2435237 | – | 18.7 | 16.6 | 13.81 | 13.14 | 12.77 | 2.63 | 1.61 | 0.88 | M6 | -18 | young |
| SCH J0531021+2333579 | 17.5 | 16.0 | 14.0 | 12.28 | 11.64 | 11.39 | 1.79 | 1.18 | 0.90 | M4 | -5 | int |
| SCH J0531026+2334022 | 17.6 | 16.0 | 13.9 | 12.26 | 11.58 | 11.35 | 1.83 | 1.22 | 0.89 | M4 | -5 | int |
| SCH J0532021+2423030 | 19.9 | 18.2 | 16.2 | 13.69 | 13.06 | 12.80 | 2.50 | 1.44 | 0.85 | M5 | -19 | int |
| SCH J0533363+2102276 | 17.4 | 15.8 | 14.2 | 11.93 | 11.32 | 11.07 | 2.05 | 1.28 | 0.88 | M4.5 | -7 | int |
| SCH J0534480+2243142 | 18.2 | 16.6 | 15.0 | 12.83 | 12.18 | 11.93 | 1.94 | 1.22 | 0.89 | M4.25 | -6 | young |
| SCH J0536190+2242428 | 17.7 | 16.3 | 14.5 | 12.13 | 11.53 | 11.27 | 2.17 | 1.35 | 0.89 | M4.75 | -12 | int |
| SCH J0537385+2428518 | 17.8 | 16.2 | 14.2 | 11.66 | 11.06 | 10.78 | 2.44 | 1.49 | 0.89 | M5.25 | -14 | young |
| SCH J0539009+2322081 | 19.1 | 17.6 | 15.3 | 12.68 | 12.10 | 11.79 | 2.53 | 1.59 | 0.88 | M6 | -16 | young |