1]Leiden Observatory, P.O. Box 9513, 2333 RA Leiden, The Netherlands, E-mail: saskia@strw.leidenuniv.nl 2]Instituut voor Sterrenkunde, Katholieke Universiteit Leuven, Celestijnenlaan 200 B, B-3001 Leuven, Belgium 3]Department of astrophysics, University of Nijmegen, P.O. Box 9010, 6500 GL Nijmegen, The Netherlands 4]Observatoire de Genève, 51 Chemin de Maillettes, 1290 Sauverny, Switzerland
A line profile analysis of the pulsating red giant star Ophiuchi (G9.5III)
Abstract
So far, solar-like oscillations have been studied using radial velocity and/or light curve variations, which reveal frequencies of the oscillation modes. Line-profile variations, however, are also a valuable diagnostic to characterise radial and non-radial oscillations, including frequencies, amplitudes, the spherical mode wavenumbers and the stellar inclination angle. Here we present a line profile analysis of Ophiuchi, which is a pulsating red giant. The main differences compared to previous line profile analyses done for heat-driven oscillations are the small amplitudes and the predicted short damping and re-excitation times in red giants.
Two line diagnostics have been tested to see whether these are sensitive to the small line profile variations present in red giants. In addition, line profiles have been simulated with short damping and re-excitation times and are compared with the observations. This comparison reveals that non-radial modes are detected in the observed line profile variations of Ophiuchi. This is rather surprising, as theoretical predictions favours the occurrence of radial modes.
keywords:
Ophiuchi; spectroscopy; line profiles1 Introduction
The discovery of oscillations in the sun, about five decades ago, was the onset of seismology of stars. Oscillations probe the interior of the stars and are therefore a direct means to determine their internal structure. Solar-like oscillations are excited by turbulent convection near the surface of cool stars of spectral type F, G, K or M. They show radial velocity variations with amplitudes of typically a few cm s-1 to a few m s-1, and with periods ranging from a few minutes for main sequence stars to about half an hour for subgiants and a couple of hours for giants.
During the last decade, the refinement of the techniques to perform very accurate radial velocity observations, made it also possible to observe solar-like oscillations in distant stars. Recently, these solar-like oscillations are indeed observed in several red giants, for example in Hydrae frandsen2002 , Ophiuchi deridder2006b and Serpentis carrier2006 .
This proceedingspaper describes observations as well as a frequency analysis of different parameters and a line profile analysis of Ophiuchi. It is organised as follows. In Section 2, we start with a discussion on the target selection, followed in Section 3 by the description of the observations. In Section 4 the data analysis is described, i.e. first, the frequency determination of different oscillation diagnostics and subsequently the mode identification using these frequencies. In Section 5 we show simulations, including the short damping and re-excitation times present in solar-like oscillations of red giants stello2004 . Finally, in Section 6 we draw some conclusions.
2 Target selection
| parameter | Ophiuchi |
|---|---|
| [K] | |
| [km s-1] | |
| [mas] | |
| [pc] | |
| [mag] | |
| [mag] |
In order to obtain radial velocity variations with an accuracy of order m s-1, the target selection as well as the observing strategy are important. First, the stars have to be bright enough to obtain high signal to noise ratios to detect the signal. Secondly, the rotational velocities have to be low in order to have narrow spectral lines, which are needed for precise radial velocity measurement. Also other infering phenomena like star spots or companions should be avoided.
For the observation strategy we have to take into account that the expected (and observed) period of the solar-like oscillations in red giants is of order a couple of hours. This means that the observation times should be of order minutes, in order not to average over a large part of the oscillation cycle. Furthermore single site observations always introduce one day aliases due to the diurnal cycle. Multi site observations, or continuous observations from space can significantly reduce this aliasing effect.
The G9.5III giant Ophiuchi was selected for observations of solar-like oscillations, because of its brightness, = 3.24 mag, its low rotational velocity, = 3.4 km s-1, and the low declination, = -04 41 33.0 barban2004 . The latter was very important to be able to observe the star from both La Silla, Chile and Observatoire de Haute Provence, France. More basic stellar parameters of Ophiuchi are shown in Table 1. Furthermore the Hipparcos catalog esa1997 gives a photometric variation of less than 0.06 mag and the star is mentioned in the ’1988 revised MK spectral standards for stars G0 and later’ keenan1988 . Therefore the presence of starspots or companions is not very likely.
3 Observations
The observations of Ophiuchi were performed in a bi-site campaign with the fibre-fed échelle spectrograph CORALIE, mounted on the Swiss 1.2 m Euler telescope at La Silla (ESO, Chile), and the fibre-fed échelle spectrograph ELODIE, mounted on the French 1.93 m telescope at the Observatoire de Haute Provence (France), during the summer of 2003. The spectra range from 387.5 nm to 682 nm in wavelength. The observation times were kept short enough, in order not to average over a large part of the oscillation, but long enough to reach a signal to noise ratio of at least 100 at 550 nm.
The radial velocities of Ophiuchi were determined with the optimum weight method bouchy2001a and are available in deridder2006b . Variations of order 20 m s-1 due to stellar oscillations were clearly detected by the authors. We refer the reader to deridder2006b for more information on the radial velocity analysis of the star.
In this work, we use the same data as in deridder2006b , but we focus on the line profile variations of the star rather than on the radial velocity. Such variations can be derived with high accuracy from a single unblended line provided that it is not subjected to Stark broadening (see, e.g., aerts2003 and references therein) and that the spectra have a high signal-to-noise ratio. The latter condition is not fulfilled for our data of Ophiuchi. Therefore, we perform a line profile analysis from a cross correlation profile computed of each spectrum. This was done by using a box-shaped mask baranne1996 . This cross correlation profile has an appreciably higher signal-to-noise ratio compared to a single spectral line. Moreover, chadid2001 have shown that a line profile analysis in terms of stellar oscillations is possible using a cross correlation profile rather than individual lines. This is a similar conclusion to the one by dall2006 , who showed that the cross-correlation bisector contains the same information as single-line bisectors.
4 Data analysis
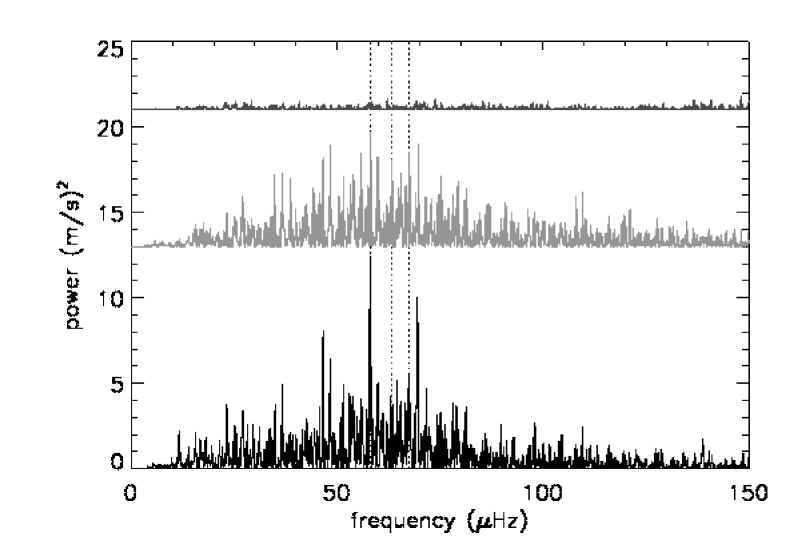
As mentioned earlier, deridder2006b used the optimum weight method bouchy2001a to calculate the radial velocities. This is intrinsically the most precise method, because the whole spectrum is used. With this method the observation with the highest signal to noise ratio of each night is used as a reference. These nightly reference points are effectively a high pass filter and therefore the low frequencies in the power spectrum drop to a level near zero. The resulting power spectrum of Ophiuchi is shown as the lower black graph in Figure 1.
From this power spectrum, deridder2006b determined two possible large separations: 4.8 Hz or 6.7 Hz. Two different stellar evolution models fit these large separations. A stellar model with a mixing length of convection = 1.6 (expressed in local pressure scale heights) and a mass of approximately 2.8 solar masses has a large separation close to 6.7 Hz, assuming that the detected modes are radial. A second stellar model with a higher value of = 1.8 and a lower mass of approximately 1.9 solar masses has a large separation of 4.8 Hz. The data in deridder2006b did not allow to discriminate between these two values of the large separations from theoretical arguments alone.
Recently, Ophiuchi was also observed with the MOST satellite. These continuous photometric observations, described elsewhere in this volume barban2006 , rule out the 6.7 Hz large separation and thus reveal the evolutionary phase of Ophiuchi, again assuming that its detected modes are all radial.
4.1 Moments
Although the radial velocities derived from the optimum weight method are intrinsically the most accurate ones, this method is not useful for mode identification. In order to get the best line profile analysis a cross correlation profile of each spectrum is calculated, using a box-shaped mask baranne1996 . This cross correlation profile has an increased signal to noise ratio compared to a single spectral line. Such a profile can be described by its moments and one usually considers the first three moments for mode identification aerts1992 . The first moment represents the centroid velocity of the line profile, the second moment the width of the line profile and the third moment the skewness of the line profile. The quantity is a particular measure of the radial velocity and should therefore show similar frequency behaviour as the radial velocity derived from the optimum weight method. The power spectrum of , where the average value of per night is used as a reference, is shown in the middle of Figure 1. Despite the differences in the methods to compute a measure of the radial velocity, both power spectra reveal the same dominant frequencies.
4.2 Bisector Velocity Span
A line bisector is a measure of the displacement of the centre of the red and blue wing from the core of the spectral line at each residual flux. The bisector velocity span is defined as the horizontal distance between the bisector positions at fractional flux levels in the top and bottom part of the line profile, see for instance brown1998 .
The bisector velocity span is a measure of the line profile, mostly used as a tool to distinguish between companions and intrinsic stellar activity as sources of the observed radial velocity variations. The Doppler shift induced by a companion shifts the entire spectrum, but does not change the spectral line shapes, while oscillations and star spots do change the spectral line shapes.
No dominant frequencies are obtained from the power spectrum of the bisector velocity span, which is plotted as the top graph in Figure 1. We conclude that for oscillations with low amplitudes, the bisector velocity span is not a useful diagnostic to distinguish between planetary companions and intrinsic variations in a star. This result is consistent with the results recently found by dall2006 .
4.3 Mode identification
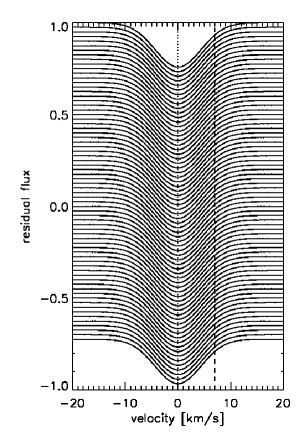


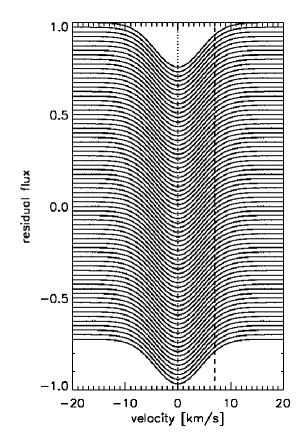


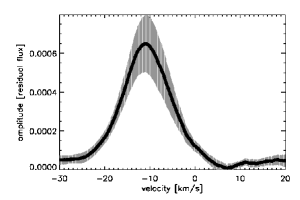
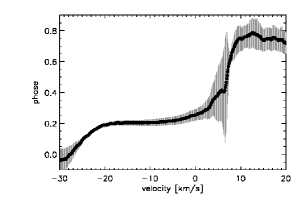
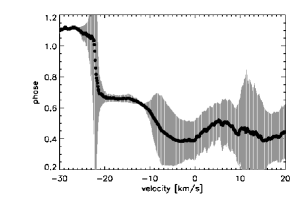
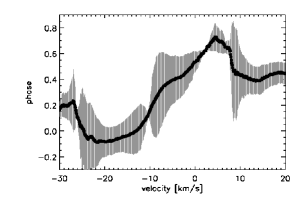
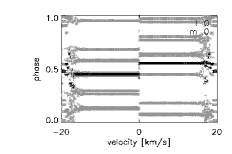
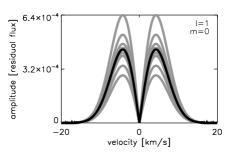
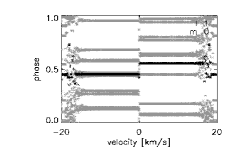
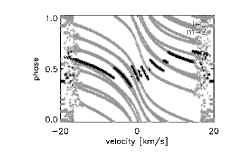
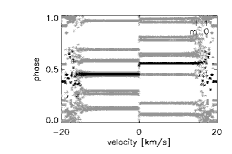
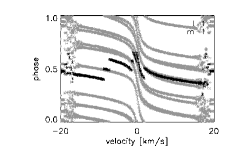
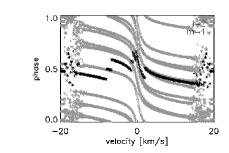
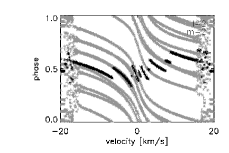
In order to characterise the wavenumbers () of the oscillation modes, the amplitudes across the line profile are compared with the ones obtained from simulations. These amplitudes are determined by fitting a harmonic function, with the dominant frequency of , to the flux values at each velocity pixel of the time series of spectra schrijvers1997 . This is shown schematically in Figure 2 for , and in Figure 3 for . The left panel shows profiles obtained at different times with an arbitrary flux shift. The dotted / dashed lines indicate two examples of velocity points at which a harmonic function is fitted. A harmonic fit at the centre of the profiles is shown in the top middle panel of Figures 2 and 3 as a function of phase. A harmonic fit through a wing of the profiles is shown in the bottom middle panel of Figures 2 and 3. A difference between the amplitudes of the harmonic fit at the different velocity points is clearly seen. The behaviour of the amplitude across the whole profile is shown in the top right panel, while the phase across the whole profile is shown in the bottom right panel. This diagnostic is suitable to be compared with a similar one derived from the data.
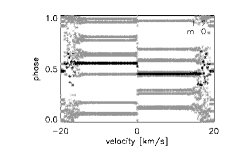
The observed amplitude and phase distributions of Ophiuchi for its three dominant frequencies are shown in Figure 4, as a function of velocity across the line profile. If only radial modes would be dominant in Ophiuchi’s line profile variations, then all three amplitude distributions should have the same shape. However, the detected shapes of these amplitude diagrams clearly differ for the three frequencies. Moreover, the very characteristic amplitude shape for an axisymmetric mode is not recovered for the dominant mode of the star. This implies that at least one non-radial mode is detected in the line profiles of Ophiuchi.
5 Simulations of line profiles


The results obtained in the previous section are not anticipated from a theoretical viewpoint (e.g. dziembowski2001 ). One may therefore wonder if the profiles simulated for infinite mode lifetimes differ too much from reality, i.e. from those for finite lifetimes as in the data. The damping and re-excitation times for red giant oscillations turn out to be short. Indeed, stello2004 derived an oscillation mode lifetime for Hydrae (G7III) of only approximately two days. In order to take this into account, and to investigate the robustness of our conclusion against finite lifetimes, we computed line profile variations simulated for stochastically excited modes. Such line profile variations are not yet available in the literature. We provide them here in an attempt to make a definite conclusion on the nature of Ophiuchi’s dominant oscillation modes.
A damped and re-excited oscillation mode is damped by a factor , with the damping rate, and re-excited before it is able to damp out. As a consequence both the amplitude and the phase of the oscillation are time dependent.
| (1) |
To simulate such an oscillator we follow the description of deridder2006a , and we compute
| (2) |
where we let the amplitudes and vary with a first order autoregressive process in a discrete time domain with time step :
| (3) |
where is a Gaussian distributed excitation kick. For more details we refer to deridder2006a . The above is applied to the equations for the pulsation velocity which are obtained by taking the time derivative of the displacement components mentioned in Section 3.2, Eq.(2) of deridder2002 . In case rotation is neglected, the three spherical components of the pulsation velocity, i.e. , and , for the damped and re-excited case become:
| (4) |
| (5) |
| (6) |
with proportional to the pulsation amplitude, the normalisation factor for the spherical harmonics and the ratio of the horizontal to the vertical velocity amplitude.
Line profiles of oscillations with different wavenumbers (), including damping and re-excitation, are simulated at the observation times of Ophiuchi and according to its observed amplitudes. Subsequently, is determined for these profiles in the same way as for the observations. The amplitude and phase distributions are then computed for the dominant oscillation frequencies, as described in section 4.3.
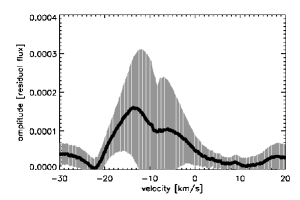
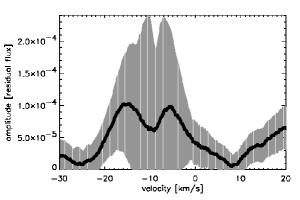
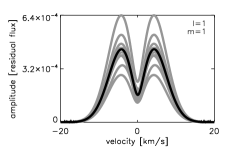
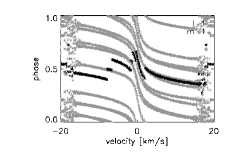
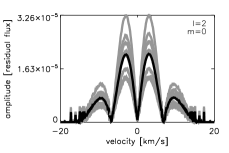
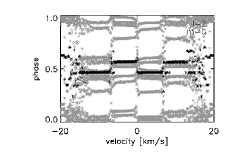
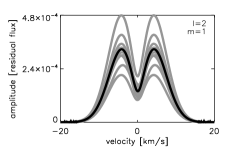
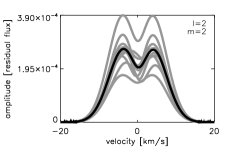
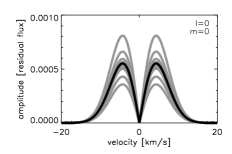
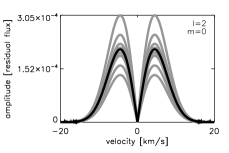
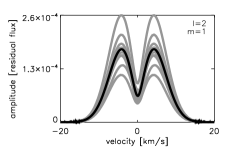
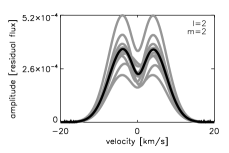
Only in case of an infinite number of observations over an infinite timespan, the real dominant frequency can be obtained for a damped and re-excited oscillator. Smaller samples of observations, single realisations, are all different and have their own dominant frequency and amplitude distribution. In Figures 5 and 6, simulated amplitude and phase distributions for different wavenumbers are plotted at inclination angles and , respectively. For each mode, ten single realisations are plotted in grey, with the average plotted in black. From these Figures it becomes clear that, although all realisations are different from each other, it is still possible from the amplitude distributions, to distinguish between different values, just by visual inspection. In particular, the different realisations for modes all lead to zero amplitude in the line centre. In contrast with the pronounced shapes of the phase diagrams of oscillations with infinite lifetimes (see e.g. right bottom panel Figures 2 and 3 or hekker2006 ), Figures 5 and 6 show that the phase distributions across a profile can be quite different for each realisation due to damping and re-excitation. Therefore, phase distributions across a profile of oscillations with finite mode lifetimes can not yet be explored in terms of mode identification. These results are robust against a change in inclination angle, as can be seen by comparing Figures 5 and 6 with a similar plot for a different inclination provided in hekker2006 .
6 Conclusions
We have found a different amplitude distribution across the cross correlation profile for the dominant frequencies of the pulsating red giant star Ophiuchi. This clearly indicates that modes with different wavenumbers () must be present in the data. Moreover, the amplitude distribution of the dominant mode is clearly different from the one due to modes. Thus, we have detected non-radial modes in the observed cross correlation profiles of this star.
We compared the observed amplitude distributions of Ophiuchi with the one of simulated cross correlation profiles in an attempt to identify the wavenumbers of the individual modes. Due to the fact that single realisations of different modes are in some cases comparable, e.g. for and (see Figures 5 and 6), different sets of wavenumbers are equally likely for observed modes. It is therefore clearly not yet possible to identify the individual modes unambiguously with the method used in the present work, but clear evidence for modes with values is found.
hekker2006 also analysed the line profile variations of three additional pulsating giants and came to similar conclusion than for Ophiuchi for two of these three stars. Moreover, non-radial mixed oscillation modes were recently also found in a red giant observed with the MOST space mission (matthews2006 , these proceedings). It therefore seems that red giant stars pulsate in both radial and non-radial modes. These observational results constitute a fruitful starting point to fine-tune theoretical predictions of stochastically excited modes in evolved stars.
Acknowledgments
SH wants to thank the staff at the Instituut voor Sterrenkunde at the Katholieke Universiteit Leuven for their hospitality during her three month visit. JDR is a postdoctoral fellow of the fund for Scientific Research, Flanders. FC was supported financially by the Swiss National Science Foundation. The authors are supported by the Fund for Scientific Research of Flanders (FWO) under grant G.0332.06 and by the Research Council of the University of Leuven under grant GOA/2003/04.
References
- (1) S. Frandsen, F. Carrier, C. Aerts, D. Stello, T. Maas, M. Burnet, H. Bruntt, T. C. Teixeira, J. R. de Medeiros, F. Bouchy, H. Kjeldsen, F. Pijpers, and J. Christensen-Dalsgaard. Detection of Solar-like oscillations in the G7 giant star xi Hya. A&A, 394:L5–L8, October 2002.
- (2) J. De Ridder, C. Barban, F. Carrier, A. Mazumdar, P. Eggenberger, C. Aerts, S. Deruyter, and J. Vanautgaerden. Discovery of solar-like oscillations in the red giant Ophiuchi. A&A, 448:689–695, March 2006.
- (3) F. Carrier, P. Eggenberger, J. De Ridder, C. Aerts, C. Barban, A. Mazumdar, S. Deruyter, and J. Vanautgaerden. A&A, 2006. in preparation.
- (4) D. Stello, H. Kjeldsen, T. R. Bedding, J. de Ridder, C. Aerts, F. Carrier, and S. Frandsen. Simulating stochastically excited oscillations The mode lifetime of Hya. Sol. Phys., 220:207–228, April 2004.
- (5) C. Barban, J. De Ridder, A. Mazumdar, F. Carrier, P. Eggenberger, S. De Ruyter, J. Vanautgaerden, F. Bouchy, and C. Aerts. Detection of Solar-Like Oscillations in Two Red Giant Stars. In ESA SP-559: SOHO 14 Helio- and Asteroseismology: Towards a Golden Future, page 113, October 2004.
- (6) ESA. The Hipparcos and Tycho Catalogues (ESA 1997). VizieR Online Data Catalog, 1239, February 1997.
- (7) P. C. Keenan and S. B. Yorka. 1988 Revised MK Spectral Standards for Stars GO and Later. Bulletin d’Information du Centre de Donnees Stellaires, 35:37, December 1988.
- (8) F. Bouchy, F. Pepe, and D. Queloz. Fundamental photon noise limit to radial velocity measurements. A&A, 374:733–739, August 2001.
- (9) C. Aerts and P. De Cat. Cep stars from a spectroscopic point of view. Space Science Reviews, 105:453–492, 2003.
- (10) A. Baranne, D. Queloz, M. Mayor, G. Adrianzyk, G. Knispel, D. Kohler, D. Lacroix, J.-P. Meunier, G. Rimbaud, and A. Vin. ELODIE: A spectrograph for accurate radial velocity measurements. A&AS, 119:373–390, October 1996.
- (11) M. Chadid, J. De Ridder, C. Aerts, and P. Mathias. 20 CVn: A monoperiodic radially pulsating delta Scuti star. A&A, 375:113–121, August 2001.
- (12) T. H. Dall, N. C. Santos, T. Arentoft, T. R. Bedding, and H. Kjeldsen. Bisectors of the cross-correlation function applied to stellar spectra. Discriminating stellar activity, oscillations and planets. A&A, 454:341–348, July 2006.
- (13) C. Barban, J. M. Matthews, J. De Ridder, F. Baudin, R. Kuschnig, A. Mazumdar, and R. Samadi. Studying solar-like oscillations in red giants: MOST spacebased photometry of eps Ophiuchi. In ESA SP-624: SOHO 18 / GONG 2006 / HelAs I Beyond the Spherical Sun: A new era of helio- and asteroseismology, 2006.
- (14) C. Aerts, M. De Pauw, and C. Waelkens. Mode identification of pulsating stars from line profile variations with the moment method. an example - The Beta Cephei star Delta Ceti. A&A, 266:294–306, December 1992.
- (15) T. M. Brown, R. Kotak, S. D. Horner, E. J. Kennelly, S. Korzennik, P. Nisenson, and R. W. Noyes. Exoplanets or Dynamic Atmospheres? The Radial Velocity and Line Shape Variations of 51 Pegasi and tau Bootis. ApJS, 117:563, July 1998.
- (16) C. Schrijvers, J. H. Telting, C. Aerts, E. Ruymaekers, and H. F. Henrichs. Line-profile variations due to adiabatic non-radial pulsations in rotating stars. I. Observable characteristics of spheroidal modes. A&AS, 121:343–368, February 1997.
- (17) W. A. Dziembowski, D. O. Gough, G. Houdek, and R. Sienkiewicz. Oscillations of UMa and other red giants. MNRAS, 328:601–610, December 2001.
- (18) J. De Ridder, T. Arentoft, and H. Kjeldsen. Modelling space-based high-precision photometry for asteroseismic applications. MNRAS, 365:595–605, January 2006.
- (19) J. De Ridder, M.-A. Dupret, C. Neuforge, and C. Aerts. Influence of non-adiabatic temperature variations on line profile variations of slowly rotating beta Cephei stars and SPBs. II. Simulations of line profile time series. A&A, 385:572–584, April 2002.
- (20) S. Hekker, C. Aerts, J. De Ridder, and F. Carrier. Pulsations detected in line profile variations of red giants: Modelling of line moments, line bisector and line shape. A&A, 2006.
- (21) J. M. Matthews. Asteroseismology from the MOST space mission: one small satellite, so many light curves. In ESA SP-624: SOHO 18 / GONG 2006 / HelAs I Beyond the Spherical Sun: A new era of helio- and asteroseismology, 2006.