Massive Young Stellar Objects in the Large Magellanic Cloud: water masers and ESO-VLT 34 m spectroscopy
Abstract
We investigate the conditions of star formation in the Large Magellanic Cloud. We have conducted a survey for water maser emission arising from massive young stellar objects in the 30 Doradus region (N 157) and several other H ii regions in the Large Magellanic Cloud (N 105A, N 113 and N 160A). We have identified a new maser source in 30 Dor at the systemic velocity of the LMC. We have obtained 34 m spectra, with the ESO Very Large Telescope, of two candidate young stellar objects. N 105A IRS1 shows H recombination line emission and its Spectral Energy Distribution (SED) and mid-infrared colours are consistent with a massive young star ionising the molecular cloud. N 157B IRS1 is identified as an embedded young object, based on its SED and a tentative detection of water ice. The data on these four H ii regions are combined with mid-infrared archival images from the Spitzer Space Telescope to study the location and nature of the embedded massive young stellar objects and signatures of stellar feedback. Our analysis of 30 Dor, N 113 and N 160A confirms the picture that the feedback from the massive O and B-type stars, which creates the H ii regions, also triggers further star formation on the interfaces of the ionised gas and the surrounding molecular cloud. Although in the dense cloud N 105A star formation seems to occur without evidence of massive star feedback, the general conditions in the LMC seem favourable for sequential star formation as a result of feedback. In an appendix we present water maser observations of the galactic red giants R Doradus and W Hydrae.
keywords:
stars: formation – H ii regions – Magellanic Clouds – stars: pre-main-sequence – infrared: stars – masers1 Introduction
One of the great unknowns in our understanding of star formation concerns the role played by galactic environmental parameters. For instance, molecular cloud processes, e.g. cooling and magnetic field diffusion, depend on the presence of metals, thus it is unlikely star formation is not affected by metallicity. The Magellanic Clouds have metallicity and density of the interstellar media (ISM) that are lower than in the Milky Way. Thus, they provide a star formation template that is more representative of the formation of stars at higher redshifts and offer a step closer towards exploring the formation of the first generation of stars at zero metallicity.
Young pre-main-sequence populations have recently been identified in H ii regions in the Magellanic Clouds (Nota et al., 2006; Gouliermis et al., 2006). However, relatively little work has been done in investigating the earlier, more embedded stages of star formation in the Magellanic Clouds. At the distance of the Large Magellanic Cloud (LMC, 50 kpc), one is limited to study only the most massive stellar embryos that will form massive O and B stars. Infrared (IR) observations are an excellent way to investigate the properties of such objects, both because they are heavily embedded and thus invisible at shorter wavelengths and also because they are surrounded by dense envelopes of gas, dust and ices that are revealed at these wavelengths (van Dishoeck, 2004). Recently, a few massive young stellar objects (YSOs) in the LMC have been investigated (van Loon et al., 2005b; Jones et al., 2005).
Molecular masers (in particular water, hydroxyl and methanol) are very bright emission lines that seem to be closely associated with the earliest stages of massive star formation (de Buizer et al., 2005) when the YSOs are difficult to detect even at IR wavelengths. Maser emission is found in the vicinity of embedded YSOs and thus they are powerful beacons of current star formation in a molecular cloud. Several water maser sources have been discovered in the Magellanic Clouds (see below). In this contribution we describe a new survey of water masing sources in the LMC at 22 GHz with the Parkes Telescope.
In recent years, the 30 Doradus Nebula (N157) has become the paradigm of large scale triggered star formation. As the largest and nearest extragalactic H ii region in the Local Group it offers a rare insight into the spatial and temporal properties of starbursts. Walborn et al. (1999) identified the so-called star-formation fronts, the interfaces between the energetic outflows from the central compact cluster R 136 (first generation star formation episode) and the surrounding molecular clouds, in which there is evidence of ongoing triggered star formation. Water maser emission has also been detected at various locations in 30 Dor (Whiteoak et al., 1983; van Loon & Zijlstra, 2001a; Lazendic et al., 2002). The wealth of bright protostars identified in the region (Rubio et al., 1998; Brandner et al., 2001) hints at the possibility that more masing activity hitherto undetected might be present. We describe our mapping survey of the inner region of 30 Dor, in which we have identified 4 distinct maser sources, one of them new.
Three other H ii regions in the LMC, known to show water maser emission (N 113, N 105A and N 160A; Whiteoak et al., 1983; Whiteoak & Gardner, 1986) are also observed at 22 GHz, as well as most of the previous non-detections for water maser emission in the LMC and SMC (Scalise & Braz, 1982; Whiteoak et al., 1983). Since our observations, Lazendic et al. (2002) also reported 22 GHz water maser emission towards N 159.
The H ii region N 113 (Henize, 1956) shows a complex structure of H bubbles with a rich molecular gas and dust morphology. Several young clusters are associated with N 113 (Bica, Claria & Dottori, 1992) and current star formation activity is occuring within continuum sources in the central area of the nebula (Brooks & Whiteoak, 1997; Wong et al., 2006). The H ii region N 105 (Henize, 1956) is a complex of evacuated bubbles and dense molecular material with several young clusters associated with it (Ambrocio-Cruz et al., 1998); current star formation as indicated by maser activity seems to concentrate in the denser central part of the region, N 105A. N 160A is the brightest component in the N 160 H ii complex (Henize, 1956). Besides maser emission, both an embedded protostar (Henning et al., 1998) and a dense molecular core (Bolatto et al., 2000) point at ongoing star formation. Heydari-Malayeri et al. (2002) and Nakajima et al. (2005) describe the gas morphology and stellar content of N 160.
In order to investigate the relationship between the masers and the gas kinematics and star formation activity, we have obtained narrow-band H images at the AAT of N 113, and L′-band images and 34 m spectroscopy at the ESO-VLT in N 157B and N 105A. These new observations, combined with archival IRAC/Spitzer images are used to relate the embedded population to the local gas and dust morphology.
2 Observations
The new observations used in this paper are described in this section and a summary is given in Table 1.
| H ii region | 22 GHz | H image | image | Spitzer 8 m image | L-band spectrum | IR SED |
|---|---|---|---|---|---|---|
| 30 Dor (N 157A) | map | + | ||||
| N 157B | single pointing | + | + | IRS1 | IRS1 | |
| N 113 | sparse map | + | + | |||
| N 105A | single pointing | + | + | IRS1, Blob | IRS1 | |
| N 160A | single pointing | + |
2.1 The 22 GHz survey at Parkes
The 64 m radio telescope (effective diameter of 45 m) at Parkes, Australia, was used from June 30 to July 9 2001, with the K-band (1.4 cm) receiver plus autocorrelator back-end to observe the rotational transition of ortho-H2O at a rest frequency of 22.23507985 GHz. The observations were performed at GHz yielding a velocity coverage of km s-1 with 0.42 km s-1 channel-1. Using the dual circular feed, spectra were obtained simultaneously in left and right circular polarisation; these were then averaged.
The system temperature varied between 120 and 140 K. The conversion factor from antenna temperature to flux density was 6 Jy K-1. Observing conditions were sometimes rather unstable due to clouds. The on-source integration time was 20 min per pointing. The pointing and focus were checked regularly by observing the bright maser sources R Doradus and W Hydrae (see Appendix B). The absolute flux calibration is accurate to 20 per cent.
The obtained spectra were corrected for two distinct baseline effects: a low-frequency feature (easily removed with a 3rd-degree polynomial) and an interference signal with a frequency of MHz. The shape of this interference was re-constructed by median averaging the cycles within each spectrum, and was then subtracted from the spectrum.
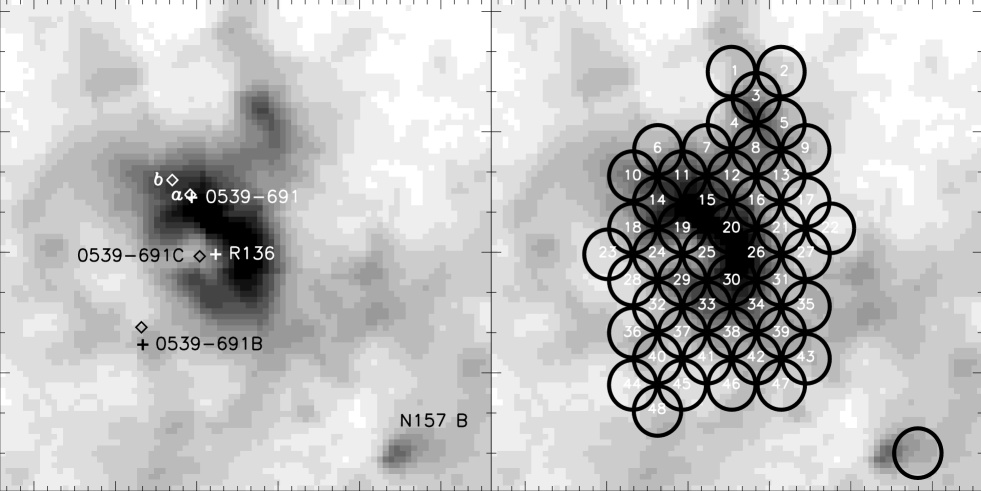
The observations in the central area of 30 Doradus (LHA 120-N 157A) were performed on a double grid system (): the primary grid has a separation of one beam, i.e. ; the secondary grid positions are obtained by shifting the primary grid positions by in right ascension and declination. We performed 58 pointings at 47 distinct positions around R 136 (some positions deemed interesting were observed twice), covering a area. The pointings are shown in Fig. 1, superimposed on a Midcourse Space eXperiment (MSX) 8 m image. An extra pointing was performed on N 157B, but note that it is offset by 1 from the peak emission in the mid-IR.
The observations of N 113 were performed in a 5-position dither pattern with shifts. Single pointings were performed towards a number of other H ii regions; maser sources were detected towards N 105A and N 160A, while for 11 other regions no masing source was detected (see Appendix A).
2.2 The 34 m observations at the VLT
The Infrared Spectrometer And Array Camera (ISAAC) on the European Southern Observatory (ESO) Very Large Telescope (VLT), Chile, was used on 7 and 8 December 2003 to obtain long-slit spectra between 2.85 and 4.15 m of two candidate embedded YSOs. MSX LMC 888 (Egan, van Dyk & Price, 2001) (henceforth N 157B IRS1) is located in the 30 Dor region and was selected based on its very red colours (consistent with a massive YSO) while MSX LMC 80 (N 105A IRS1) is a candidate protostar first identified by Epchtein, Braz & Sèvre (1984) — see Sect. 3.2 for a complete discussion on these sources.
The resolving power of was set by the seeing rather than the slit width. The thermal-IR technique of chopping and nodding was used to remove the background, with a throw of , jittering within to correct for bad pixels. Total exposure times were 12 minutes. The spectra were extracted using an optimal extraction algorithm. An internal Xe+Ar lamp was used for wavelength calibration. The relative spectral response was calibrated by dividing by the spectrum of the B-type star HIP 020020, observed within an hour from the targets at the same airmass and similar seeing. This removed most of the telluric absorption lines — except the saturated methane line at 3.32 m — but introduced artificial emission features due to the photospheric lines of HIP 020020. The spectra were therefore multiplied by a hot blackbody continuum with Gaussian-shaped absorption lines of Br 4.052, Pf 3.741, Pf 3.297, Pf 3.039 and Pf 2.873 m scaled to match those in HIP 020020. More details can be found in van Loon et al. (2006).
The acquisition images were obtained through the L′ filter (3.78 m, bandwidth m). At a scale of pixel-1, the (array-windowed) field-of-view was . The images were obtained in chopping-only mode, with a throw of in the North-South direction. The total exposure time was 20 seconds. The photometric accuracy is of the order of 0.10.2 mag, found from cross-correlation of acquisition images of other targets in the same observing run with dedicated L′-band photometry (van Loon et al., 2005a).
2.3 The H mapping at the Anglo-Australian Telescope
The Taurus Tunable Filter instrument on the Anglo-Australian Telescope (AAT), Australia, was used on 17 July 2001 to obtain narrow-band H images of N 113. The blue etalon was used in combination with the EEV CCD, at a spectral resolution of 7 Å around H. The central wavelength was set to Å, corresponding to a Doppler shift similar to that of the LMC. The technique of charge-shuffling was applied to take a series of three consecutive images before reading out the CCD, where each image was taken on the same area of the CCD but at a central wavelength of , and , respectively. Each image received an integration time of 1 minute, and a total of six such cycles were performed before CCD read-out. This was repeated with images taken at , and , respectively, to improve the spatial and spectral sampling of H; as the instrument is placed in the pupil the wavelength changes with radial distance in pixels as (cf. Bland & Tully, 1989):
| (1) |
where m is the pixel size and mm the camera focal length. The two sets of observations were repeated with an offset of in the North-South direction to cover more of N 113. The observations were made at a distance of from the zenith and a seeing of .
The data were corrected for bias offset and divided by a flatfield image. For each of the two pointings the images were combined to produce one image corresponding to the H line emission and another image corresponding to the underlying continuum emission. This was done on a pixel-by-pixel basis by assuming that the H emission has a gaussian spectral shape with a FWHM of 7 Å, and that the continuum is flat. The resulting H image is very clean with most stars removed. The main H emission structures are so strong that they are still present in the “continuum” image, albeit at a much lower level (Sect. 3.4).
2.4 Additional infrared data
Near-IR photometry is taken from the 2-Micron All-Sky Survey (2MASS, Cutri et al., 2003). Embedded massive stars have very red colours, thus, at the distance of the Magellanic Clouds, most embedded YSOs are only detected by 2MASS in the Ks-band. Hence, bright Ks-band sources with faint or undetected shorter wavelength counterparts in 2MASS are embedded YSO candidates.
For the two luminous IR objects, N 157B IRS1 and N 105A IRS1 (Sect. 3.2), mid-IR photometry at 8.28, 12.1, 14.7 and 21.3 m is taken from version 2.3 of the Mid-course Space eXperiment (MSX) Point Source Catalogue (Egan et al., 2003). The spatial resolution of these data varies from at 8.28 m, to at 21.3 m. We also collected scans from the IRAS data server111http://www.astro.rug.nl/IRAS-Server/ for these two sources, to measure their 12, 25, 60 and 100 m flux densities using the Groningen Image Processing SYstem (GIPSY) software with the scanaid tool. These measurements were fully consistent with the IRAS Point Source Catalogue (Beichman et al., 1988), but contrary to the PSC we were able to obtain a measurement for N 157B IRS1 also at 60 and 100 m. In addition, for N 105A IRS1 we inspected Low Resolution Spectrograph scans from the IRAS data server. The three complete scans are fully consistent with each other, and show a weak depression around 10 m which could be indicative of absorption by silicate dust. The mid-IR photometry helps constrain the luminosity and hence the mass of the star.
In our analysis of the morphology of the 4 H ii regions we also made use of archival images obtained with the Spitzer Space Telescope (Werner et al., 2004), using its Infrared Array Camera (IRAC, Fazio et al., 2004). IRAC images of 30 Dor were obtained under Early Release Observation programme #1032 (P.I. B. Brandl). Both N 105A and N 113 observations are part of the cycle 2 Legacy programme #20203 (P.I. M. Meixner) while the N 160A observations are part of the Guaranteed Time Observations programme #124 (P.I. R. Gehrz). Extended pipeline products (i.e. flux-calibrated image mosaics) for the 4 IRAC bands (3.6, 4.5, 5.8 and 8.0 m) were retrieved from the Spitzer archive222http://ssc.spitzer.caltech.edu/archanaly/. We have performed aperture photometry on the IRAC mosaics, for the sources present in the L′ acquisition images. We performed aperture corrections but not array-location dependent corrections or colour corrections (Reach et al., 2005), so fluxes might be uncertain by as much as 10 per cent, still fully adequate for our analysis (see Sect. 3.3).
3 Results
3.1 22 GHz survey
3.1.1 Mapping of 30 Dor (N 157)
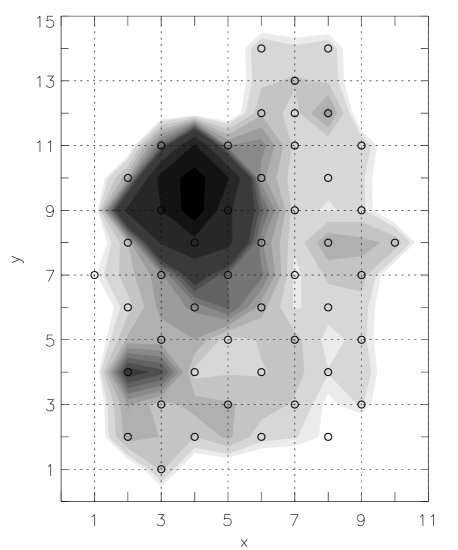
The goal of the 30 Dor survey was to detect maser sources and locate their positions to better than the beam size. We assume that the sensitivity of the telescope beam is a function of the distance to beam centre, represented by a gaussian distribution. We reconstruct the spectra at each position in the observed grid by combining each spectrum with the available adjacent spectra in the grid, weighted by their variance and the gaussian weight corresponding to the distance between the grid points. With this process we improve signal-to-noise ratio and detection sensitivity. By integrating the flux of the strongest spectral feature in each spectrum, we construct the intensity map shown in Fig. 2. This map shows the location of the strongest intensity peaks; in a second step the spectra at each of those intensity peaks and closely surrounding ones are checked (e.g., for velocity consistency) to separate bona-fide maser sources from spurious peaks. The detection sensitivity is 1 Jy km s-1 ( 5). It can been seen from this image that there are 2 main flux enhancement regions: a complex region towards the top, that actually includes multiple masing sources and a single source area towards the bottom of the diagram.
| Maser source | peak velocity | peak intensity | RA 2000 | Dec 2000 | pointings |
| (km s-1) | (Jy) | () | () | identification | |
| 0539691a | 269.5 | 2.750.60 | 05 38 49.9 | 69 04 34 | 6, 7, 10, 11, 12, 14, 15, 18, 19 |
| 0539691b | 261.0 | 0.380.09 | 05 38 55.2 | 69 04 12 | 6, 10, 11, 18, 19 |
| 0539691B | 194.0 | 0.360.09 | 05 39 04.3 | 69 07 52 | 32, 36 |
| 0539691C | 266.0 | 1.010.27 | 05 38 47.1 | 69 06 06 | 19, 20, 25, 29, 30 |
| N 113a | 253.0 | 73.816.0 | 05 13 23.1 | 69 22 34 | |
| N 113b | 254.5 | 19.44.4 | — | — | |
| N 113c | 251.0 | 4.61.1 | — | — | |
| N 113d | 258.0 | 2.00.5 | — | — | |
| N 160A | 253.0 | 3.30.7 | 05 39 42.7 | 69 38 26 | |
| N 105A | 260.0 | 1.50.3 | 05 09 50.7 | 68 53 23 | |
| N 157B | — | 0.13 (rms) | 05 37 40.2 | 69 11 00 |
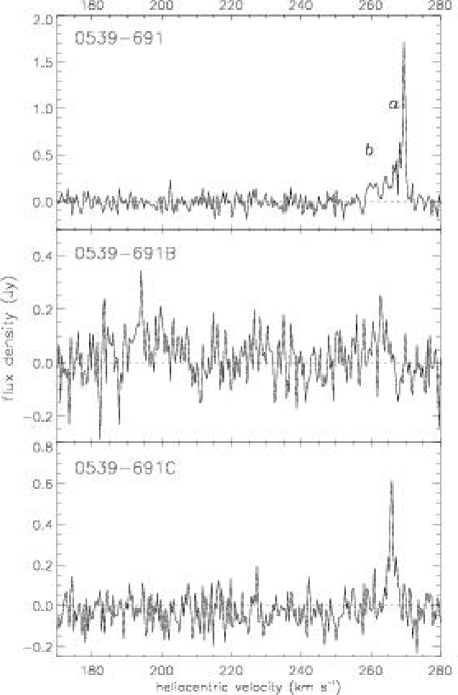
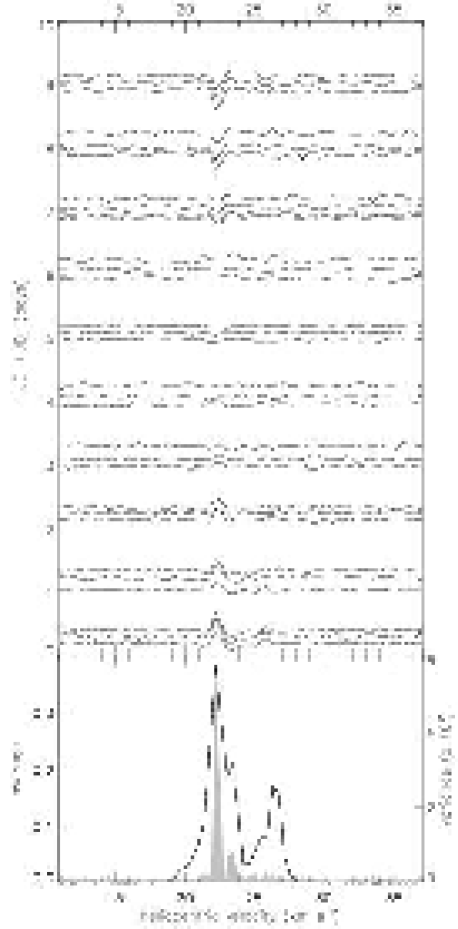
On kinematic and flux intensity grounds, we have identified 4 distinct water maser peaks in 30 Doradus. In each spectrum where the maser emission is present, we measure the peak intensity of each component at the velocities listed in Table 2. We obtain a spatial representation of the intensity of each component that we fit with a two-dimensional gaussian distribution with three free parameters: the amplitude and position () of the centre — the width of the distribution is fixed by the beam size. The amplitude translates into the intrinsic intensity of the source and the centre is converted into right ascension and declination coordinates of each component, with a typical positional accuracy of a quarter of a beam size, 20. In Table 2 we list the measured velocity, intensity and position of each maser source, as well as their identifications (see below). The last column provides the pointings at which the masers were detected (Fig. 1). The maser spectra are presented in Fig 3.
0539691 was first detected at 22 Ghz by Whiteoak et al. (1983), in a region northeast of R 136. van Loon & Zijlstra (2001a) further analysed this region, detecting 0539691 as well as a new water maser source, 0539691B, located southeast of R 136. On kinematic grounds the authors distinguish two masing sources in 0539691, one with a velocity consistent with the systemic velocity of the local ISM ( km s-1) — this is the source originally identified by Whiteoak et al. (1983) and also observed by Lazendic et al. (2002) — and a component blue-shifted by 70 km s-1. 0539691B was also found to be blueshifted with respect to the systemic velocity by 90 km s-1.
We find that the maser 0539691 comprises 2 components (a and b) with peak velocities and 270 km s-1. They are very close () and component b is rather weak, thus it is conceivable that it is a single source. Lazendic et al. (2002) also detect a component with peak velocity 269.5 km s-1 and they pinpoint its location very accurately. They claim that their spectrum also contains additional faint emission extending down to 258 km s-1 that might be related to our component b. We did not detect the blueshifted component detected in 0539691 by van Loon & Zijlstra (2001a). We do identify a weak source with peak velocity of 194 km s-1, located from 0539691, with 0539691B (van Loon & Zijlstra, 2001a). We have discovered a new maser source closer to R 136 ( South from 0539691), that we call 0539691C. It has a velocity of km s-1, consistent with the systemic velocity. Despite the large survey area, this is the only new component we identified. No maser emission was detected towards N 157B, at an rms level of 0.13 Jy but note that the target was not well centered in the telescope beam.
3.1.2 Sparse map of N 113


Water maser emission at 22 GHz was first observed in N 113 by Whiteoak & Gardner (1986). We performed 5 pointings in this region. The method used to analyse the spectra of N 113 is similar to what was outlined in the previous section for 30 Doradus, except with fewer pointings. In Fig. 4, we plot the central spectrum of our mosaic of pointings in N 113, with 4 components identified as a, b, c and d.
We were not able to disentangle the positions of the different components, so we cannot establish positively how many spatially-distinct masers are there in this region. However, from the analysis of the peak intensity variations in our mosaic of pointings, we find evidence that component c might originate from a different position than the remaining components: at the position northwest of the central pointing, the peak intensity of component c was reduced by per cent, while the peak intensities of the other components were reduced to per cent. Lazendic et al. (2002) recently identified 2 distinct masers sources in N 113, apart, and with peak velocities 253 and 250 km s-1. We identify our multiple component source a, b and d with the Lazendic et al. (2002) component at 253 km s-1; based on the peak velocity, we believe our component c is the Lazendic et al. (2002) component at 250 km s-1. The strongest masing component is weaker than in the Lazendic et al. (2002) measurements. We note that water maser emission associated with YSOs is known to be variable both in intensity and velocity (Palagi et al., 1993; Tofani et al., 1995).
3.1.3 Other regions in the LMC
Fig. 5 shows the maser detections towards N 160A (top) and N 105A (bottom). We are unable to derive accurate position information from these observations but both these sources have been observed also by Lazendic et al. (2002), providing positions with subarcsecond accuracy. The maser spectrum of N 105A is similar to that reported previously, both in kinematic complexity and intensity. For N 160A two maser locations, approximately 44 apart have been identified previously at essentially the same velocity. It is very likely that both those components contribute to the signal in our spectrum; indeed the flux ratios of the brighter component at 253 km s-1 to the other two components at 248 and 259 km s-1 are consistent with what would be expected if the two components of Lazendic et al. (2002) were combined.
3.2 VLT 34 m observations
| LHA 120-… | RA 2000 | Dec 2000 | J | H | Ks | L′ | JKs | KL′ |
|---|---|---|---|---|---|---|---|---|
| () | () | (mag) | (mag) | (mag) | (mag) | (mag) | (mag) | |
| N 157B S1 | 05 37 45.5 | 69 11 10 | 1.560.06 | 0.470.03 | ||||
| N 157B S2 | 05 37 46.0 | 69 11 15 | 0.500.08 | |||||
| N 157B IRS2 | 05 37 46.1 | 69 10 50 | 2.940.09 | |||||
| N 157B S3 | 05 37 46.4 | 69 11 17 | 0.460.07 | 0.130.09 | ||||
| N 157B IRS1 | 05 37 50.3 | 69 11 07 | 4.480.12 | 3.880.03 | ||||
| N 157B S4 | 05 37 51.4 | 69 10 56 | 1.310.06 | 0.230.06 | ||||
| LHA 120-… | RA 2000 | Dec 2000 | J | H | Ks | L′ | JKs | KL′ |
| () | () | (mag) | (mag) | (mag) | (mag) | (mag) | (mag) | |
| N 105A S1 | 05 09 45.6 | 68 53 19 | 1.030.05 | 0.030.16 | ||||
| N 105A S2 | 05 09 47.5 | 68 53 36 | 1.050.03 | 0.220.02 | ||||
| N 105A S3 | 05 09 48.4 | 68 52 51 | 0.950.12 | 0.270.17 | ||||
| N 105A S4 | 05 09 48.5 | 68 52 44 | 0.910.07 | 0.200.09 | ||||
| N 105A S5 | 05 09 49.1 | 68 52 54 | 0.780.09 | 0.150.18 | ||||
| N 105A S6 | 05 09 50.3 | 68 53 35 | 1.690.11 | 0.560.14 | ||||
| N 105A IRS1 | 05 09 50.6 | 68 53 05 | 3.890.10 | |||||
| N 105A IRS2 | 05 09 52.0 | 68 53 29 | ||||||
| N 105A S7 | 05 09 52.3 | 68 53 20 | 0.550.24 | |||||
| N 105A blob A | 05 09 52.9 | 68 53 01 | 1.510.13 | 0.190.15 | ||||
| N 105A blob B | 05 09 52.5 | 68 53 02 | ||||||
| N 105A S8 | 05 09 53.8 | 68 52 53 | 0.520.06 | 0.530.11 | ||||
| N 105A S9 | 05 09 55.6 | 68 53 13 | 1.280.05 | 0.150.17 |
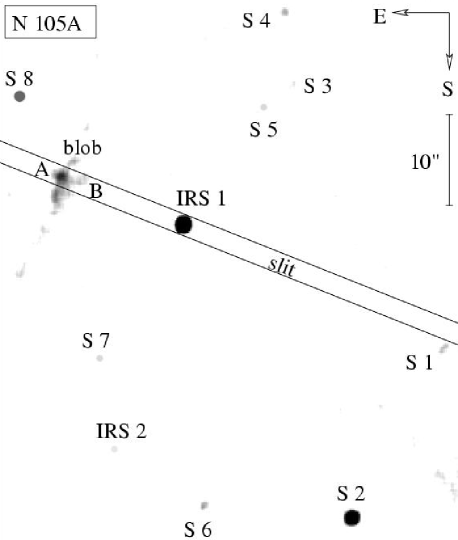
The L′-band acquisition images of N 157B and N 105A allow us to identify a number of red sources other than the two spectroscopic targets. Aperture photometry was performed on all sources in each image. Very red objects (typically mag) are referred to as “IRS”, and these are numbered on the basis of the colour and L′-band brightness. These IRS objects have significant excess emission at 3 m (Fig. 7) and are not simply reddened objects behind the molecular clouds. The other point sources are referred to as “S”, and these are numbered with increasing RA. Two other sources in N 105A seem to be diffuse in nature, at least in the L′-band, so they are named blob A and B (see discussion below). The identification, 2MASS positions and magnitudes and L′-band magnitudes are listed on Table 3. In the next subsections these sources and the IR spectra are described in detail.

3.2.1 Infrared sources in N 157B
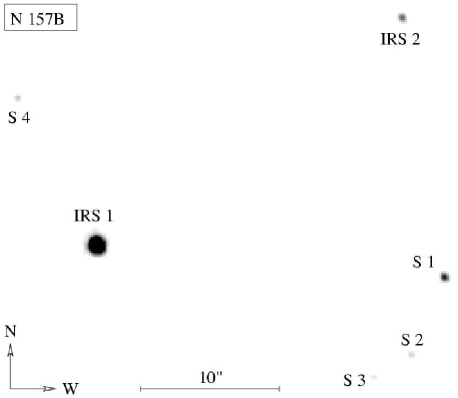
MSX LMC 888 (=IRAS 053816912, Egan et al., 2001) is a bright mid-IR point source in the 30 Dor region, situated within from N 157B (usually identified as SNR 053869.1, although Chu et al. (2004) question the nature of the nebula as a supernova remnant). Close to N 157B there is a small molecular cloud, JGB 30 Dor-22, with a diameter of 6.8 pc identified from CO observations (Johansson et al., 1998). The cold emission from the molecular cloud appears spatially resolved on MSX images, whilst the bright mid-IR source stands out through its warmer unresolved emission.
In our L′-band image (Fig. 6), the MSX source is easily identified as a bright IR star, that we call N 157B IRS1. There is at least one other star nearby also with extreme colour, N 157B IRS2. IRS2 is seen in the direction of the molecular cloud and may be located behind it, but its very extreme colour suggests it could also be a young object embedded in the cloud, warming the surrounding dust. IRS2 is considerably fainter than IRS1. N 157B S1 and S4 have 1.3 mag but 0.5 mag and are likely suffering from extinction by dust within the molecular cloud.

The spectrum of N 157B IRS1 (Fig. 8) seems at first glance featureless. It does not resemble spectra of evolved stars, e.g. a heavily reddened, late-M type giant (cf. Matsuura et al., 2005; van Loon et al., 2006). There is also no evidence for H recombination emission lines arising from an ionised region (Sect. 3.2.2). When the spectrum is plotted as optical depth with respect to a pseudo-continuum (a low-order polynomial fit) there seems to be a hint of the broad water ice feature at 3.1 m, similar to that in IRAS 053286827 (van Loon et al., 2005b) also in the LMC. The evidence is, however, not conclusive with a column density at most cm-2. It is unclear what are the narrow absorption features blueward of 3.5 m.
3.2.2 Infrared sources in N 105A
MSX LMC 80 (=IRAS 051016855, Egan et al., 2001) is a bright IR source in the H ii region LHA 120-N 105A. It is associated with an IR object that was suggested by Epchtein, Braz & Sèvre (1984) to be a “protostar”. This object, which we shall refer to as N 105A IRS1, is very bright in the L′-band (Fig. 6) and with mag it is extremely red (Table 3). It is not detected in the J and H-band of 2MASS, so it is probably heavily extincted.
LHA 120-N 105A blob is associated with a small but extended nebulosity at a projected distance of from IRS1 and from S8, the WR star Br 16a (Dopita et al., 1994). We identify a bright core, blob A, surrounded by patchy emission visible in the L′-band image (Fig. 6). This diffuse core has a point-source 2MASS counterpart, but the 2MASS images seem to show some diffuse emission too. We have assigned an identifier to one of these patches, blob B, because it happened to fall in the slit of the spectrograph and produce a clear signal (see below). Continuum emission was detected at 6.6 GHz (Ellingsen et al., 1994), centred on IRS1 and blob A, connecting the two sources. It thus appears that both these sources are embedded in an ionised environment (see below), probably created by IRS1 itself or a source within blob A. The colour of the bright knot blob A is not particularly red (Fig. 7) even though = 1.51 mag suggests some extinction.
IRS2 is a very faint source located within from the positions of the water (Lazendic et al., 2002) and OH masers (Brooks & Whiteoak, 1997). It was not detected in the 2MASS survey, but appears as a very faint star in our L′-band image (Fig. 6). Given the low density of stars in the image the association with the masers is suggestive. This object could be an embedded YSO. The methanol maser detected by Sinclair et al. (1992) unfortunately falls just outside the SE corner of the field of the L′-band image (see also Ellingsen et al., 1994).
Several more sources can be identified from Fig. 6. They all appear stellar in nature and have 0.6 mag. S6 and S9 have 1.2 mag thus they could be situated behind the molecular cloud. The remaining sources have unremarkable near-IR colours.

3.2.3 Hydrogen line emission and outflows in N 105A
The spectrum of N 105A IRS1 shows a very red continuum, very likely free-free emission (see Sect. 3.3), underlying H recombination line emission (Fig. 9). There is no evidence in the spectrum for broad ice features. The Br line is about eight times as bright as the continuum, but the Pf line cannot be positively detected. This suggests a high dust column density in front of the region in which the line emission arises. The Br line emission is blended at this resolution with emission from He i at 4.0378, 4.0410 and 4.049 m; this emission is very weak when compared to Br (Drew, Bunn & Hoare, 1993) so it has a negligible effect on the measured fluxes. We have measured the line fluxes of Br and Pf; the Br to Pf flux ratio is 9. This ratio can be compared to the prediction from recombination theory. We consider case B treatment (e.g., Hummer & Storey, 1987) and adopt K and cm-3 — the emission coefficients are not very sensitive to temperature or density. Using the Hummer & Storey (1987) computed values, the theoretical flux ratio is predicted to be 7.5. If we adopt a simple power law for the extinction as a function of wavelength (Mathis, 1990), we estimate that the Br to Pf flux ratio for IRS1 is consistent with case B scenario affected by mag. This agrees very well with the reddening needed to fit the object’s Spectral Energy Distribution (SED, Sect. 3.3).
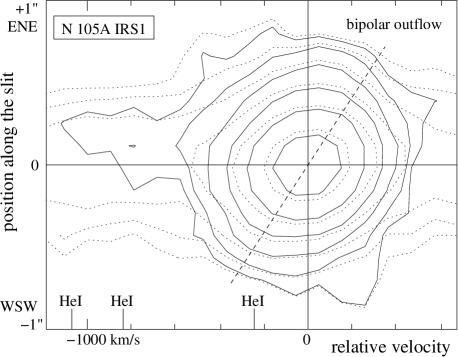
The Br line is marginally resolved in IRS1, both spatially and kinematically. To study the spatial distribution of the Br emission we plot a position-velocity diagram, in which one axis is the dispersion direction and the perpendicular axis is the spatial direction along the slit (Fig. 10). A spatial profile for the continuum emission is obtained by averaging many columns on the array at either side of the emission line. After subtracting this continuum (solid lines in Fig. 10), the line profile has broad wings and shows a clear asymmetry with emission in the WSW moving towards us and emission in the ENE moving away. This is strong evidence for a bipolar outflow originating near the centre of IRS1, at a projected velocity of km s-1 at a few tenths of an arcsecond ( pc) at either side of the star.
Blobs A and B also show emission in the H recombination lines but in this case also Pf is detected (Fig. 9), indicating that extinction by dust is less severe than towards IRS1. Continuum emission in this source is extremely faint, if at all present. Both components show evidence for broad emission around 3.3 m underlying the Pf line. The shape of this emission is consistent with the 3.28 m unidentified IR feature that is usually attributed to Polycyclic Aromatic Hydrocarbons (PAHs, Allamandola et al., 1985). The Br to Pf flux ratio for blob A is 5, which might suggest that Br is optically thick (Drew et al., 1993).
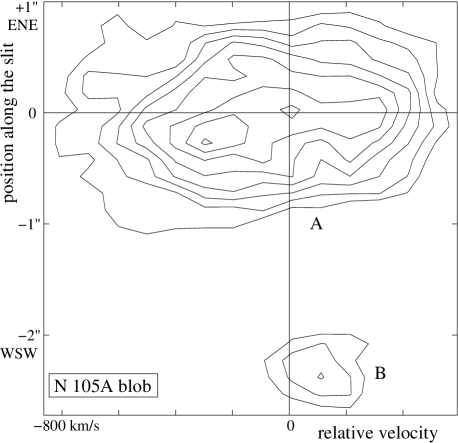
The spectrum of blob A seems broader than IRS1 and exhibits a double-peaked line profile (Fig. 9), suggestive of an outflow also emanating from this nebular object. The position-velocity diagram of the Br line (Fig. 11) shows a kinematically broad emission suggesting a compact outflow at a projected velocity of km s-1. The spectrum shows departures from spherical symmetry: the brightest emission, at to the WSW of the core of blob A, is associated with gas that is preferentially moving towards us. Blob B, on the other hand, is kinematically cold and shows no signs of outflow. This seems to suggest that there might be a source powering an outflow in blob A, even if there is no evidence of free-free continuum from an ionised medium.
3.3 Spectral Energy Distributions of N 157B IRS1 and N 105A IRS1
We performed aperture photometry in the IRAC images for the objects identified in the L′-band images, obtaining both fluxes and magnitudes (Reach et al., 2005). The 3.6 m magnitudes agree quite well for most sources in N 105A and N 157B, except for the objects in areas where the “nebulosity” appears denser (Figs. 14 and 15). In these areas the background is not correctly estimated, and measured fluxes are depressed. Nevertheless, the colours of these objects can still provide another hint on their nature. We briefly discuss here only the objects with measurements in the 4 IRAC bands: N 105A IRS1, IRS2, blob A+B and S2, and N 157B IRS1 and IRS2.
Jones et al. (2005, and references therein) defines the locus for red giants, Class II YSOs (objects with disks), Class I YSOs (embedded objects) and H ii regions. N 105A S2 has colours consistent with it being a red giant. N 105A IRS2, N 157B IRS2 and N 105A blob A+B have colours consistent with H ii regions, i.e. regions with ionised gas and less dust column density. N 105A IRS1 has colours consistent with a very reddened compact H ii region, in agreement with the presence of H recombination lines in its spectrum, reddening determination and the findings of the SED analysis (see below). N 157B IRS1 has colours consistent with an embedded (Class I) YSO.
| Name | IRAC | MSX | IRAS | |||||||||
|---|---|---|---|---|---|---|---|---|---|---|---|---|
| 3.6 m | 4.5 m | 5.8 m | 8.0 m | 8.28 m | 12.1 m | 14.7 m | 21.3 m | 12 m | 25 m | 60 m | 100 m | |
| N 157B IRS1 | 0.173 | 0.313 | 0.483 | 0.635 | 0.960.04 | 1.620.09 | 1.890.12 | 4.20.3 | 4.00.3 | 253 | 17020 | 14040 |
| N 105A IRS1 | 0.028 | 0.063 | 0.181 | 0.473 | 1.720.07 | 4.700.24 | 6.610.40 | 20.71.2 | 8.00.3 | 562 | 31010 | 40020 |
| Name | central source | dust type | ||||||
|---|---|---|---|---|---|---|---|---|
| (K) | (g cm-3) | (AU) | (pc) | (mag) | (L⊙) | |||
| N 157B IRS1 | 25 000 K blackbody | silicate | 730 | 350 | 1.7 | 23 | ||
| N 105A IRS1 | free-free (911 Å…10 cm) | 0.7 silicate + 0.3 carbon | 350 | 2500 | 1.2 | 48 |

The spectral energy distributions (SEDs) of N 105A IRS1 and N 157B IRS1 were reproduced with the dust radiative transfer model dusty (Ivezić, Nenkova & Elitzur, 1999), as an attempt to derive approximate quantitative information about these YSOs. The fits are shown along with the observed SEDs in Fig. 12, and the main fit parameters are summarised in Table 5. In both cases we could obtain a reasonable fit to the SED with a radial dust density profile (steady accretion), and a standard MRN grain size distribution (Mathis, Rumpl & Nordsieck, 1977). The dust envelope was assumed to be spherically symmetric; this is probably not strictly true. The bolometric luminosity was derived from scaling the model SED to fit the observed SED and using a value for the distance to the LMC of 50 kpc.
The main difference between the two objects is in the nature of the central source. In the case of N 157B IRS1 we place a black body of 25,000 K in the centre of the dust envelope. Such hot star is required to reproduce the SED throughout the bands where the star becomes noticeable; at longer wavelengths (including the 34 m band) the SED is dominated by dust emission. Based on the SED analysis alone, we cannot entirely rule out the possibility that this is an evolved dust-enshrouded red supergiant of around 1015 M⊙. However, this would imply a rather long ( Myr) time-gap between the formation of this massive star and the star formation that is currently taking place in the 30 Dor region — Walborn & Blades (1997) identified 5 different stellar populations in the 30 Dor nebula, with ages in the range and 10 Myr. A chance coincidence of such rare object with N 157B is extremely unlikely. Furthermore the cautious identification of water ice (Sect. 3.2.1) argues against it.
In the case of N 105A IRS1, the 34 m spectrum clearly indicates the presence of an ionised region inside of the dust envelope. We thus represented the central source by a free-free emission object. There can be little doubt that this is a young object and the surrounding dust is not produced by the central star, and we therefore used a mixture of amorphous oxygen-rich silicates (Ossenkopf, Henning & Mathis, 1992) and carbon (Hanner, 1988). The SED is rather well reproduced, especially throughout the 34 m band, and the optical extinction used in the model is consistent with that estimated from the hydrogen emission line ratios (see Sect. 3.2.2). The dust envelope is cold, again consistent with a cavity created by the emerging H ii region powered by a massive YSO. The bolometric luminosity of N 105A IRS1 suggests a central star of spectral type O5 and about 43 M⊙ (Hanson, Howarth & Conti, 1997).
3.4 H map of N 113
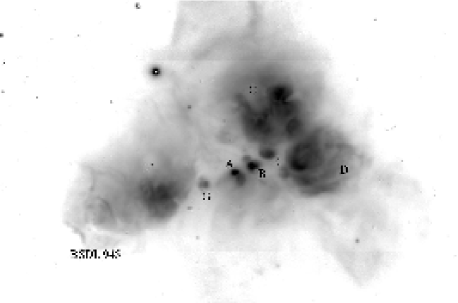
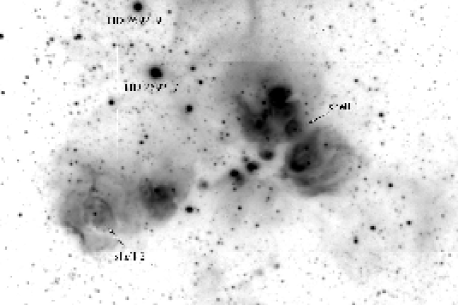
The H images of N 113 (Fig. 13) show a wealth of detail. The line emission is so strong that it is still apparent in the pseudo-continuum image (though at a much fainter level). The main extended structures are three regions of H emission to the east, north and west of the centre of the H ii region: N 113F, N 113C and N 113D, respectively. This is emphasised by an obscuring lane running across the H ii region, onto which are projected (from east to west) N 113A, N 113B and N 113E: “a chain of three small intense knots of nebulosity which, together, make up NGC 1877” (Henize, 1956). There is a fourth such knot — which we name N 113G — in between N 113A and N 113F. Although fainter, it stands out well against the dark dust lane.
N 113C and the lower surface brightness nebula BSDL 945 (Bica et al., 1999) to the east of N 113F each contain a particularly striking example of a shell with a central star (indicated in Fig. 13 as “shell 1” and “shell 2”). These shells are likely to be stellar wind-blown bubbles with a dynamical timescale of only a few yr (for a wind speed of order km s-1). The central star of shell 1 can be identified with a B00.5 III star (Wilcots, 1994), but the central star of the larger shell 2 remains anonymous.
Several OB stars in N 113 have been described in the literature. Near the edge of the H emission, the evolved B2[e] supergiant HD 269217 (= Hen S 89, R 82, IRAS 051366925, MSX LMC 216) has enjoyed considerable attention. It was first mentioned in Merrill & Burwell (1933) as a B star with strong Balmer line emission. Descended from a 30 M⊙ main sequence star, it has been associated with circumstellar dust and found to move at a heliocentric speed of km s-1 (Zickgraf et al., 1986). Another, little studied emission-line star HD 269219 (= Hen S 90) is found further north and away from the H ii region. Closer to the core of the H ii complex, HV 2377 is an M-type suspected supergiant. Both around and embedded within N 113 are a number of O9B0.5 stars — either on the main sequence or slightly evolved (Brunet et al., 1975; Wilcots, 1994).
4 Discussion
4.1 Triggered star formation in the mini-starburst 30 Doradus and N 157B
The central area of the 30 Dor nebula (N 157A) exhibits a complex star formation history. As already mentioned, Walborn & Blades (1997) disentangled five distinct stellar populations in the central area of 30 Dor. The population located mainly in the molecular filaments to the west and northeast of R 136 shows spectroscopic evidence of extreme youth ( Myr). These infant objects are spatially related with bright, compact IR sources within a complex nebular and dust morphology (Hunter et al., 1995): pillars of molecular gas and dust and dark globules (Walborn et al., 1999, 2002), which are being photo-evaporated by the intense radiation from the massive compact cluster R 136 (Hunter et al., 1995). Together with the maser sources, this constitutes strong evidence that star formation is ongoing in the nebula.
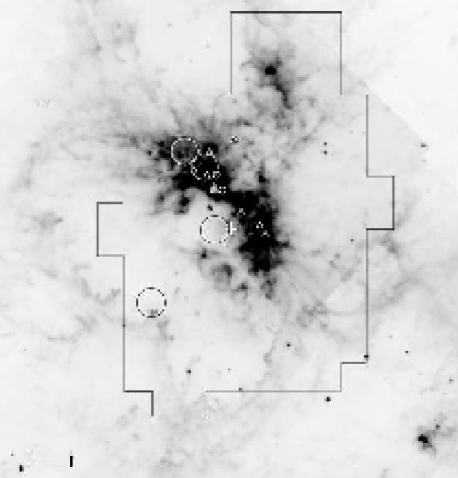
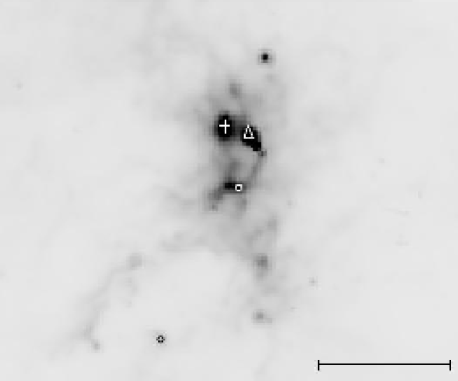
Fig. 14 shows the 8.0 m IRAC/Spitzer image of 30 Dor. At this wavelength, the extended emission is dominated by hot dust and PAH emission. This figure also shows the location of young, embedded IR sources ( and 1.5 mag) identified in the literature (Rubio et al., 1998; Brandner et al., 2001; Maercker & Burton, 2005) as well as the maser sources. The water masers in 30 Dor are located in similar structures as the IR sources, surrounding R 136, suggesting that current star formation (not just recent star formation) is also concentrated near the interfaces of the molecular cloud complex within the influence sphere of the previous generation of massive O and B-type stars. The large velocity difference between maser source components (Sect. 3.1.1) implies location in distinct structures in the ISM. As proposed by van Loon & Zijlstra (2001a), the highly supersonic velocities of some of the sources and their location near the rim of large gas superbubbles (e.g., Wang & Helfand, 1991) strongly suggest that the masers occur at the collision fronts of rapidly expanding bubbles of ionised gas with the surrounding dense neutral material. If the masers trace the velocities of protostars within these environments, then this constitutes evidence that star formation was triggered at different locations by the massive stars’ feedback.
Our maser observations survey the central part of the 30 Dor nebula, covering the immediate neighbourhood of R 136 and the densest regions of the nebula. Even though the survey area is much larger than previous observations, we only identified one new maser source. We can compare our survey results to the galactic water maser luminosity distribution from Valdettaro et al. (2001). Assuming a median distance to high-mass star forming regions in nearby spiral arms of a few kpc, we would expect the bulk of the water masers in 30 Dor to have integrated fluxes of order 0.11 Jy km s-1, with a steep decline at the higher end. This suggests that, although close, our survey is not yet deep enough to reveal the bulk of the water maser population in 30 Dor. Nonetheless, as all detected water masers are located at or near compressed interface regions, our survey provides evidence that most of the on-going massive star formation occurs in the presence of feedback.
The situation is less clear for the molecular material in N 157B, still in the 30 Dor region but located 7 (100 pc) from R 136. We identify N 157B IRS1 as a candidate protostar from the analysis of its SED and from the tentative detection of water ice. We have detected no maser emission towards N 157B IRS1. Despite the 0.9 mismatch in position, our experience with the 30 Dor mapping (see for instance analysis of 0539-691C) indicates that we would have detected emission from this source if stronger than 1 Jy. We cannot exclude the presence of weaker emission, however water masers are normally associated with the earlier (hot core) stage when such objects are very weak in the IR (de Buizer et al., 2005) — IRS1 is the brightest source in our sample at near and- mid-IR wavelengths. N 157B has been identified with SNR 0538-69.1, although its nature as a supernova remnant has been questioned (Chu et al., 2004). The age of the alleged supernova remnant is only yr (Wang & Gotthelf, 1998) and it is therefore impossible to already have led to the formation of stars in the nearby molecular cloud. It is possible that the formation of N 157B IRS1 was triggered by feedback from the nearby OB association LH 99, but we have no direct evidence for this.
4.2 Triggered star formation in N 113
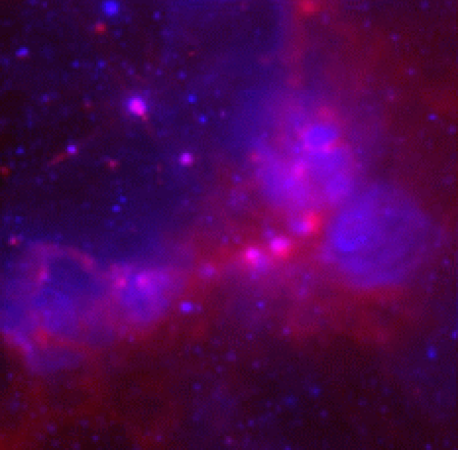
N 113 is a smaller and perhaps simpler H ii region than the 30 Dor mini-starburst complex. Fig. 13 (bottom right) shows in great detail the interplay between the ionised gas and the molecular material in N 113. This image combines the H image (blue) with the 8m IRAC/Spitzer image (red). We use here the pseudo-continuum image (Sect. 3.4): this image contains not only stars (generally blue) but also most of the H emission structure; when combined with the IR image the ionised and neutral gas, as well as the stellar content become apparent. This composite image presents a striking example of the ionised bubbles created within the part of a molecular cloud facing massive early-type stars (Sect. 3.4).
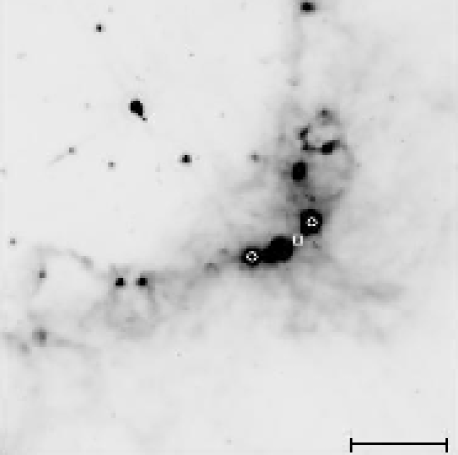
In Fig. 13, one can also see that the sequence of bright H knots A, B, E and G is co-spatial with the brightest 8m emission. Wong et al. (2006) have recently performed aperture synthesis imaging of this dense region in N 113. The 1.3-cm continuum observations reveal a string of 6 bright continuum sources, also located in the dense central region and a large molecular clump a few arcseconds away. Fig. 13 (bottom left) shows the 8m Spitzer image of N113, with several sources identified. The positions of two water maser sources (Lazendic et al., 2002) are represented by circles. The east-most water maser source is the strongest detected in the Magellanic Clouds and it seems to be also associated with an OH maser source (Brooks & Whiteoak, 1997) and a relatively weak continuum source (Wong et al., 2006). The other water maser source is associated with the brightest continuum source that Wong et al. (2006) identify as a compact H ii region. The approximate position of the dense molecular clump is also indicated in Fig. 13; Wong et al. (2006) propose that the compact H ii region might trigger further collapse in this dense clump.
The average molecular hydrogen density in the molecular cloud associated with N 113 is estimated at cm-3 (Wong et al., 2006) which, for a cloud radius of pc, corresponds to a column density of cm-2. This just exceeds the threshold for a diffuse cloud to cool and collapse to form stars, cm-2 (Bergin et al., 2004). However, Wong et al. (2006) argue that the cloud must be strongly clumped, which would imply that most (geometrically) of the cloud is much less dense — possibly . The dense molecular clump that was detected within this cloud has a radius of pc and a molecular hydrogen density of cm-3 (Wong et al., 2006); this yields a column density of cm-2, which comfortably exceeds the threshold for star formation. The strongest density enhancements are located near the interface with the hot gas; thus it is likely that the gas has been compressed as a result of feedback from the nearby OB stars.
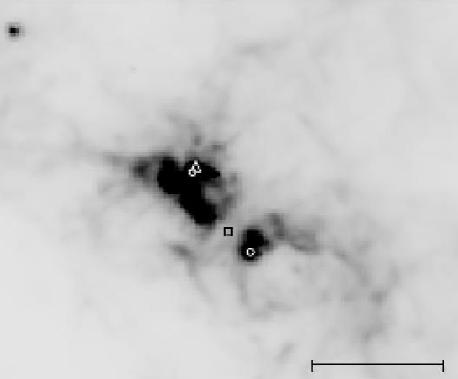
To summarise, the scenario that emerges in N 113 is that in the compressed dense lane of neutral gas and dust star formation is occurring, pinpointed by the maser sources in its earliest stages and by the 1.3-cm continuum emission as the massive stars evolve. N 113 therefore presents a clear example of star formation triggered by the winds from massive stars. A similar scenario seems also likely for N 160A (Fig. 15; see also Nakajima et al., 2005).
4.3 N 105A, a less evolved H ii region?
The situation seems different for N 105A. Fig. 15 (top) shows the 8 m IRAC/Spitzer image of N 105A, dominated by hot dust and PAH emission, with the positions of N 105A IRS1 (Epchtein et al. 1984; this work), water and OH maser (Lazendic et al., 2002; Brooks & Whiteoak, 1997) and methanol maser (Sinclair et al., 1992) indicated. Although projection effects may affect our view, the morphology of N 105A shows little evidence for massive star feedback; no shell structure is seen in [O iii] images (Ambrocio-Cruz et al., 1998), in spite of the proximity of the OB association LH 31, identified near the molecular cloud (Dopita et al., 1994). Furthermore, there seems to be no link between the water and OH maser source (Lazendic et al., 2002; Brooks & Whiteoak, 1997) and the protostar location and any external trigger. However, the methanol maser to the south (Sinclair et al., 1992) does appear to lie in a dense knot at the rim of a cavity in the molecular cloud. A massive young stellar object, N 105A IRS1, is already ionising the molecular cloud and also shows evidence of outflows. It seems likely that it is only a matter of time before N 105A IRS1 starts sculpting the N 105 complex, influencing current star formation occurring in the cloud core as signposted by the maser sources.
The molecular cloud associated with N 105A is a factor five denser than that in N 113 (Chin et al., 1997). N 105A is therefore more likely to collapse and fragment without the need for an external trigger. Thus N 105A seems to be at an earlier stage of its evolution, whereas N 113, N 160A and in particular 30 Dor have seen more generations of stars forming prior to the current epoch of star formation.
5 Summary and conclusions
We have conducted a survey for water maser emission in 30 Doradus and a sample of H ii regions in the Large Magellanic Cloud, to investigate the conditions under which current star formation occurs. The locations of the maser sources are compared with infrared images from the ESO/VLT (at 3.8 m) and the Spitzer Space Telescope, and an H image in the case of N 113. We also present 34 m spectroscopy to investigate the nature of two protostar candidates, in the N 157B and N 105A regions, showing evidence for the onset of the stellar feedback process in one of them.
Our water maser survey of 30 Dor uncovered one new source, 0539691C, with a velocity consistent with the systemic velocity of the LMC. All detected water masers are located in the densest part of the nebula at the interface between neutral and ionised gas. N 105A IRS1 shows strong H recombination line emission and its SED and IR colours are consistent with an embedded young massive star ionising its immediate surroundings. It also shows evidence for outflows. A nearby diffuse IR source, N 105A blob, shows both H recombination and PAH emission. We identify N 157B IRS1 as an embedded protostar based on the analysis of its SED and a tentative detection of the 3.1 m water ice feature.
In the well-developed H ii regions 30 Dor, N 113 and N 160A, no water masers have been detected deep within the molecular cloud complexes. They are always found at the interfaces between molecular cloud and H ii region. This provides strong evidence that feedback from massive stars triggers subsequent star formation. Although in the dense cloud N 105A star formation seems to occur without evidence of massive star feedback, the general conditions in the LMC seem favourable for sequential star formation as a result of feedback.
The wind speed and mass-loss rate of O and B stars decrease at lower metallicity (Mokiem & de Koter, in preparation), thus massive star feedback could be weak in metal-poor environments but we see no evidence for this in the LMC (metallicity 40 per cent solar). This is important as the duration and intensity of star formation epochs in galaxies may depend on the efficiency of the local massive star feedback to trigger further star formation.
Acknowledgements
We would like to thank the staff at Parkes, AAT and ESO Paranal for their support. We thank the anonymous referee for useful comments. This publication makes use of data products from the Two Micron All Sky Survey, which is a joint project of the University of Massachusetts and the Infrared Processing and Analysis Center/California Institute of Technology, funded by the National Aeronautics and Space Administration (NASA) and the National Science Foundation. We make use of archival images obtained with the Spitzer Space Telescope, which is operated by the Jet Propulsion Laboratory, California Institute of Technology under a contract with NASA. JMO acknowledges financial support by PPARC.
References
- Ambrocio-Cruz et al. (1998) Ambrocio-Cruz P., Laval A., Marcelin M., Amram P., Comerón F., 1998, A&A, 339, 173
- Allamandola et al. (1985) Allamandola L.J., Tielens A.G.G.M., Barker J.R., 1985, ApJ, 290, 25
- Beichman et al. (1988) Beichman C.A., Neugebauer G., Habing H.J., Clegg P.E., Chester T.J., 1988, Infrared Astronomical Satellite (IRAS) catalogs and atlases. Volume 1: Explanatory supplement
- Bergin et al. (2004) Bergin E.A., Hartmann L.W., Raymond J.C., Ballesteros-Paredes J., 2004, ApJ, 612, 921
- Bica et al. (1999) Bica E.L.D., Schmitt H.R., Dutra C.M., Oliveira H.L., 1999, AJ, 117, 238
- Bica et al. (1992) Bica E.L.D., Claria J.J., Dottori H., 1992, AJ, 103, 1859
- Bland & Tully (1989) Bland J., Tully R.B., 1989, AJ, 98, 723
- Bolatto et al. (2000) Bolatto A.D., Jackson J.M., Israel F.P., Zhang X., Kim S., 2000, ApJ, 545, 234
- Brandner et al. (2001) Brandner W., Grebel E.K., Barbá R.H., Walborn N.R., Moneti A., 2001, AJ, 122, 858
- Brogan et al. (2004) Brogan C.L., Goss W.M., Lazendic J.S., Green A.J., 2004, ApJ, 128, 700
- Brooks & Whiteoak (1997) Brooks K., Whiteoak J.B., 1997, MNRAS, 291, 395
- Brunet et al. (1975) Brunet J.P., Imbert N., Martin N., Mianes P., Prevot L., Rebeirot E., Rousseau J., 1975, A&AS, 21, 109
- Chin et al. (1997) Chin Y.-N., Henkel C., Whiteoak J.B., Millar T.J., Hunt M.R., Lemme C., 1997, A&A, 317, 548
- Chu et al. (2004) Chu Y.H., Gruendl R.A., Chen C.-H.R., Lazendic J.S., Dickel J.R., 2004, ApJ, 615, 727
- Churchwell et al. (2004) Churchwell E. et al., 2004, ApJS, 154, 322
- Codella & Felli (1995) Codella C., Felli M., 1995, A&A, 302, 521
- Cutri et al. (2003) Cutri R.M. et al., 2003, Explanatory Supplement to the 2MASS All Sky Data Release
- de Buizer et al. (2005) de Buizer J.M., Radomski J.T., Telesco C.M., Piña R.K., 2005, in “Massive star birth: A crossroads of Astrophysics”, IAU Symposium 227, eds Cesaroni R., Felli M., Churchwell E., Walmsley M., Cambridge University Press, p180
- Dopita et al. (1994) Dopita M.A., Bell J.F., Chu Y.-H., Lozinskaya T.A., 1994, ApJS, 93, 455
- Drew et al. (1993) Drew J.E., Bunn J.C., Hoare M.G., 1993, MNRAS, 265, 12
- Egan et al. (2001) Egan M.P., van Dyk S.D., Price S.D., 2001, AJ, 122, 1844
- Egan et al. (2003) Egan M.P. et al., 2003, VizieR On-line Data Catalog: V/114. Originally published in: Air Force Research Laboratory Technical Report AFRL-VS-TR-2003-1589
- Elitzur et al. (1989) Elitzur M., Hollenbach D.J., McKee C.F., 1989, ApJ, 346, 983
- Elitzur et al. (1992) Elitzur M., Hollenbach D.J., McKee C.F., 1992, ApJ, 394, 221
- Ellingsen et al. (1994) Ellingsen S.P., Whiteoak J.B., Norris R.P., Caswell J.L., Vaile R. A., 1994, MNRAS, 269, 1019
- Epchtein et al. (1984) Epchtein N., Braz M.A., Sèvre F., 1984, A&A, 140, 67
- Fazio et al. (2004) Fazio G. et al., 2004, ApJS, 154, 10
- González-Alfonso et al. (1998) González-Alfonso E., Cernicharo J., Alcolea J., Orlandi M.A., 1998, A&A, 334, 1016
- Gouliermis et al. (2006) Gouliermis D., Brandner W., Henning Th., 2006, ApJ, 636, 133
- Hanner (1988) Hanner M.S., 1988, NASA Conf. Pub., 3004, p22
- Hanson, Howarth & Conti (1997) Hanson M.M., Howarth I.D., Conti P.S., 1997, ApJ, 489, 698
- Henize (1956) Henize K.G, 1956, ApJS, 2, 315
- Henning et al. (1998) Henning Th., Klein R., Chan S.J., Fitzpatrick E.L., Siebenmorgen R., Stecklum B., 1998, A&A, 338, 51
- Heydari-Malayeri et al. (2002) Heydari-Malayeri M., Charmandaris V., Deharveng L., Meynadier F., Rosa M.R., Schaerer D., Zinnecker H., 2002, A&A, 381, 941
- Hummer & Storey (1987) Hummer D.G., Storey P.J., 1987, MNRAS, 224, 801
- Hunter et al. (1995) Hunter D.A., Shaya E.J., Scowen P., Hester J.J., Groth E.J., Lynds R., O’Neil E.J. Jr., 1995, ApJ, 444, 758
- Hyland et al. (1992) Hyland A.R., Straw S., Jones T.J., Gatley I., 1992, MNRAS, 257, 391
- Ivezić, Nenkova & Elitzur (1999) Ivezić Ž., Nenkova M., Elitzur M., 1999, User Manual for dusty. University of Kentucky Internal Report
- Johansson et al. (1998) Johansson L.E.B. et al., 1998, A&A, 331, 857
- Jones et al. (2005) Jones T.J., Woodward C.E., Boyer M.L., Gehrz R.D., Polomski E., 2005, ApJ, 620, 731
- Lazendic et al. (2002) Lazendic J.S., Whiteoak J.B., Flamer I., Harbinson P.D., Kuiper T.B.H, 2002, MNRAS, 331, 969
- Lépine et al. (1976) Lépine J.R.D., Paes de Barros M.H., Gammon R.H., 1976, A&A, 48, 269
- Maercker & Burton (2005) Maercker M., Burton M.G., 2005, A&A, 438, 663
- Mathis, Rumpl & Nordsieck (1977) Mathis J.S., Rumpl W., Nordsieck K.H., 1977, ApJ, 217, 425
- Mathis (1990) Mathis J.S., 1990, ARA&A, 28, 37
- Matsuura et al. (2005) Matsuura M. et al., 2005, A&A, 434, 691
- Merrill & Burwell (1933) Merrill P.W., Burwell C.G., 1933, ApJ, 78, 87
- Nakajima et al. (2005) Nakajima Y. et al., 2005, AJ, 129, 776
- Nota et al. (2006) Nota A. et al., 2006, ApJ, 636, 133
- Olofsson et al. (2002) Olofsson H., González-Delgado D., Kerschbaum F., Schöier F.L., 2002, A&A, 391, 1053
- Ossenkopf et al. (1992) Ossenkopf V., Henning Th., Mathis J.S., 1992, A&A, 261, 567
- Palagi et al. (1993) Palagi F., Cesaroni R., Comoretto G., Felli M., Natale V., 1993, A&AS, 101, 153
- Reach et al. (2005) Reach W.T. et al., 2005, PASP, 117, 978
- Rubio et al. (1998) Rubio M., Barbá R.H., Walborn N.R, Probst R.G., García J., Roth M.R., 1998, AJ, 116, 1708
- Rudnitskii et al. (1999) Rudnitskii G.M., Lekht E.E., Berulis I.I., 1999, Astronomy Letters, 25, 398
- Scalise & Braz (1982) Scalise E. Jr., Braz M.A., 1982, AJ, 87, 3
- Sinclair et al. (1992) Sinclair M.W., Carrad G.J., Caswell J.L., Norris R.P., Whiteoak J.B., 1992, MNRAS, 256, 33
- Tofani et al. (1995) Tofani G., Felli M., Taylor G.B., Hunter T.R., 1995, A&AS, 112, 299
- Valdettaro et al. (2001) Valdettaro R. et al., 2001, A&A, 368, 845
- van Dishoeck (2004) van Dishoeck E.F., 2004, ARA&A, 42, 119
- van Loon & Zijlstra (2001a) van Loon J.Th., Zijlstra A.A., 2001, ApJ, 547, L61
- van Loon et al. (2001b) van Loon J.Th., Zijlstra A.A., Bujarrabal V., Nyman L.-Å., 2001, A&A, 368, 950
- van Loon et al. (2005a) van Loon J.Th., Marshall J.R., Zijlstra A.A., 2005a, A&A, 442, 597
- van Loon et al. (2005b) van Loon J.Th. et al., 2005b, MNRAS, 364, L71
- van Loon et al. (2006) van Loon J.Th., Marshall J.R., Cohen M., Matsuura M., Wood P.R., Yamamura I., Zijlstra A.A., 2006, A&A, 447, 971
- Walborn & Blades (1987) Walborn N.R., Blades J.C., 1987, ApJ, 323, L65
- Walborn & Blades (1997) Walborn N.R., Blades J.C., 1997, ApJS, 112, 457
- Walborn et al. (1999) Walborn N.R., Barbá R.H., Brandner W., Rubio M., Grebel E.K., Probst R.G., 1999, AJ, 117, 225
- Walborn et al. (2002) Walborn N.R., Maíz-Apellániz J., Barbá R.H., 2002, AJ, 124, 1601
- Wang & Helfand (1991) Wang Q.D., Helfand D.J., 1991, ApJ, 370, 541
- Wang & Gotthelf (1998) Wang Q.D., Gotthelf E.V., 1998, ApJ, 509, 109
- Werner et al. (2004) Werner M. et al., 2004, ApJS, 154, 1
- Whiteoak et al. (1983) Whiteoak J.B., Wellington K.J., Jauncey D.L., Gardner F.F., ForsterJ.R., Caswell J.L., Batchelor R.A., 1983, MNRAS, 205, 275
- Whiteoak & Gardner (1986) Whiteoak J.B., Gardner F.F., 1986, MNRAS, 222, 513
- Wilcots (1994) Wilcots E.M., 1994, AJ, 108, 1674
- Wong et al. (2006) Wong T., Whiteoak J.B., Ott J., Chin Y-N., Cunningham M.R., 2006, ApJ in press, astro-ph/0604182
- Zickgraf et al. (1986) Zickgraf F.-J., Wolf B., Leitherer C., Appenzeller I., Stahl O., 1986, A&A, 163, 119
Appendix A Regions with non-detections at 22 GHz
We have observed several other H ii regions at 22 GHz, both in the Large and Small Magellanic Clouds. The positions listed in Table 6 had been previously observed by Whiteoak et al. (1983) and Scalise & Braz (1982). We did not detect maser emission at any of these positions, confirming previous non-detections (Whiteoak et al., 1983). Lazendic et al. (2002) detected maser emission in N 159, with a peak flux density of 3.7 Jy at 247.5 km s-1. No source was detected in our spectrum. In the SMC, Scalise & Braz (1982) detected water maser emission in S 7 and S 9 at the systemic velocity of the cloud (120 km s-1), with peak intensities of 7.4 and 4.2 Jy, respectively. We did not detect any water maser emission at either of these positions. Water maser emission is known to be intrinsically variable in galactic star forming regions, both in intensity and velocity (Palagi et al., 1993; Tofani et al., 1995) therefore it is not unexpected that our survey does not detect all previously identified maser sources.
| cloud complex | RA 2000 | DEC 2000 | rms/channel |
|---|---|---|---|
| () | () | (Jy) | |
| Large Magellanic Cloud | |||
| MC 69 | 05 36 20.7 | 69 12 15 | 0.10 |
| MC 89 | 05 47 09.6 | 69 42 15 | 0.10 |
| N 11B | 04 56 51.5 | 66 24 25 | 0.13 |
| N 132D | 05 25 01.6 | 69 38 16 | 0.13 |
| N 158C | 05 39 09.3 | 69 30 14 | 0.09 |
| N 159 | 05 39 57.2 | 69 44 33 | 0.10 |
| N 44D | 05 23 01.0 | 68 02 13 | 0.10 |
| N 59A | 05 35 24.5 | 67 34 52 | 0.13 |
| Small Magellanic Cloud | |||
| N 66 | 00 59 16.9 | 72 09 50 | 0.11 |
| S 7 | 00 46 38.9 | 72 40 50 | 0.10 |
| S 9 | 00 47 30.8 | 73 08 20 | 0.10 |
Appendix B R Doradus and W Hydrae
The nearby galactic red giants R Doradus and W Hydrae were observed at 22 GHz for reference. R Dor was observed several times each night. The resulting time series of the difference with respect to the average spectrum is displayed in Fig. 16. The average profile shows two distinct components, but only the high-frequency component shows variability. R Dor pulsates radially in a semi-regular fashion with a period of days, but the variability of the water maser emission occurs on a much shorter timescale — 9 days corresponds to less than 0.03 cycles.
The average spectrum is compared in Fig. 17 to that observed 1.33 cycles previously (April 2000, van Loon et al., 2001b). The 2001 spectrum looks more similar to the discovery spectrum (Lépine, Paes de Barros & Gammon, 1976), and is more symmetrical around the systemic velocity of the star as derived from the centroid of the CO emission profile, km s-1 (Olofsson et al., 2002). The double-peaked water maser profile suggests substantial radial amplification; this yields an estimate for the outflow velocity in the inner part of the dust envelope of km s-1 (peaks) to 4 km s-1 (total extent), which is less than the outflow velocity in the outer part of the dust envelope as measured in CO, km s-1. This implies that the wind is still accelerating in the region of the water maser.

The water maser emission profile of W Hya (Fig. 18) has a single peak near the systemic velocity of the star, km s-1 (González-Alfonso et al., 1998), suggesting mainly tangential amplification. However, the emission profile has a broader pedestal component suggesting radial motions of the order of km s-1. The water maser is highly variable, but the maximum extent of the emission is well constrained and suggests km s-1 (Rudnitskii, Lekht & Berulis, 1999). As in the case of R Dor, this is slower than the outflow velocity in the outer part of the wind as measured in CO, km s-1 (Olofsson et al., 2002), and consistent with a wind that is accelerated through radiation pressure on dust grains.
