A population of high-redshift type-2 quasars-II. Radio Properties
Abstract
We present multi-frequency radio observations of a sample of obscured (type-2) quasars in the Spitzer extragalactic First Look Survey area. We combine the public data at 1.4 GHz, used in the selection of these sources, with new observations at 610 MHz (GMRT) and at 4.9 GHz (VLA). We find the sample includes sources with steep, flat and gigahertz-peaked spectra. There are no strong correlations between the presence or absence of emission lines in the optical spectra and the radio spectral properties of the sample. However, there are no secure flat-spectrum type-2 quasars with narrow emission lines which would be problematic for unified schemes. Most of the population have straight radio spectra with spectral index as is expected for developed, potentially FRI-like, jets in which continous injection of relativistic electrons is accompanied by inverse-Compton losses against the cosmic microwave background.
keywords:
galaxies:active-galaxies:nuclei-quasars:general-radio continuum:galaxies1 Introduction
The ‘zoo’ of active galactic nuclei (AGN) includes many different objects with signs of non-stellar activity, powered by a supermassive black hole at the centre of a host galaxy (Rees, 1984). The different observed properties are usually explained via variations in the rate of accretion of this central black hole, the black hole mass, and the orientation of the axes of symmetry with respect to the observer (e.g. Antonucci, 1993). Obscured (type-2) quasars are intrinsically the same as unobscured (type-1) quasars, except for the orientation, where the dusty torus around the central black hole blocks the line of sight to the bright accretion disk and the broad-line region. Only the narrow-line region is then visible to the observer. Radio-loud type-2 quasars, in the form of narrow emission line radio galaxies, have been known for a long time. For the more radio-luminous galaxies (the FRII class of Fanaroff & Riley, 1974), convincing evidence exists for their obscured quasar nuclei (e.g. Haas et al., 2005; Ogle et al., 2006). However, not all FRII radio-galaxies are powerful accreters (Ogle et al., 2006), and amongst the less radio-luminous FRI class few quasars were found (see Blundell & Rawlings, 2001, for an exception), although recent radio imaging of quasars has challenged this (Heywood, Blundell & Rawlings, MNRAS, submitted). Amongst the radio-quiet population, the type-2 quasars had remained elusive until recently.
The search for high-redshift type-2 quasars has been carried out mainly in the X-rays (see Brandt & Hasinger, 2005, for a review) and, more recently, in the mid-infrared (e.g. Lacy et al., 2004; Martínez-Sansigre et al., 2005). The sample of Martínez-Sansigre et al. (2005, 2006) consists of radio-intermediate type-2 quasars: quasars with radio luminosities below the FRI/FRII break, but above that would be expected from star-formation alone. These were selected in the Spitzer extragalactic First Look Survey (FLS) by demanding objects to have a 24-m flux density Jy, a 3.6-m flux density Jy, and a 1.4 GHz flux density in the range Jy 2 mJy. Martínez-Sansigre et al. (2006) found secure optical redshifts (from narrow lines) for % of their sample with the remaining spectra typically completely blank: they discuss the possibility of their blank optical spectra being due to a dusty host galaxy obscuring all the central activity, even the narrow emission lines. Similar type-2s with blank optical spectra are found in the samples of Lacy et al. (2004) and Leipski et al. (2005).
| Name | RA | Dec | Spec | ||||||
|---|---|---|---|---|---|---|---|---|---|
| (J2000) | / Jy | / Jy | / Jy | ||||||
| AMS01 | 17 13 11.17 | +59 55 51.5 | 164 52 | 490 31 | 1167 165 | 0.87 | 1.04 | - | 1 |
| AMS02 | 17 13 15.88 | +60 02 34.2 | 408 52 | 1184 55 | 2985 152 | 0.85 | 1.11 | - | 1 |
| AMS03 | 17 13 40.19 | +59 27 45.8 | 365 53 | 1986 87 | 5180 191 | 1.35 | 1.15 | 2.698 | 2 |
| AMS04A† | 17 13 40.62 | +59 49 17.1 | 135 53 | 536 72 | 1092 77 | 1.10 | 0.86 | 1.782 | 2 |
| AMS04B‡ | 17 13 40.62 | +59 49 17.1 | 232 106 | 867 101 | 1519 122 | 1.05 | 0.68 | 1.782 | 2 |
| AMS05 | 17 13 42.77 | +59 39 20.2 | 443 51 | 1038 49 | 1214 164 | 0.68 | 0.19 | 2.017 | 2 |
| AMS06 | 17 13 43.91 | +59 57 14.6 | 19153 | 444 31 | 1115 153 | 0.67 | 1.11 | 1.76 | 1,3 |
| AMS07 | 17 14 02.25 | +59 48 28.8 | 239 51 | 354 27 | 578 151 | 0.31 | 0.59 | - | 1 |
| AMS08 | 17 14 29.67 | +59 32 33.5 | 718 | 655 36 | 889 151 | -0.07 | 0.37 | 1.979 | 2 |
| AMS09 | 17 14 34.87 | +58 56 46.4 | 174 51 | 426 29 | 1118 190 | 0.71 | 1.16 | - | 1 |
| AMS10 | 17 16 20.08 | +59 40 26.5 | 501 36 | 1645 73 | 4590 93 | 1.04 | 1.24 | - | 1 |
| AMS11 | 17 18 21.33 | +59 40 27.1 | 104 | 356 29 | 628 89 | 0.98 | 0.68 | - | 1 |
| AMS12 | 17 18 22.65 | +59 01 54.3 | 305 83 | 946 45 | 2440 194 | 0.90 | 1.14 | 2.767 | 2 |
| AMS13 | 17 18 44.40 | +59 20 00.8 | 495 80 | 1888 83 | 4559 135 | 1.07 | 1.06 | 1.974 | 2,3 |
| AMS14 | 17 18 45.47 | +58 51 22.5 | 158 52 | 469 29 | 1099 196 | 0.87 | 1.03 | 1.794 | 2 |
| AMS15 | 17 18 56.93 | +59 03 25.0 | 326 53 | 440 29 | 570 174 | 0.24 | 0.31 | 4 | |
| AMS16 | 17 19 42.07 | +58 47 08.9 | 108 | 390 60 | 170 | 1.02 | -1.00 | 4.169 | 2 |
| AMS17 | 17 20 45.17 | +58 52 21.3 | 265 53 | 615 34 | 1354 226 | 0.67 | 0.95 | 3.137 | 2 |
| AMS18 | 17 20 46.32 | +60 02 29.6 | 212 53 | 390 29 | 502 113 | 0.49 | 0.30 | 1.017 | 2 |
| AMS19 | 17 20 48.00 | +59 43 20.7 | 506 52 | 822 41 | 958 152 | 0.50 | 0.18 | 2.25 | 1,3 |
| AMS20 | 17 20 59.10 | +59 17 50.5 | 1391 53 | 1268 58 | 674 187 | -0.07 | -0.76 | - | 1 |
| AMS21 | 17 21 20.09 | +59 03 48.6 | 145 53 | 449 29 | 1019 169 | 0.91 | 0.99 | - | 1 |
Radio observations can be used to test whether the type-2 quasars are obscured by the torus. The first expectation is that radio jets, if present, are at large angles to the line-of-sight and steep radio spectral indices are expected. If the jets in some of the type-2 quasars were recently triggered, then GHz-peaked radio spectra, characteristic of young jets (O’Dea, 1998) might be observed. Classic type-2 quasars (presumably those showing narrow-lines) are not expected to have the jet close to the observer’s line of sight and exhibit the flat radio spectra seen in some type-1 quasars. Therefore, the suggestion by Miller, Rawlings & Saunders (1993) and Falcke, Malkan & Biermann (1995) that the radio-intermediate quasar population is comprised of Doppler-boosted flat-spectrum radio-quiet quasars would pose serious difficulties for the narrow-line type-2 quasars in this sample. However, if some quasars are obscured by dust independent of the obscuration, as suggested by Martínez-Sansigre et al. (2006), then the jets could be close to the line of sight, and flat radio spectra might be observed. This predicts that a small fraction of the sources with no narrow lines should have flat radio spectra, although this fraction will be boosted by a radio selection criterion.
In this letter we report the results of observing the entire Martínez-Sansigre et al. sample in the FLS at 610 MHz and 4.9 GHz, combined with public data at 1.4 GHz, and the conclusions on orientation or age that can be inferred. Throughout this paper we adopt a CDM cosmology with the following parameters: ; ; .
2 Observations and data reduction
2.1 1.4 GHz dataset
The 1.4 GHz data, taken from Condon et al. (2003), were part of the dataset used to select the sample in the first place (Martínez-Sansigre et al., 2005). The 1.4 GHz survey of the FLS was carried out using the Very Large Array (VLA) in B-configuration, with a synthesised beam size of 53 arcsec2 and a root mean square (rms) noise of 23 Jy. The type-2 quasars were selected in the flux density range Jy 2 mJy. At 1.4 GHz, all the sources are point-like, except for AMS16, which has a slightly extended radio structure and AMS04 which has an adjacent radio source North-East (NE) which could plausibly be a jet. Several of the sources were also observed in the WSRT survey of Morganti et al. (2004) and comparison of the flux densities suggested no hints of extended radio structure (other than AMS04, see Martínez-Sansigre et al., 2006).
2.2 4.9 GHz dataset
The 4.9 GHz data were also obtained using the VLA, but this time through pointed observations of every object in the sample, except AMS08 which was observed in the field of view of AMS03. Making use of dynamical scheduling time, the data presented here were effectively taken in C configuration. The observations were scheduled to optimise the coverage of the uv plane, the phase calibrators were visited every 9-12 minutes and 3C48 or 3C286 were used as amplitude calibrators. Overall, all sources were observed for almost exactly the same length of time, about 17 minutes each (except AMS10 which was observed for twice as long). With the VLA typically having 25 working antennae each run, the expected thermal noise was 45 Jy (Jy for AMS10).
The reduction of the 4.9 GHz data was peformed using the AIPS package. The sources themselves are too faint for self-calibration but some of the pointings include sources bright enough (10 mJy) to allow tests for phase stability: the phases varied by 10∘ in the 9-12 minute intervals between visits to the phase calibrator so, even where possible, self-calibration would have little effect on the final image. The beam size was 43 arcsec2, well matched to the 1.4 GHz beam, and the rms noise in the central region of all the images was found to be 50-54 Jy (37 Jy for AMS10), close to the expected thermal noise. A primary beam correction was applied in the case of AMS08, since this source is at the edge of the image of AMS03. At 4.9 GHz, all detected sources are unresolved and point-like, except AMS04 which is slightly extended ( arcec2) in the NE to SW direction.
2.3 610 MHz dataset
The FLS region was observed in 2004 March with 7 pointings of the Giant Meterwave Radio Telescope (GMRT). The total exposure time per object amounted to hours. The flux density scale of the observations were tied to observations of 3C48 and 3C286 (with assumed flux densities at 610 MHz of 29.4 and 21.1 Jy respectively) and the nearby source 1634627 was used to monitor any phase and amplitude variations of the telescope. The data were calibrated and the images synthesised using standard techniques with the AIPS software. In this case self-calibration was possible on bright sources in the field of view. The rms noise on these images varied between 28 and 32 Jy beam-1 before primary beam correction, although dynamic range limitations means that the noise close to bright sources is larger. Comparison of the flux densities of sources in the overlap regions between pointings, after correction for the nominal primary beam of the GMRT, revealed systematic inconsistencies between adjacent pointings. The differences could be explained by a consistent offset for the primary beam of the GMRT compared with the phase centre of each observation, of about 3 arcmin. Consequently, an offset primary beam correction was made to each of the pointings, before determining flux densities for the sources.
At 610 MHz all sources are point-like, except AMS04. In this case the adjacent radio source is detected, and the gaussian fit to the combined object results in a 10.3 5.1 arcsec2 ellipse, at a position angle of 40 degrees (North through East).
3 The spectral indices of the sample
The spectra of our sample are described here using two power laws, with flux density . The spectral index between 1.4 and 4.9 GHz () and between 610 MHz and 1.4 GHz () are given in Table 1. The flux densities used are all integrated quantities from gaussian-fitting procedures. Since the beam sizes at the three frequencies are well matched, and the sources are generally point-like, the spectral indices measured here are not strongly affected by problems such as confusion, or resolving out some of the flux density.
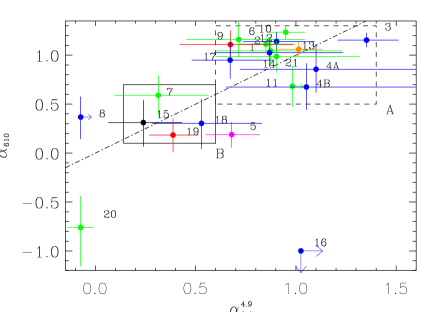
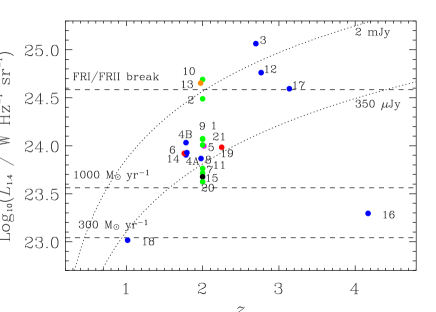
Table 1 summarises the data and Fig. 1 shows plotted against . The colours indicate the optical and mid-infrared spectroscopic properties of the sources. Fig. 2 shows the luminosity at 1.4 GHz as a function of redshift for the sample. Objects with no spectroscopic redshift are placed at . The 1.4 GHz luminosities of the sources were calculated using the spectral index to convert from observed-frame to rest-frame 1.4 GHz. The dashed lines show the luminosity of the FRI/FRII break ( W Hz-1 sr-1, Fanaroff & Riley, 1974), converted from 178 MHz to 1.4 GHz assuming . Also plotted are the luminosities expected for pure starbursts (Condon, 1992, also as dashed lines), and the two 1.4 GHz flux density cuts used in our selection (dotted lines). For all these, we also assume . The difference in spectral indices between the measured ones and the value assumed for the flux density cuts explains why some sources fall outside the expected selection locus.
3.1 Steep-spectrum sources
Looking at Fig. 1, the majority of the sources have steep () indices in both intervals and the two indices have similar values. Considering objects in Box A, and . This group includes objects with optical narrow lines and blank optical spectra. To test for any trends, we assume the hypothesis that all 13 sources in box A are realisations of the same underlying binomial distribution and have an 50% chance of having narrow-emission lines; 6 out of 13 objects in Box A have emission lines which is obviously consistent with our hypothesis. Dividing the sources in two by splitting the Box by the median , or by a diagonal median, we can test for trends, this time assuming the 6 sources in each half are drawn from this underlying distribution. In this case, deviations from 90% confidence would require one or zero sources of a given type, but each division always yields at least 2 sources of one or the other type. We can conclude that there is no trend or correlation between spectral index and optical properties in the sources in Box A.
In Fig. 2, we see several of these steep-spectrum sources (AMS03, AMS12, AMS13, AM17 and AMS10 if it is at ) have radio luminosities around the FRI/FRII break. Since our objects are selected to be type-2 quasars, we have possibly found some highly accreting FRI radio sources, which although a small fraction of the low- FRI population, are not unknown (see Blundell & Rawlings, 2001, and Heywood, Blundell & Rawlings, MNRAS, submitted). In the case of AMS04, we tabulate and plot two sets of values, derived with (A) and without (B) the adjacent radio source at 17 13 41.20 +59 49 24.0 which could plausibly be a 10 arcsec jet associated with the type-2 quasar. Including the jet lowers both indices, particularly , but the source is still clearly steep in both ranges.
Since the 1.4 GHz luminosities are similar to those of FRIs, we compare the spectral indices of our sample, to those compiled for the (178-MHz selected) 3C sample by Laing & Peacock (1980). At , observed 610 MHz and 1.4 GHz correspond to rest-frame 1.8 and 4.2 GHz respectively. So the spectral indices between 750 MHz and 5 GHz presented by Laing & Peacock (1980), for sources at include the range corresponding to our . They find typical spectral indices between 0.6 and 1.0 for FRI sources with values of between and W Hz-1 sr-1. The values of presented here are clustered towards the high end of the Laing & Peacock range. This is the reverse of what one expects from the most obvious selection effect, since the 3C sources are selected at lower frequency, one expects them to have steeper indices than a 1.4 GHz-selected sample. This could be explained by a combination of effects: e.g. the single-power-law spectra of Laing & Peacock goes down to 750 MHz and spectral indices typically steepen at higher frequencies; the radio-source environments at low redshift are systematically different from those at high redshift; and the cosmic microwave background (CMB) energy density is significantly higher at .
Steep straight spectra with are characteristic of the continuous injection of relativistic electrons accompanied by synchrotron & inverse-Compton losses (Kardashev, 1962). We can speculate that the electrons are accelerated in the knots of FRI-like sources and have because each has a (rest-frame) spectral ‘break frequency’, (where radiative losses steepen the negative slope of the number density of particles versus energy, and hence steepen the emitted spectrum) which has been driven below GHz by the high value of the CMB energy density. The relevant equation (Eqn. 3.10 of Leahy, 1991) is
| (1) |
where nT, and and are the characteristic magnetic field and age of the source respectively. At nT. From minimum energy arguments, assuming W Hz-1 sr-1 and a characteristic size of 30 kpc, then nT depending on the shape of the emitting region. Therefore a 10 Myr-old source at will have MHz due to the high value of the CMB energy density.
3.2 Flat-spectrum sources
Another visible group in Fig. 1 is Box B which has in both radio spectral intervals. This includes the sources AMS15, AMS18 and AMS19, more arguably AMS07, and maybe AMS08. Flat () spectral indices in both frequency ranges suggest that the jets are close to the observer’s line of sight with Doppler boosting of compact jet knots leading to a flat spectrum. In a unified scheme, such objects are not expected to be obscured by the torus, so any dust is expected to be on a larger scale, presumably in the host galaxy. This picture is consistent for AMS07 and AMS19 which have no narrow emission lines in their optical spectra, and could presumably be being obscured by dust in the host galaxy; AMS15 has not been observed spectroscopically. In Fig. 2, AMS07, AMS15 and AMS19 are seen to have 1.4 GHz luminosities consistent with radio-intermediate type-2 quasars: too high for star-formation only (unless they are hyper-luminous infrared galaxies) but below the FRI/FRII break.
AMS18 has a 1.4 GHz luminosity consistent with a pure starburst with a massive-star-formation rate of only M⊙ yr-1. Such an object could plausibly make it through our selection criteria and indeed AMS18 has an atypical optical spectrum showing only an [O II] 3727 Å line and other low-ionization lines like C II] (2326 Å) and Mg II (2798 Å). No high-ionization lines are securely detected (see Figure 6 of Martínez-Sansigre et al., 2006) so AMS18 could well be a pure starburst. If the radio emission is indeed due to the starburst, then the flat spectral indices can be explained by a bremsstrahlung contribution.
AMS08 has a flat spectrum between 1.4 GHz and 610 MHz () but the limit obtained for is of little use in constraining . Since it has narrow lines in the optical, a flat value for would suggest a beamed jet and would not sit easily with the obscuration by the torus. However, a steep value () could be explained as a GHz-peaked source, in the same was as for AMS05 (see Section 3.3).
3.3 GHz-peaked sources
Finally, there are three more sources with different spectral properties from those in Boxes A and B: AMS05; AMS16; and AMS20. These spectral properties can be explained as being due to young, compact jets, with synchrotron self-absorption leading to GHz-peaked spectra (GPS; see O’Dea, 1998, for a review). The GPS sources reviewed by O’Dea have radio luminosities above the FRI/FRII break W Hz-1 sr-1, so once again, the sources found here are radio-intermediate quasars as expected from the flux density cuts (see Figure 2). AMS20 has and suggesting the spectrum peaks somewhere above observed 4.9 GHz. We do not have a spectroscopic redshift for this object since the optical spectrum shows faint red continuum only but it is very unlikely to be at , so the peak is likely to be at a rest-frame frequency of 9.8 GHz or higher. AMS16 (at ) has a very negative and a very positive : it is consistent with peaking around observed 1.4 GHz (rest-frame 7 GHz) and due to the bandwidth narrowing with redshift, the frequencies observed range from rest-frame 25 GHz (observed 4.9 GHz) to rest-frame 3 GHz (observed 610 MHz). In Fig. 2 we can see that both AMS16 and AMS20 are intrinsically quite radio-faint at rest-frame 1.4 GHz, placing an interesting limit on any associated massive-star-formation rate ( 500-1000 M⊙ yr-1).
AMS05 has and and lies in the ‘radio-intermediate’ region of Fig. 2. The spectral indices can be explained by a GPS source peaking between 610 MHz and 1.4 GHz (observed frequencies).
4 Conclusions
We have used radio-data at three different frequencies, with well-matched beam sizes, to study the radio spectral properties of a population of high-redshift type-2 quasars. The sample contains a range of different radio spectral properties, which include mainly steep-spectrum sources ( and ), plus a minority of flat steep sources, with ( or ), and three, or perhaps four, GHz-peaked sources. The presence of flat-spectrum sources would be hard to reconcile with obscuration by a torus but we find no secure examples of such a case as there are no narrow-line type-2s with flat radio spectra. Otherwise, we find no correlation between radio spectral properties and optical spectral properties, suggesting no obvious dichotomy between “host-obscured” and “torus-obscured” type-2s, at least in terms of their radio spectral properties.
When determining the radio luminosities of our sources, we find the majority fall below the FRI/FRII break but above the luminosity corresponding to a massive-star-formation rate of 1000 M⊙ yr-1. Although we do not generally have the surface brightness sensitivity to detect extended jets, many of these objects could have FRI-like structures. Only one source has a radio luminosity consistent with being entirely due to a 300 M⊙ yr-1 starburst, consistent with its low-ionization-only emission lines. Only 4 out of 21 sources (at most 5 with AMS08) are flat-spectrum sources, so the idea that the radio-intermediate quasar population might be dominated by Doppler boosted radio-quiet quasars (e.g Miller et al., 1993) is not correct for this high- population.
Interestingly, we find that the steep spectrum () sources have radio spectra consistent with those of low-redshift FRI sources once the effects of an increased CMB energy density is taken into account. The spectral indices can be explained by active developed jets with continuous injection of relativistic electrons and inverse-Compton scattering by CMB photons, leading to the ‘break frequency’ being lowered to GHz and hence at observed frequencies above GHz.
Acknowledgments
We thank Ian Heywood and Rob Ivison for communicating results prior to publication, Matt Jarvis for helping obtain the VLA observations and the staff of the GMRT. SR and TSG thank the UK PPARC for a Senior Research Fellowship and a Studentship respectively. The VLA is a facility of the NRAO operated by Associated Universites, Inc., under co-operative agreement with the National Science Foundation. The GMRT is operated by the National Centre for Radio Astrophysics of the Tata Institute of Fundamental Research
References
- Antonucci (1993) Antonucci R., 1993, ARA&A, 31, 473
- Blundell & Rawlings (2001) Blundell K. M., Rawlings S., 2001, ApJL, 562, L5
- Brandt & Hasinger (2005) Brandt W. N., Hasinger G., 2005, ARA&A, 43, 827
- Condon (1992) Condon J. J., 1992, ARA&A, 30, 575
- Condon et al. (2003) Condon J. J., Cotton W. D., Yin Q. F., Shupe D. L., Storrie-Lombardi L. J., Helou G., Soifer B. T., Werner M. W., 2003, AJ, 125, 2411
- Fanaroff & Riley (1974) Fanaroff B. L., Riley J. M., 1974, MNRAS, 167, 31P
- Haas et al. (2005) Haas M., Siebenmorgen R., Schulz B., Krügel E., Chini R., 2005, A&A, 442, L39
- Kardashev (1962) Kardashev N. S., 1962, Soviet Astronomy, 6, 317
- Lacy et al. (2004) Lacy M., et al., 2004, ApJS, 154, 166
- Laing & Peacock (1980) Laing R. A., Peacock J. A., 1980, MNRAS, 190, 903
- Leahy (1991) Leahy J. P., 1991, Beams and Jets in Astrophysics, 100
- Leipski et al. (2005) Leipski C., et al., 2005, A&A, 440, L5
- Martínez-Sansigre et al. (2006) Martínez-Sansigre A., Rawlings S., Lacy M., Fadda D., Jarvis M. J., Marleau F. R., Simpson C., Willott C. J., 2006, MNRAS, 370, 1479
- Martínez-Sansigre et al. (2005) Martínez-Sansigre A., Rawlings S., Lacy M., Fadda D., Marleau F. R., Simpson C., Willott C. J., Jarvis M. J., 2005, Nat, 436, 666
- Miller et al. (1993) Miller P., Rawlings S., Saunders R., 1993, MNRAS, 263, 425
- Morganti et al. (2004) Morganti R., Garrett M. A., Chapman S., Baan W., Helou G., Soifer T., 2004, A&A, 424, 371
- O’Dea (1998) O’Dea C. P., 1998, PASP, 110, 493
- Ogle et al. (2006) Ogle P. M., Whysong D., Antonucci R., 2006
- Rees (1984) Rees M. J., 1984, ARA&A, 22, 471
- Weedman et al. (2006) Weedman D. W., Le Floc’h E., Higdon S. J. U., Higdon J. L., Houck J. R., 2006, ApJ, 638, 613
- Yan et al. (2005) Yan L., et al., 2005, ApJ, 628, 604