11email: Nicolas.Grosso@obs.ujf-grenoble.fr 22institutetext: Columbia Astrophysics Laboratory, Columbia University, 550 West 120th Street, New York, NY 10027, USA 33institutetext: Paul Scherrer Institut, 5232 Villigen und Würenlingen, Switzerland
A U-band survey of brown dwarfs in the Taurus Molecular Cloud with the XMM-Newton Optical/UV Monitor
Abstract
Aims. We aim to characterize the -band variability of young brown dwarfs in the Taurus Molecular Cloud and discuss its origin.
Methods. We used the XMM-Newton Extended Survey of the Taurus Molecular Cloud, where a sample of 11 young bona fide brown dwarfs (spectral type later than M6) were observed simultaneously in X-rays with XMM-Newton and in the -band with the XMM-Newton Optical/UV Monitor (OM).
Results. We obtained upper limits to the -band emission of 10 brown dwarfs (19.6–20.6 mag), whereas 2MASS J04141188+2811535 was detected in the -band. Remarkably, the magnitude of this brown dwarf increased regularly from 19.5 mag at the beginning of the observation, peaked 6 h later at 18.4 mag, and then decreased to 18.65 mag in the next 2 h. The first OM -band measurement is consistent with the quiescent level observed about one year later thanks to ground follow-up observations. This brown dwarf was not detected in X-rays by XMM-Newton during the OM observation.
Conclusions. We discuss the possible sources of -band variability for this young brown dwarf, namely a magnetic flare, non-steady accretion onto the substellar surface, and rotational modulation of a hot spot. We conclude that this event is related to accretion from a circumsubstellar disk, where the mass accretion rate was about a factor of 3 higher than during the quiescent level.
Key Words.:
Stars: low-mass, brown dwarfs – Stars: individual: 2MASS J04141188+2811535 – X-rays: stars – ISM: individual objects: the Taurus Molecular Cloud1 Introduction
Young brown dwarfs (BDs) share similar properties with pre-main-sequence low-mass stars, suggesting that they are also undergoing a T Tauri phase. BDs have accretion disks (e.g., Jayawardhana et al. 2003; Natta et al. 2004; Mohanty et al. 2005), and photometric (Scholz & Eislöffel 2004a, b), as well as spectroscopic variability (Scholz et al. 2005; Scholz & Jayawardhana 2006), pointing to variable mass accretion. Besides, BDs also have an active corona, emitting soft X-rays (e.g., Neuhäuser et al. 1999; Preibisch et al. 2005).
The gas accreting from the circumstellar disk onto the stellar surface of T Tauri stars produces a UV/blue excess emission (see review by Bouvier et al. 2006). The -band luminosity of T Tauri stars is directly related to the accretion luminosity (Gullbring et al. 1998). However, due to their faintness in the optical, BDs are poorly studied at short wavelengths (Gizis et al. 2005). During the XMM-Newton Extended Survey of the Taurus Molecular Cloud (XEST; Güdel et al. 2006), the X-ray emission of a sample of 16 bona fide BDs (spectral type later than M6) was surveyed with XMM-Newton (Grosso et al. 2006b). Eleven of these BDs were located less than – 12 away from the prime target of 9 XMM-Newton pointings, which allowed for simultaneous observations with the XMM-Newton Optical/UV Monitor (OM; Mason et al. 2001), that we report here.
We present the constraints on the -band photometry of these BDs obtained with the OM in Sect. 2. In Sect. 3, we investigate the variability of 2MASS J04141188+2811535 (shortened to 2MASS J0414 henceforth) in the -band and in X-rays. We discuss the origin of the -band event observed from this BD in Sect. 4.
| Name | 2MASS | SpTyp | Ref. | XEST | Window exposure | |||
|---|---|---|---|---|---|---|---|---|
| M⊙ yr-1 | ks | mag | ||||||
| (1) | (2) | (3) | (4) | (5) | (6) | (7) | (8) | (9) |
| 2MASS J0414 | J04141188+2811535 | M6.25 | M05 | -10 | 20 | 2.5 | 10 | 19.5 |
| 2MASS J0421 | J04215450+2652315 | M8.5 | L06 | 11 | 5.0 | 5.0 | 20.4 | |
| 2MASS J0422 | J04221332+1934392 | M8 | L06 | 01-062 | 3.5 | 4.0 | 19.9 | |
| KPNO-Tau 4 | J04272799+2612052 | M9.5 | G06 | -11.1 | 02 | 5.0 | 4.6 | 20.4 |
| KPNO-Tau 5 | J04294568+2630468 | M7.5 | B02 | n.a. | 15-044 | 1.3 | 3.9 | 19.8 |
| KPNO-Tau 6 | J04300724+2608207 | M9 | G06 | -10.8 | 14 | 5.0 | 2.8 | 20.6 |
| KPNO-Tau 7 | J04305718+2556394 | M8.25 | B02 | -11 | 14 | 5.0 | 2.8 | 20.6 |
| CFHT-Tau 5 | J04325026+2422115 | M7.5 | G06 | n.a. | 04-003 | 1.5 | 4 | 19.8 |
| KPNO-Tau 9 | J04355143+2249119 | M8.5 | B02 | n.a. | 08 | 1.6 | 4 | 19.6 |
| CFHT-BD-Tau 2 | J04361038+2259560 | M7.5 | B02 | n.a. | 08 | 1.3 | 8 | 19.7 |
| CFHT-Tau 6 | J04390396+2544264 | M7.25 | G06 | 05-005 | 5.0 | 3.7 | 20.5 |
2 The OM observations of BDs in the Taurus Molecular Cloud
Table 1 gives the list of the 11 BDs of the Taurus Molecular Cloud (TMC) surveyed with the OM in 9 XMM-Newton pointings. About half of these XMM-Newton pointings – namely XEST-02, 05, 11, 14 – were made with the OM in full-frame imaging mode, which provides an image of the whole OM field of view (17′17′) with binned (low) spatial resolution (). The other XMM-Newton pointings – namely XEST-01, 04, 08, 15, 20 – were made with the OM in the default imaging mode, which consists of a sequence of 5 exposures with 5 imaging windows – allowing us to cover 92% of the total (17′17′) OM field-of-view – plus a small central imaging window (1.7′1.7′). In each of the 5 exposures, one of the 5 large imaging windows covers a large fraction of the field-of-view with spatial resolution, while the small imaging window ensures continuous monitoring of the prime target at the center of the field-of-view with spatial resolution. We indicate in Col. (7) of Table 1 the duration of one single full-frame/imaging window exposure and in Col. (8) the total number of similar exposures obtained on the BD.
In a nutshell the OM detector is a micro-channel plate (MCP) intensified CCD detector operated as a photon-counting instrument. First, an optical/UV photon collected by the 30 cm-diameter telescope mirrors hits a photo-cathode located at the backside of the detector entrance window. The photoelectron is then amplified by two MCPs. The resulting electron avalanche is converted to a photon splash by a fluorescent phosphorus layer at the top of a fiber taper, which illuminates the CCD pixels. Finally, the onboard software determines the accurate detector position of the photon splash’s centers in each readout frame using a centroiding algorithm, which subsamples each CCD pixels by in-memory pixels (about on the sky).
We use the PERL script omichain of the XMM-Newton Science Analysis System (SAS; version 6.5) with default parameters to run the OM imaging mode pipeline. We corrected OM sky source positions in the observation source list (*OM*SWSRLI* fits files) of residual (a few arc seconds) boresight errors by using the 2MASS positions of OM sources as references. Only one BD was detected with the OM in the -band (305–390 nm, nm). We made a visual inspection of the stacked sky image covering the full OM field produced by the pipeline to look for possible faint BD missed by the OM source detection algorithm in individual imaging window exposure, but we found no other detection.
For each non-detected BD, we compute, using an IDL procedure, the limiting magnitude of each window exposure for a 3 point-source detection at the detector position of the BD because this local value is not provided by any SAS command. We first need to determine the relation between sky coordinate and detector coordinate. We rotate the fits sky image of the exposure window (*OM*SIMAG* fits file) using the roll angle of spacecraft pointing, we use details of window configuration (MODES extension of *OM*IMAG_* fits file) to compute absolute position within OM frame, and we apply OM distortions (introduced mainly by the fiber taper)111Provided by the POLYNOM_MAP2 extension of the current calibration file OM_ASTROMET_0011.CCF.. Comparison with the observation source list, which provides both sky and detector source coordinates, helps to fix small systematic offsets in our coordinate transformation. We apply it to BD sky coordinates with the boresight error added to find the proper BD detector coordinates. Inside a -radius disk centered at this position we estimate the sky count rate on the detector using a 2-clipping procedure222See IDL DAOPHOT-type photometry procedures: aper.pro and meanclip.pro available at http://idlastro.gsfc.nasa.gov .. We check the absence of bad pixels in the aperture using the QUALITY extension of this fits file. We compute the corresponding count rate error at the 3 level assuming a Poisson noise. We derive the count rate error of incident photons taking into account coincidence-loss, deadtime, and temporal sensitivity degradation correction (see Appendix A). Finally using the OM zero point in the -band filter ( mag), we convert this incident count rate to -band magnitude. Table 1 gives the upper limits in the -band. We conclude that the 10 non-detected BDs have 19.6–20.6 mag.
This sample of 10 non-detected BDs is composed nearly equally of accreting and non-accreting sources (see Grosso et al. 2006b). The former have 20.4 mag, and an average visible extinction of 1.5 mag, which leads, after correction of the extinction (Cardelli et al. 1989, with =3.1), to 19.4 mag and the corresponding -band luminosity333 We adopt a distance of 140 pc for the TMC and use the conversion factor from the OM count rates to fluxes for M-type stars available at http://xmm.vilspa.esa.es/sas/documentation/watchout/uvflux.shtml ., erg s-1. Assuming that the -band luminosity is directly related to the accretion luminosity as observed for the T Tauri stars (Gullbring et al. 1998), we can derive an estimate of the upper limit of the disk accretion rate. Taking typical values for the BD mass (0.07 M⊙), substellar radius ( R⊙), and disk inner radius (4.5 R⋆) leads to M⊙ yr-1, which is consistent with the disk accretion rates obtained from spectroscopy for some of these BDs (Table 1). We focus on the only BD detected in the -band in the following sections.
3 The variability of 2MASS J04141188+2811535
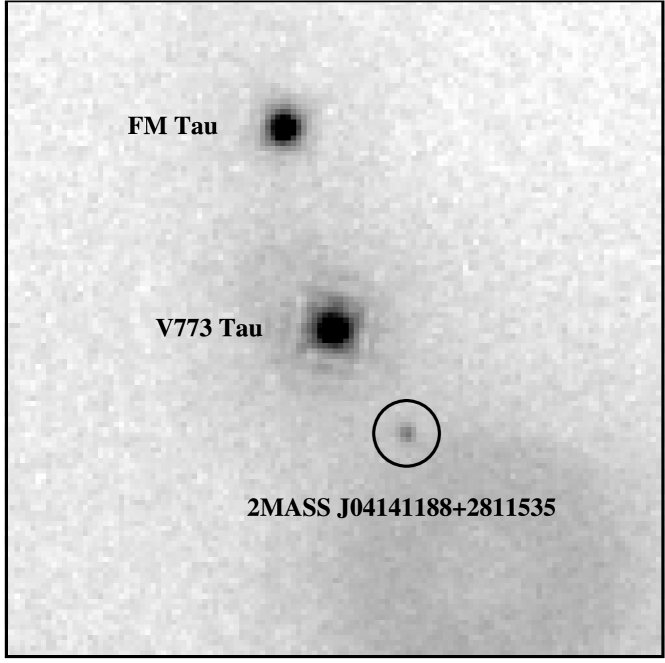
Figure 1 shows the OM image of 2MASS J0414, the young BD detected in the -band with the OM. This BD is located only away from the weak-line T Tauri star V773 Tau, the prime target of this XMM-Newton observation located on-axis444A limitation in the onboard pixel subsampling algorithm introduces a modulo 8 pattern, which is removed by the data reduction pipeline, but residual modulo 8 background fluctuations are still visible around this bright source.. Internal reflection of the light of V773 Tau (=13.1 mag) within the detector entrance window produced an out-of-focus ghost image, a “smoke ring” centered South-West away from V773 Tau. The default – radii annulus centered on the source used in omichain to estimate the sky photometry overlaps the smoke ring. Therefore, the estimate of the sky level is overestimated, and hence the photometry of 2MASS J0414 provided by this SAS task is underestimated. The -radius disk aperture used to estimate the source+sky photometry also partially overlaps the border of the smoke ring. The default aperture photometry needs to be refined.555The OM light curve of 2MASS J0414 presented previously in conference proceedings (Grosso et al. 2006a) was obtained with SAS version 6.1 and default aperture photometry, and was then strongly affected by the smoke ring.
We take the sky region on the detector image (here the small central imaging window; *IMAG_0000*) as close as possible to the source. Indeed, the FWHM is about in the -band, and the PSF wings are limited for this weak source, consequently there is no obvious signal from the source beyond . Therefore, we tune the sky annulus from – pixels, i.e., as close as possible to the source center. This operation is not allowed in the SAS command omsource, and we had to use our own IDL procedure for this aperture photometry. We keep the canonical -radius for the source+sky aperture because this is the size that was used in the calibration of the coincidence-loss. Moreover, taking a smaller radius would imply the use of the PSF calibration (note that the PSF shape is flux dependent due to the non-linearity of the detector), and hence the introduction of other calibration uncertainties. We measure the count rates of sky+source and sky apertures on the detector, we correct the sky count rate from the difference in aperture area, and we apply non-linearity corrections (Appendix A) to both detector count rates to retrieve the count rate of sky+source and source incident photons. The count rate of source incident photons is simply the difference between these two numbers.
| Name | |||
|---|---|---|---|
| mag | mag | mag | |
| 2MASS J0414 | 19.490.25 | 19.130.10 | 19.560.07 |

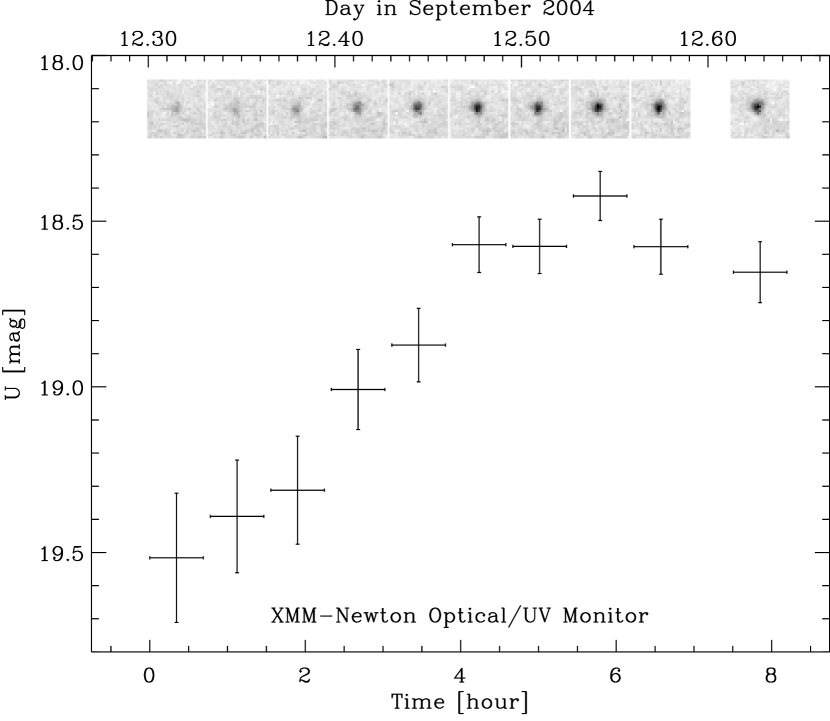
The resulting photometry of 2MASS J0414 is shown in Fig. 2. The location of this BD on the small central imaging window of the OM provided a nearly continuous coverage during h with 42 min-exposures. The magnitude of the BD increased regularly from 19.5 mag at the beginning of the observation, peaked 6 h later at 18.4 mag, and then decreased to 18.65 mag in the next 2 h.
We obtained, about one year after the OM observation, a follow-up observation of 2MASS J0414 with the 1.3-m McGraw-Hill telescope at the MDM observatory. This source was observed twice, 6.4 h apart on October 25, 2005. The source had a constant magnitude of mag (Table 2). The first OM -band measurement is fully consistent with this ground photometry; therefore we consider this -band level as the quiescent level of 2MASS J0414.
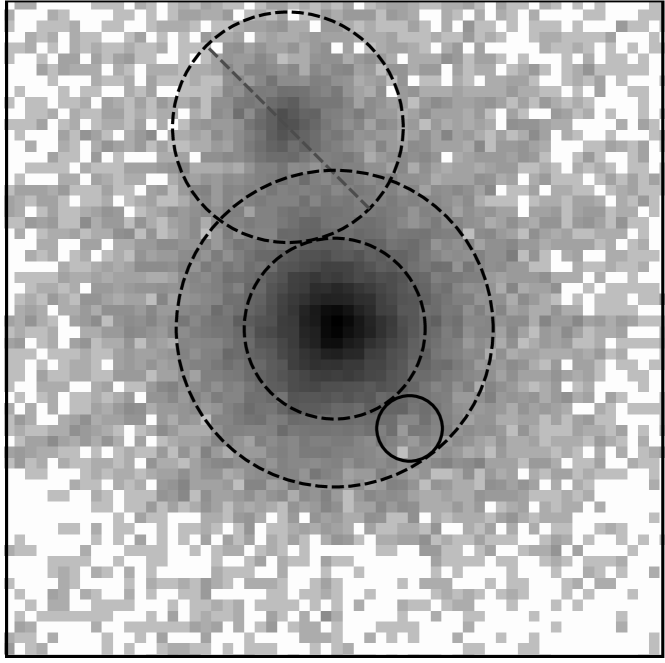
Figure 4 shows the simultaneous XMM-Newton/EPIC (pn+MOS1+MOS2) image of V773 Tau. 2MASS J0414 is located on the highly structured PSF wings of this bright X-ray source. No X-ray source was detected at this location with the SAS source detection algorithm. The upper limit on the X-ray luminosity in the 0.5–8 keV energy range is erg s-1, and (Grosso et al. 2006b). For comparison, BDs detected in X-rays in the TMC have to (Neuhäuser et al. 1999; Mokler & Stelzer 2002; Grosso et al. 2006b); therefore this upper limit is not so strong. We also look here for possible X-ray variability, which could help to detect this BD during a limited time interval. Figure 4 shows the source+background X-ray light curve for XMM-Newton/EPIC pn at the position of 2MASS J0414, compared with the estimate of the background level inside the -radius extraction region. No X-ray excess is found above the background, hence 2MASS J0414 is definitively not detected in X-rays.
4 Discussion
2MASS J0414 was identified as a (young) BD of the TMC by Luhman (2004). It has a visual extinction of 1.1 mag; an M6.25 spectral type, which corresponds to an effective temperature of 2960 K; and a bolometric luminosity of 0.015 L⊙ (Luhman 2004). From these values the BD radius can be estimated to 0.5 R⊙. Using the evolutionary tracks from Baraffe et al. (1998), the BD mass is 0.07 M⊙. The only published optical spectrum of 2MASS J0414, obtained on December 15, 2003, exhibits a strong excess of continuum at short wavelengths plus a strong H emission (=250 Å; Muzerolle et al. 2005) indicating accretion from a circumsubstellar disk (Luhman 2004), with an estimated accretion rate of M⊙ yr-1 (Muzerolle et al. 2005). Blueshifted absorption components superimposed on the H accretion emission line provide evidence for an outflow (Muzerolle et al. 2005).
2MASS J0414 has (Table 2), which is extremely blue for an object with an M6.25 spectral type. This strong blue excess indicates that this BD is actively accreting. Following the method used in Sect. 2, we find that its quiescent level, mag, corresponds to M⊙ yr-1, which is consistent with the value of Muzerolle et al. (2005) derived from spectroscopy. Therefore, the high disk accretion rate of 2MASS J0414 is likely the reason why we detected only this BD in the -band.
We consider 3 possible sources of -band variability for this young BD, namely: a magnetic flare, non-steady accretion onto the substellar surface, and rotational modulation by a hot spot. We discuss these 3 possibilities in turn.
XMM-Newton observations of coronal flares from active stars have shown an extremely good temporal correlation between UV and X-ray variations (Mitra-Kraev et al. 2005). A similar result was found in the optical -band and X-rays in an XMM-Newton observation of Proxima Cen, where several X-ray weak flares were preceded by an optical burst (Güdel et al. 2004). We can predict the flare luminosity increase in the X-rays with the UV-X-ray relationship in flares of Mitra-Kraev et al. (2005). The increase from quiescent to flare peak in the -band is equivalent to a spectral luminosity density of erg s-1 . The Mitra-Kraev et al. (2005) relationship, based on the OM filter (Ehle et al. 2005), yields erg s-1 in the 0.5–8 keV energy range, which is a lower limit on the X-ray luminosity increase because the -band filter covers roughly half of the wavelength range of the filter (200–400 nm). Therefore, a UV flare would produce an X-ray flare at least 10 times brighter than the upper limit on the X-ray luminosity of 2MASS J0414, hence it would be easily detectable. Yet, we do not detect 2MASS J0414 in X-rays during the -band maximum of luminosity. Moreover, the luminosity increase lasts for at least 6 h and exhibits a slow continuous rise. In contrast, the -band flares observed from Proxima Cen are impulsive, and the duration of the longest flare is shorter than one hour (Güdel et al. 2004). We thus conclude that the -band luminosity rise is unlikely to result from a magnetic flare.
Emission line variability occurring on timescales of hours has been reported for young BDs by Scholz & Jayawardhana (2006). The line variability is interpreted as non-steady accretion onto the substellar surface with the accretion rate varying by one order of magnitude over a few hours. The -band luminosity rise observed for 2MASS J0414 could similarly result from an accretion burst onto the central object.
Assuming a purely radial free-fall motion of the gas from the disk’s truncation radius towards the corotating BD, the 6 h timescale of the -band rise would correspond to the travel time from a distance of 3.5 substellar radii (i.e., 1.8 R⊙) above the substellar surface666The ballistic infall velocity from rest at the disk’s truncation radius, , is: (e.g., Hartmann et al. 1994). Therefore, assuming a purely radial infall, the travel time from the disk’s truncation radius to the substellar surface is: , where .; the terminal velocity would be about 200 km s-1. The Keplerian period at the disk’s truncation radius is then about 35 h, which is in the range of rotational periods observed for BDs (4–110 h Scholz & Eislöffel 2005; Zapatero Osorio et al. 2006). The -band increase of 1.1 mag would then translate into a mass accretion rate enhanced by a factor of nearly 3 compared to the quiescent level, assuming that the -band luminosity is directly related to the accretion luminosity as observed for the T Tauri stars (Gullbring et al. 1998).
As an alternative to the accretion burst, the 2MASS J0414 light curve may simply reflect the rotational modulation of the object’s luminosity by a hot accretion shock located on the substellar surface. Evidence for rotational modulation of the H line profile by the accretion flow has previously been reported in another young BD (Scholz et al. 2005). A hot accretion spot would result in the periodic modulation of the light curve on a timescale of the BD rotational period. The 6 h rise time of 2MASS J0414’s -band light curve suggests a rotational period of the order of 12 h, and is thus consistent with rotational modulation. Assuming a black-body temperature of 8000 K for the accretion shock, the hot spot would cover about 0.3% of the substellar surface (e.g., Bouvier et al. 1993). This value is similar to the size of accretion shocks on classical T Tauri stars. The two subsequent -band ground observations, obtained 6.4 h apart, show no sign of variability, unlike the OM light curve on this timescale. This indicates that 2MASS J0414 was back to its quiescent level nearly one year after the OM observations. Accretion hot spots have been reported to be variable features in T Tauri stars, and even in one young BD (see Scholz et al. 2005, and references therein).
We conclude that at least two plausible sources of variability could account for the observed -band light curve of 2MASS J0414: an episodic accretion event onto the central object or the rotational modulation of the BD luminosity by a hot accretion spot. In both cases these observations indicate variable mass accretion rate in this BD.
Our -band survey of 11 BDs (of which 5 are actively accreting and 4 are not accreting) indicates 2MASS J0414 as the brightest source, displaying variability related to accretion from a circumsubstellar disk. 2MASS J0414 is then the best target of this sample of 5 accreting BDs for ground follow-up observations to investigate accretion in substellar objects, for example with simultaneous -band and spectroscopic ground monitoring with a one-hour sampling.
Acknowledgements.
We thank the International Space Science Institute (ISSI) in Bern for significant financial support of the project team, Arlin Crotts for organizing and obtaining photometry observations with the MDM on our behalf, and the anonymous referee for useful comments. XMM-Newton is an ESA science mission with instruments and contributions directly funded by ESA Member States and the USA (NASA). X-ray astronomy research at PSI has been supported by the Swiss National Science Foundation (grants 20-66875.01 and 20-109255/1). M.A. acknowledges support from NASA grant NNG05GF92G.Appendix A Formulae for the OM aperture photometry and associated errors
We give here the formulae for the canonical 6″-radius aperture that we used in our IDL procedures for the OM aperture photometry and associated errors.
The relation between the count rate of incident photons, , and the measure count rate on the detector, , is:
| (1) |
where is the theoretical formula for coincidence-loss, is the empirical correction of from calibration observations, is the deadtime correction, and is the temporal degradation sensitivity correction. is the frametime, i.e., the sum of the frame transfer time ( ms), needed to transfer the charges accumulated on the continuously exposed CCD during an integration time into the storage area, and the time needed to read out all the pixels in the storage area. The frametime depends on the size and position of the exposure window; here it is in units of seconds, and . Note that using an aperture radius different than the 6″ value used in the calibration of the coincidence-loss would add a correction factor in Eq. 1 using the PSF calibration.
The theoretical correction of the coincidence-loss (see Ehle et al. 2005) is given by:
| (2) |
The empirical correction of this theoretical formula is:
| (3) |
where the polynomial coefficients are provided by the extension COINCIDENCE of the current calibration file OM_PHOTTONAT_0003.CCF.
The only time when source photons are not properly recorded by the detector is during charge transfer; therefore the deadtime is equal to the frame transfer time, and the deadtime fraction is . Consequently, the deadtime correction is: .
The temporal degradation sensitivity correction, , is available in SAS version 6.5 in the fits header of the observation source list (*OM*SWSRLI*).
The count rate error of incident photons, , is computed by Gaussian propagation in Eq. 1 of the Poissonian count rate error on the detector, , where is the exposure time, which leads to:
| (4) | |||||
We calculate the error associated with an object count rate measured with aperture photometry as the quadratic sum of the count rate error of incident sky+object photons and the count rate error of incident sky photons determined with previous equations.
References
- Baraffe et al. (1998) Baraffe, I., Chabrier, G., Allard, F., & Hauschildt, P. H. 1998, A&A, 337, 403
- Bouvier et al. (2006) Bouvier, J., Alencar, S. H. P., Harries, T. J., Johns-Krull, C. M., & Romanova, M. M. 2006, in Protostars and Planets V, ed. B. Reipurth, D. Jewitt, & K. Keil, in press [arXiv:astro–ph/0603498]
- Bouvier et al. (1993) Bouvier, J., Cabrit, S., Fernandez, M., Martin, E. L., & Matthews, J. M. 1993, A&A, 272, 176
- Briceño et al. (2002) Briceño, C., Luhman, K. L., Hartmann, L., Stauffer, J. R., & Kirkpatrick, J. D. 2002, ApJ, 580, 317
- Cardelli et al. (1989) Cardelli, J. A., Clayton, G. C., & Mathis, J. S. 1989, ApJ, 345, 245
- Ehle et al. (2005) Ehle, M., Breitfellner, M., González-Riestra, R., et al. 2005, XMM-Newton Users’ Handbook
- Güdel et al. (2006) Güdel, M., Briggs, K. R., Arzner, K., et al. 2006, A&A, 999, 0 (this issue)
- Gizis et al. (2005) Gizis, J. E., Shipman, H. L., & Harvin, J. A. 2005, ApJ, 630, L89
- Grosso et al. (2006a) Grosso, N., Briggs, K., Güdel, M., et al. 2006a, in ESA SP-604: The X-ray Universe 2005, ed. A. Wilson, 83–84
- Grosso et al. (2006b) Grosso, N., Briggs, K., Güdel, M., et al. 2006b, A&A, 999, 0 (this issue)
- Güdel et al. (2004) Güdel, M., Audard, M., Reale, F., Skinner, S. L., & Linsky, J. L. 2004, A&A, 416, 713
- Guieu et al. (2006) Guieu, S., Dougados, C., Monin, J. L., Magnier, E., & Martín, E. L. 2006, A&A, 446, 485
- Gullbring et al. (1998) Gullbring, E., Hartmann, L., Briceño, C., & Calvet, N. 1998, ApJ, 492, 323
- Hartmann et al. (1994) Hartmann, L., Hewett, R., & Calvet, N. 1994, ApJ, 426, 669
- Jayawardhana et al. (2003) Jayawardhana, R., Mohanty, S., & Basri, G. 2003, ApJ, 592, 282
- Luhman (2004) Luhman, K. L. 2004, ApJ, 617, 1216
- Luhman (2006) Luhman, K. L. 2006, ApJ, 645, 676
- Mason et al. (2001) Mason, K. O., Breeveld, A., Much, R., et al. 2001, A&A, 365, L36
- Mitra-Kraev et al. (2005) Mitra-Kraev, U., Harra, L. K., Güdel, M., et al. 2005, A&A, 431, 679
- Mohanty et al. (2005) Mohanty, S., Jayawardhana, R., & Basri, G. 2005, ApJ, 626, 498
- Mokler & Stelzer (2002) Mokler, F. & Stelzer, B. 2002, A&A, 391, 1025
- Muzerolle et al. (2005) Muzerolle, J., Luhman, K. L., Briceño, C., Hartmann, L., & Calvet, N. 2005, ApJ, 625, 906
- Natta et al. (2004) Natta, A., Testi, L., Muzerolle, J., et al. 2004, A&A, 424, 603
- Neuhäuser et al. (1999) Neuhäuser, R., Briceño, C., Comerón, F., et al. 1999, A&A, 343, 883
- Preibisch et al. (2005) Preibisch, T., McCaughrean, M. J., Grosso, N., et al. 2005, ApJS, 160, 582
- Scholz & Eislöffel (2004a) Scholz, A. & Eislöffel, J. 2004a, A&A, 419, 249
- Scholz & Eislöffel (2004b) Scholz, A. & Eislöffel, J. 2004b, A&A, 421, 259
- Scholz & Eislöffel (2005) Scholz, A. & Eislöffel, J. 2005, A&A, 429, 1007
- Scholz & Jayawardhana (2006) Scholz, A. & Jayawardhana, R. 2006, ApJ, 638, 1056
- Scholz et al. (2005) Scholz, A., Jayawardhana, R., & Brandeker, A. 2005, ApJ, 629, L41
- Zapatero Osorio et al. (2006) Zapatero Osorio, M. R., Martín, E. L., Bouy, H., et al. 2006, ApJ, 647, 1405