SiO and CH3CCH abundances and dust emission in high-mass star-forming cores ††thanks: Based on observations collected at the European Southern Observatory, La Silla, Chile.
Abstract
Aims. The main goal of the present study is to determine the fractional SiO abundance in high-mass star-forming cores, and to investigate its dependence on the physical conditions. In this way we wish to provide constraints on the chemistry models concerning the formation of SiO in the gas phase or via grain mantle evaporation. The work addresses also CH3CCH chemistry as the kinetic temperature is determined using this molecule.
Methods. We estimate the physical conditions of 15 high-mass star-forming cores and derive the fractional SiO and CH3CCH abundances in them by using spectral line and dust continuum observations with the SEST.
Results. The kinetic temperatures as derived from CH3CCH range from 25 to 39 K, the average being 33 K. The average gas density in the cores is cm-3. The SiO emission regions are extended and typically half of the integrated line emission comes from the velocity range traced out by CH3CCH emission. The upper limit of SiO abundance in this ’quiescent’ gas component is . The average CH3CCH abundance is about . It shows a shallow, positive correlation with the temperature, whereas SiO shows the opposite tendency.
Conclusions. We suggest that the high CH3CCH abundance and its possible increase when the clouds get warmer is related to the intensified desorption of the chemical precursors of the molecule from grain surfaces. In contrast, the observed tendency of SiO does not support the idea that the evaporation of Si-containing species from the grain mantles would be important, and it contradicts with the models where neutral reactions with activation barriers dominate the SiO production. A possible explanation for the decrease is that warmer cores represent more evolved stages of core evolution with fewer high-velocity shocks and thus less efficient SiO replenishment.
Key Words.:
ISM: clouds – ISM: molecules – molecular data – molecular processes – radio continuum: ISM – radio lines: ISM – stars: formation1 Introduction
High-mass star-forming regions with large molecular column densities and bright molecular lines offer excellent opportunities to study interstellar chemisty. Results from chemistry models can be combined with observational data on the physical conditions and molecular abundances. This information can help us to link the properties of massive dense cores, their chemical characteristics, and phenomena like massive outflows, ultracompact (UC) H ii regions and molecular masers into a coherent evolutionary sequence. This is useful since the process of high-mass star formation is not yet well understood (see, e.g., Garay & Lizano (1999); Fontani et al. (2002); Thompson and Macdonald (2003)).
In this paper we derive the abundances of silicon monoxide, SiO, and methyl acetylene, CH3CCH, in a sample of massive molecular cloud cores, and discuss the relation of these abundances to the physical conditions and the probable evolutionary stages of the cores. The purpose is to contribute towards a better understanding of the interplay between the processes associated with massive star formation and the physical and chemical properties of the surrounding dense core.
SiO is believed to trace exclusively shocked gas as its spectral lines have wings and are often shifted relative to the emission from the ambient gas (see, e.g., Martín-Pintado et al. (1992); Schilke et al. (1997)). Current understanding is that SiO is evaporated from the dust grains when the shock velocity is greater than about 20 km s-1. This, however, depends on the grain-mantle composition in the preshock gas (e.g., Schilke et al. (1997)). In dense and warm giant molecular cloud (GMC) cores, SiO seems to present also in the quiescent gas component. In few interferometric maps available extended SiO emission at ambient cloud velocity is either seen in the vicinity of high-velocity outflows (Hatchell et al. (2001)) or totally separate from them (Lefloch et al. (1998); Codella et al. (1999); Shepherd et al. (2004); Fuente et al. (2005)). The fractional abundance of ’quiescent SiO’ is estimated to be about in GMC cores. SiO absorption measurements towards dormant GMCs, so called ’spiral arm clouds’, give similar abundances (Greaves et al. (1996)). The present observational evidence is insufficient to determine whether the presence of SiO is caused by thermal evaporation, enhanced neutral-neutral production pathways, photon-induced reactions, or by shock removal. To resolve this indistinctness it seems beneficial to determine fractional SiO abundances and kinetic temperatures in a representative sample of GMC cores, and to correlate these also with the kinematic information contained in the spectral lines.
CH3CCH is an organic molecule observed rather frequently towards dense cores. Its abundance is on the order of . The rotational temperature, , derived from a series of rotational lines of CH3CCH is considered a good estimate of the gas kinetic temperature, , in molecular clouds (e.g., Askne et al. (1984); Bergin et al. (1994)). Since CH3CCH has a relatively low dipole moment ( D, Bauer et al. (1979); Burrell et al. (1980)), its rotational levels are thermalized at densities or higher (e.g., Kuiper et al. (1984)). This property together with the assumption that CH3CCH emission is optically thin (), allow us to assume local thermodynamic equilibrium (LTE), so that may be derived. Besides for , we use for estimating the dust temperature, , which is needed to derive the total gas column densities ()) from dust continuum observations.
The source list consists of 15 high-mass star-forming cores associated with OH, H2O, and CH3OH masers, UC H ii regions and bright, thermal SiO rotational line emission. The sources were selected from the SiO survey of Harju et al. (1998) (hereafter HLBZ98). The positions selected for the SiO and CH3CCH line observations are listed in Table 2. These positions served as map centres in the continuum observations.
The SiO and CH3CCH column densities and the kinetic temperatures in the present paper are derived from spectral line observations with the SEST. The estimates for the molecular hydrogen column densities, , and the core masses are derived from dust continuum maps obtained with the SIMBA bolometer at SEST. The observations and the data reduction procedures are described in Sect. 2. The direct observational results are presented in Sect. 3. In Sect. 4 we describe the methods used to derive the physical/chemical properties of the GMC cores. In Sect. 5 we discuss the results, and finally, in Sect. 6 we summarize our major conclusions.
2 Observations and data reduction
2.1 Molecular lines
The spectral line observations were made during four observing runs from 1995 to 2003 with the Swedish-ESO-Submillimetre Telescope SEST at the La Silla observatory, Chile. The SEST 3 and 2 mm (SESIS) dual SIS single sideband (SSB) receiver was used. The observations were made in the dual beam switching mode (beam throw in azimuth). The SEST half-power beam width (HPBW) and the main beam efficiency, , at frequencies 86 GHz, 115 GHz and 147 GHz are , , and 0.75, 0.70, 0.66, respectively. The SEST high resolution 2000 channel acousto-optical spectrometer (bandwidth 86 MHz, channel width 43 kHz) was split into two halves to measure two receivers simultaneously. At the observed wavelengths, 2 mm and 1 mm, the 43 kHz channel width corresponds to approx. 0.12 km s-1 and 0.08 km s-1, respectively. The observed molecular transitions, their rest frequencies and the upper level energies are listed in Table 1.
Calibration was achieved by the chopper wheel method. Pointing was checked regularly towards known circumstellar SiO masers. Pointing accuracy is estimated to be better than .
The 28SiO (, ) and (, ) observations were carried out in October 1995 and April 1996 and are described in detail in HLBZ98. 29SiO() and () observations were carried out in October 1998. Typical values for the effective SSB system temperatures and the RMS noise of the spectra were 140 K and 170 K, and 0.016 K and 0.021 K at frequencies 86 GHz and 130 GHz, respectively. Linear baselines were subtracted from the spectra.
The CH3CCH () and () observations were carried out in June 2003. At this time the electronics of the SESIS 2 mm receiver had been decommissioned and only the 3 mm receiver was available. These were the last spectral line observations made with SEST. For each source typically six spectra, each with 2 minutes integration time, were obtained. The effective SSB system temperatures were 130 K for the CH3CCH() transition and 250 K for the CH3CCH(). The RMS of the spectra were 0.017 K and 0.024 K for the two transitions, respectively. Because of the better performance of the receiver at the lower frequency, the transition was chosen for the survey. A third order baseline was subtracted from the spectra. Four -components () were detected towards all sources, and Gaussian profiles were fitted to the lines. The CLASS program of the GILDAS software package developed at IRAM was used for the reductions. In the fitting procedure the line separations between the components were fixed and the line widths for all -components were assumed to be identical.
2.2 Continuum
The 1.2 mm continuum observations were carried out in June 2003 with the 37 channel SEST imaging bolometer array, SIMBA. The SIMBA central frequency is 250 GHz and the bandwidth about 50 GHz. The HPBW of a single bolometer element is and the separation between elements on the sky is . The observations were conducted in stable weather. Frequent skydips were used to determine the atmospheric opacity and the values obtained varied between 0.27 and 0.3. Pointing was controlled by observing sources with known accurate coordinates and is estimated to be better than 5″. Uranus was used for flux density calibration.
The observations were done in the fastscanning mode with a scanning speed of . The typical map consisted of 65 scans of in length in azimuth and spaced by in elevation. Each source was observed at least twice. The two maps were done at different LST values to reduce the possibility of strong artefacts in the reduced maps. The data were reduced using the MOPSI111MOPSI is a software package for infrared, millimeter and radio data reduction developed and constantly upgraded by R. Zylka. software package according to guidelines in the SIMBA Observers Handbook (2002) and Chini et al. (2003).
All the observed maps contained strong sources and therefore, as suggested in the SEST handbook, no despiking was applied to the data. The data reduction deviated from the suggestions in the SEST handbook in the following details. The SEST dish shape (and the beam profile) degrades as a function of the elevation as the dish deforms because of its own weight. Gain-elevation correction is used to compensate the decreasing of the observed source peak intensity as a function of the telescope elevation. However, no gain-elevation correction to the present data was applied because aperture photometry was used to define the source flux. The source flux lost because of the decrease of the telescope gain in the source position is recovered as the source is mapped. The telescope gain is unity at elevation of 74.6 degrees and decreases by 10 % at 45 degrees. Most of the present observation were obtained at elevations 50 degrees or higher where the said correction is small. Third order baseline was applied to the data before correlated noise removal after which all the bolometer elements with insufficient base range were masked. A first order baseline was applied to individual scan lines after this. The refinement of the SIMBA data reduction is discussed in detail in Haikala (2006, in preparation).
3 Observational results
The observed sources are listed in Table 2. The columns of this table are: (1) source name; (2) and (3) equatorial coordinates (J2000.0); (4) galactic coordinates; (5) distance; (6) galactocentric distance; (7) LSR velocity determined from the CH3CCH line; (8) notes on association with molecular masers or an UC H ii region. When no distance reference is given in Col. 5, the value is the kinematic distance calculated from the CH3CCH velocity using the rotation curve determined by Brand & Blitz (1993) and kpc (galactocentric distance of the Sun) and km s-1 (circular velocity at a distance ).
3.1 Dust emission
The obtained SIMBA maps are presented in Fig. 1. The maps are plotted to the same angular and intensity scales. In Table 3 we list the coordinates (, ) and the intensities () at the dust emission maxima identified on the maps. The SEST HPBW at the frequency of the continuum observations is 24″which is less than half of the HPBW at the frequency of the observed SiO and the CH3CCH lines. In order to estimate the average dust and H2 column densities within the beam used for the 3 mm line observations, the SIMBA maps were smoothed to the resolution of 57″. The resulting smoothed surface brightness () towards the position of the line measurements is listed in Col. 2 of Table 4. The 1.2 mm flux density () integrated over the source and the angular size (FWHM) of the core () determined from the original map is listed in Cols. 3 and 4 of this Table. The angular sizes were estimated from two-dimensional Gaussian fits to the surface brightness distribution (geometric mean of the observed major and minor axes of Gaussians). The source size was corrected for the broadening by 24″the telescope beam in accordance with the assumption of Gaussian distributions. The flux density was calculated in an 72″diameter circular aperture which correponds to three times the original beam size.
3.2 SiO and CH3CCH lines
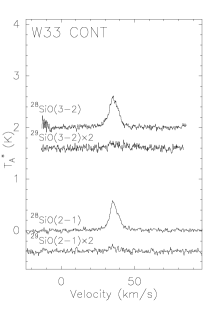
The obtained SiO spectra are presented in Fig. 2. The lines are nearly Gaussian in the central part and have broad, asymmetric wings. The line parameters are listed in Table 6. In this table we give the minimum, maximum, and peak velocities (, and , respectively), and the integrated intensities, , over the given velocity range.
The spectra of the two SiO isotopologues were used to estimate the optical thicknesses of the and lines of 28SiO, and . For this purpose all spectra were resampled to the same LSR velocity grid with a channel width of 1 km s-1. The smoothing of the spectra to this resolution was necessary to achieve the sufficient signal to noise ratio. Using these resampled spectra the optical thicknesses and could be derived in 1–13 velocity channels near the line peak for twelve sources. The terrestrial SiO isotopic abundance ratio is . In interstellar medium values in the range 10–20 have been determined (Penzias (1981)). Here we use the value when determining the optical thicknesses. The 28SiO optical thicknesses and are typically between 1 and 3 in the line centres.
The excitation temperatures, , were estimated from the optical thickness ratio by using Eq. (2) of HLBZ98. These estimates are based on the assumption that . They do not depend on the beam filling as the optical thicknesses were determined using pairs of lines having similar frequencies. The derived values of are close to 5 K for all sources and velocity channels. The weighted average of and its standard deviation are K (see Table 5).
From these results, the SiO column densities, (SiO), were estimated from the integrated intensities of the 29SiO spectra by assuming optically thin emission and uniform excitation of the rotational lines with K for all sources.
The CH3CCH spectra are shown in Fig. 3, and the Gaussian parameters of the detected lines are given in Table 7. The line peak velocities and widths (FWHM) are listed in Cols. 2 and 3 of this table. The integrated intensities of the components and 3 are given in Cols. 4 - 7. The integrated intensities were used to derive the rotational temperatures, , and the CH3CCH column densities, , with the population diagram method described and discussed in, e.g., Askne et al. (1984), Bergin et al. (1994), and Goldsmith & Langer (1999).


4 Physical/chemical parameters of the cores
4.1 Column densities and rotational temperatures
In the case of uniform excitation and optically thin dipole transition, the total column density of the emitting molecule is related to the integrated line intensity by the formula
| (1) |
where is the Boltzmann constant, is the vacuum permittivity, is the permanent dipole moment, and are the frequency of the transition and the line strength, is the upper state energy, is the rotational partition function, is the beam-source coupling efficiency, and the function is defined by
| (2) |
For the rotational transition of a linear molecule, like SiO, . We have assumed that K for all sources (see Table 5) and (0.75 at 86 GHz and 0.68 at 129 GHz), which means that the source just fills the main beam. For the SiO isotopic abundance ratio we have used the value .
The rotational temperatures, , and the CH3CCH column densities, , were derived by means of the population diagram method. This method is based on comparison of intensities of spectral lines which lie close in frequency although arising from rotational levels with different energies. In the case of CH3CCH, the close lying transitions represent different -components.
Assuming uniform excitation and optically thin emission, the ’rotational diagram equation’, i.e. the equation relating the integrated intensities of different -components to the rotational temperature, , and the total column density, , can be written as
| (3) |
where is the degeneracy and statistical weight takes the spins of hydrogen nuclei into account. See, e.g., Appendix B of Anderson et al. (1999), for derivation of Eq. (3). As above, we have again assumed that .
Rotational diagrams for two sources are shown in Fig. 4. Straight lines were fitted to the data using a least-squares fitting technique. The data are consistent with a single . The goodness of the fit substantiates the assumptions that the gas is in LTE with and that the lines are optically thin.


The H2 column density, (H2), of each source was derived from dust continuum emission using the following equation:
| (4) |
where is the observed dust surface brightness (see Table 4), is the Planck function for a blackbody of dust temperature , is the mean molecular weight accounting for a 10 % contribution of helium (e.g., Hill et al. (2005)), kg is the mass of the hydrogen atom, is the mass absorption coefficient per unit mass of dust, and is the dust-to-gas mass ratio.
We assume that is equal to the gas kinetic temperature derived from CH3CCH observations. and are believed to be well coupled deep in the cloud, above a density of about cm-3, due to collisions between gas and dust grains (see, e.g., Takahashi et al. (1983); Lee et al. (2004)). Values of 0.1 m2 kg-1 at 1.2 mm (Ossenkopf & Henning (1994)) and are adopted for and , respectively.
The rotational temperatures, the H2, SiO and CH3CCH column densities and the fractional SiO and CH3CCH abundances () are listed in Table 8. The average value and the standard deviation of is K. The (H2) values are found to be cm-2, and (SiO) and (CH3CCH) lie in the range cm-2 and cm-2, respectively. The values of and are found to be and , respectively.
4.2 Linear sizes, mass estimates and densities
The linear sizes have been computed from the angular diameters listed in Table 4 using the distances listed in Table 2.
The core masses have been estimated using the 1.2 mm continuum maps. We have also calculated the virial masses using the velocity dispersions and kinetic temperatures from the CH3CCH data. The mass of a core, , has been calculated assuming that the dust emission is optically thin and that the dust-to-gas ratio, , and the dust absorption coefficient per unit mass, , are constant. These assumptions imply the following equation:
| (5) |
where is the 1.2 mm continuum integrated flux within the selected aperture (see Table 4).
The virial masses, , have been estimated by approximating the mass distribution by a homogenous, isothermal sphere without magnetic support and external pressure, using the formula
| (6) |
where is the FWHM of the CH3CCH() line, is the gas kinetic temperature derived from the CH3CCH observations, is the distance to the source, and is the angular diameter of the source as estimated from the SIMBA maps. For W28 A2(2) no virial mass estimate was obtained as its (deconvolved) angular size is less the half the beam size.
The average H2 number densities, , were calculated using the masses, , and radii, , estimated from the dust continuum maps. The obtained radii, masses and average densities are listed in Table 9. The average radius of the sources is pc, the average value of the masses estimated from continuum emission is M☉, and the average density is cm-3.
5 Discussion
5.1 SiO and CH3CCH abundances
The 1.2 mm dust emission is likely to be dominated by the cool, K, envelopes, although it has a contribution from hot cores ( K) around newly born massive stars. The dust temperatures derived by Faúndez et al. (2004) towards several of our sources using SIMBA and IRAS 100 and 60 m data are comparable to the CH3CCH rotational temperatures, , derived here. Taken the uncertainties due to different beam sizes of the SIMBA and IRAS into account the agreement is reasonable and substantiates the assumption used in the total estimates.
While it can be assumed that the CH3CCH lines and 1.2 mm dust continuum emission trace to a large part the same material, this is not obvious for dust and SiO. All SiO lines observed in this survey show high-velocity wings, are single-peaked, and have their maxima near the systemic velocity of the cloud. These characteristics can be qualitatively explained with bow-shock models where the jet generating the shock is seen in a small angle, i.e. either head on or tail on. A large inclination should result in a double peaked profile from a bow shock, and in a narrow line in the case where the emission originates in a turbulent wake behind a bow shock (HLBZ98, Fig. 12). In view of the distance to the sources and the angular resolution of the present observations, it is clear that the telescope beam encompasses entire star-forming regions with various gas components and young stars at different evolutionary stages. The line profiles may therefore have contribution from several outflows with different inclinations.
In the light of previous SiO mapping observations it seems possible, however, that part of the low-velocity emission originates in the quiescent envelope. This kind of component has been discovered in high-resolution SiO mappings of star-forming regions (Lefloch et al. 1998; Codella et al 1999; Shepherd et al. 2004; Fuente et al. 2005). In these studies SiO emission characterized by narrow and broad lines have been found to come from separate regions. The SiO abundances derived for the low-velocity component are . This value is smaller than the abundances derived towards high-velocity shocks (, e.g., Bachiller et al. (1991); Gibb et al. (2004)), and larger than the upper limits derived in cold, dark clouds and PDRs (, e.g., Ziurys et al. (1989); Martín-Pintado et al. (1992); Schilke et al. (2001)).
In the present single-pointing observations typically half of the integrated SiO intensity comes from the velocity range with detectable CH3CCH, which is supposed to trace the quiescent gas component (see Table 6). However, the same radial velocity does not necessarily mean spatial coincidence. Although SiO abundances derived in outflows are based on comparison with CO in the same velocity range, a similar spatial velocity correlation cannot be assumed near the cloud’s systemic velocity. Depending on the structure and orientation of the shock, it is possible to find shock-produced SiO at low radial velocities. Therefore the column density of the low-velocity SiO gives only upper limit to the SiO column density in the quiesent envelope, and the same is probably true for the fractional SiO abundance using the H2 column density determined by dust.
A comparison of the SiO main beam brightness temperatures, , with the derived optical thicknesses, , and excitation temperatures, , suggests that the beam filling factors are close to unity, and the SiO emission regions are extended. We find that the upper limits for the fractional SiO abundance in the low-velocity gas are on the order of , i.e. similar to the SiO abundances derived previously for quiescent gas component in some star-forming regions. It should be noted, however, that the same result would be achieved if SiO is present only in shocked layers filling 1% of the gas volume. This is not necessarily in contradiction with nearly uniform beam filling.
The model for greatly enhanced SiO production in powerful shocks by silicate grain destruction and subsequent high-temperature gas-phase chemistry is well established (Schilke et al. (1997); Caselli et al. (1997); Pineau des Forêts et al. (1997)). The possible occurrence of SiO in the quiescent gas component is not as well understood. In the postshock gas SiO should convert in a reaction with OH into SiO2 (SiO + OH SiO2 + H), which is eventually removed from the gas phase by accretion onto the dust grains. According to Codella et al. (1999), the times needed to remove SiO from the gas phase and to slow down speeding SiO ’blobs’ are similar, yr, and this would support the outflow remnant scenario. In another, perhaps more feasible model high-velocity SiO emission comes from bow-shocks generated by high-velocity jets. In this case low-velocity SiO can originate in turbulent wakes behind bow-shocks (see Raga and Cabrit (1993) and the model profiles in Fig. 12 of HLBZ98).
It has been suggested that SiO can be produced also in warm, quiescent gas via neutral or ion-neutral reactions, possibly preceded by evaporation of Si-bearing molecules from the icy mantles of dust grains. The suggestion of Ziurys et al. (1989) and Langer & Glassgold (1990) that neutral reactions with activation energies are important for the SiO production in warm gas, would imply a strong correlation between the SiO abundance and the average kinetic temperature. As shown in Fig. 5, bottom panel, even in the rather narrow temperature range covered, K, a substantial change in the fractional SiO abundance would be expected if it were proportional to as suggested by Langer & Glassgold (1990). In the model of MacKay (MacKay (1995); MacKay (1996)) icy silicon is mainly in the form of SiH4, which can evaporate when the dust is warmed up. Also in this model one could expect the warmer cores have larger SiO abundances.
The abundances derived for the low-velocity SiO do not show, however, any positive correlation with the average kinetic temperature. Instead, they even seem to decrease slightly when the temperature rises (Fig. 5, bottom panel).
Also the CH3CCH production can be enhanced by intensified desorption. CH3CCH is one of the lowest energy products in reaction between the methylidine radical (CH) and ethylene (C2H4, Canosa et al. (1997)) which is formed on dust grains. The diagram presented in Fig. 5, top panel, suggests a positive correlation between the fractional CH3CCH abundance and , which would conform with the desorption scenario. On the other hand, this tendency does not agree with the prediction of the pure gas-phase model of Lee et al. (1996) (see also Alakoz et al. (2002)), which predict a strong anticorrelation between the CH3CCH abundance and the kinetic temperature. The CH3CCH abundances derived here are similar to those found in the Orion Ridge, M17 and Cepheus A (Ungerechts et al. (1997); Bergin et al. (1997)), and substantially larger than those determined towards cold, starless cores (Kontinen et al. (2000); Markwick et al. (2005)).
These findings lend support to the possibility that indeed grain-surface reactions are important for the production of CH3CCH and its gas-phase abundance depends on temperature via the thermal desorption. On the other hand, no evidence for such behaviour is found in the case of SiO. This complies with the shock origin of SiO. The diminishing tendency towards warmer cores suggested by Fig. 5 may reflect an evolutionary effect.
According to the picture presented by Fuente et al. (2005) based on a study of the environments of two young stars in the region of the nebula NGC 7129, protostellar envelopes are dispersed and warmed up during the early stellar evolution, at the same time as shocks associated with outflows get less energetic. For SiO this means decreasing abundance with time. The abundance variation from core to core is not very large in our sample. This is probably related to the fact that all the studied objects are associated with powerful masers and/or UC H ii regions, and therefore the dynamical and chemical age variations are likely to be rather limited (Garay & Lizano (1999); Bergin et al. (1997)).


5.2 Dynamical states
Most of the cores studied here appear to be gravitationally bound which is indicated by the fact that . The ratios range from 0.7 to 6.8, the average being 2.5. For five cores is substantially larger than , whereas the rest appear to be close to the virial equilibrium (, within a factor of two). The virial masses, , were calculated assuming homogenous density distributions. A more realistic distribution described by a powerlaw of the type , where is typically , would make the virial mass estimates smaller (see, e.g., Fontani et al. (2005)). On the other hand, the effect of the density gradient can be compensated by the increase of the kinetic temperature towards the core centre. All the cores studied here contain newly born massive stars which are known to give rise to expanding UC H ii regions and hot cores. Magnetic fields are likely to provide additional support against the gravitational collapse (e.g., Garay & Lizano (1999); Fontani et al. (2002)). For example, Sarma et al. (2000) detected magnetic fields toward sources A, E, and D in the NGC 6334 complex, which are of the same order as the critical fields required to support the cores against gravitational collapse.
5.3 Comments on individual sources
Ten of our fourteen targets have been included in recently published, extensive millimetre continuum surveys with SIMBA. Faúndez et al. (2004) have mapped about 150 massive cores around IRAS point sources with FIR colors typical of UC H ii regions, and discuss the general characteristics of these objects. They present the maps of IRAS 12326-6245, G326.64+0.61 (IRAS 15048-5356), OH328.81+0.63 (IRAS 15520-5234), G330.95-0.19 (IRAS 16060-5146), IRAS 16562-3959, G345.00-0.23 (IRAS 17016-4124), NGC 6334F (IRAS 17175-3544), and G351.77-0.54 (IRAS 17233-3606). The survey of Hill et al. (2005) covering about 130 regions include IRAS 12326-6245 (G301.14-0.2), G330.95-0.18, W28 A2 (G5.89-0.39), and W31 (2) (G10.62-0.38).
The structure of the sources in Fig. 1 agrees well with those presented in Faúndez et al. (2004) and Hill et al. (2005). The peak fluxes in Hill et al. (2005) for the sources in common with this work agree also well. The integrated flux densities for the sources are however higher in Hill et al. (2005) and especially in Faúndez et al. (2004) than in the present paper. Hill et al. calculated the integrated flux density inside a polygon containing all the emission around the source whereas in the present paper the integration was done inside a circle corresponding to three times the telescope beam width. Contrary to the present paper Hill et al. (2005) also applied the gain- elevation correction to the SIMBA data. The different integration aperture and the gain-elevation correction can well explain the Hill et al. (2005) higher flux densities. Faúndez et al. (2004) give no details on how the integrated fluxes were calculated so it can not be decided if the higher values are due to e.g. the integration aperture.
The kinetic temperatures from CH3CCH are lower than the dust temperatures derived by Faúndez et al. (2004) from the spectral energy distributions (SEDs) using the flux densities at 1.2 mm and in the four IRAS bands. However, as our 1.2 mm flux densities are, in general, lower than those derived by Faúndez et al., we end up with comparable masses. The masses derived by Hill et al. (2005) are on the average larger than those derived by us, mainly because they have obtained slightly higher flux densities and assumed that K. Finally, the mass estimates are proportional to the distance squared, and there are some differences in the derived kinematic distances depending on the Galactic rotation curve and used.
Next we discuss six of our sources, IRAS 12326-6245, NGC 6334, G351.77-0.54, W28 A2(2), W31 and W33 in more detail. In general, the sources are typical high-mass star-forming cores associated with several molecular masers, UC H ii regions and infrared sources (see Table 2 and Fig. 1).
5.3.1 IRAS 12326-6245
IRAS 12326-6245 is a luminous FIR source ( L☉) which is located at a kinematically estimated distance of 4.4 kpc (Zinchenko et al. (1995); Osterloh et al. (1997)). This object is associated with two UC H ii regions, both of which are associated with mid-infrared sources (Henning et al. (2000)). Also several molecular masers including H2O, OH and CH3OH have been identified at the position of IRAS 12326-6245 (see Henning et al. (2000) for references).
The molecular line maps (see Henning et al. (2000) and references therein) shows that one of the most energetic and massive bipolar molecular outflow (mass outflow rate M☉ yr-1) in the southern sky is originated close to IRAS 12326-6245.
The core 1.3 mm flux density and the gas mass obtained by Henning et al. (12.0 Jy and 2400 M☉, respectively) are very close to the values in the present study (12.8 Jy and 2200 M☉, respectively).
5.3.2 NGC 6334
The star-forming molecular ridge associated with the giant H ii region NGC 6334 is the best studied of our targets. For recent, comprehensive molecular line and continuum studies see Kraemer et al. 1999, Kraemer & Jackson 1999, Jackson & Kraemer 1999, Sandell 2000, McCutcheon et al. 2000 and Brooks & Whiteoak 2001. These authors summarize the accumulated knowledge of the region, and include keys of the nomenclature. Sandell (2000) mapped the northern part of the molecular ridge with UKT14 bolometer at the JCMT using four millimetre and submm wavelengths in the range 1.1 – 0.35 mm.
The six brightest 1.2 mm peaks listed in Table 3 can be associated with star-forming cores detected as far-infrared sources or UC H ii regions as follows: 1) FIR-I/UC H ii F; 2) I(N); 3) FIR-IV/UC H ii A; 4) FIR-V; 5) FIR-III/UC H ii C; 6) FIR-II/UC H ii D (McBreen et al. (1979); Rodríguez et al. (1982); Gezari (1982)). The 1.2 mm peak No. 7 is located on the southeastern side of radio shell between FIR-IV and V, in the region of the PDR G351.2+0.70 (Jackson & Kraemer (1999)). It is associated with a CO clump in the survey of Kraemer & Jackson (1999) (their Fig. 5). The dust emission peak No. 8 on the northwestern side of the dense molecular ridge is associated with the object called ’dust-cloudlet’ by Sandell (2000).
Assuming a uniform dust temperature of 30 K, we obtain from the SIMBA map a mass of 11 400 M☉ for the entire ridge. The share of its northern end with the cores I, I(N) and II is 5400 M☉, and for the regions III, IV, and V we get 900 M☉, 2200 M☉, and 1300 M☉, respectively.
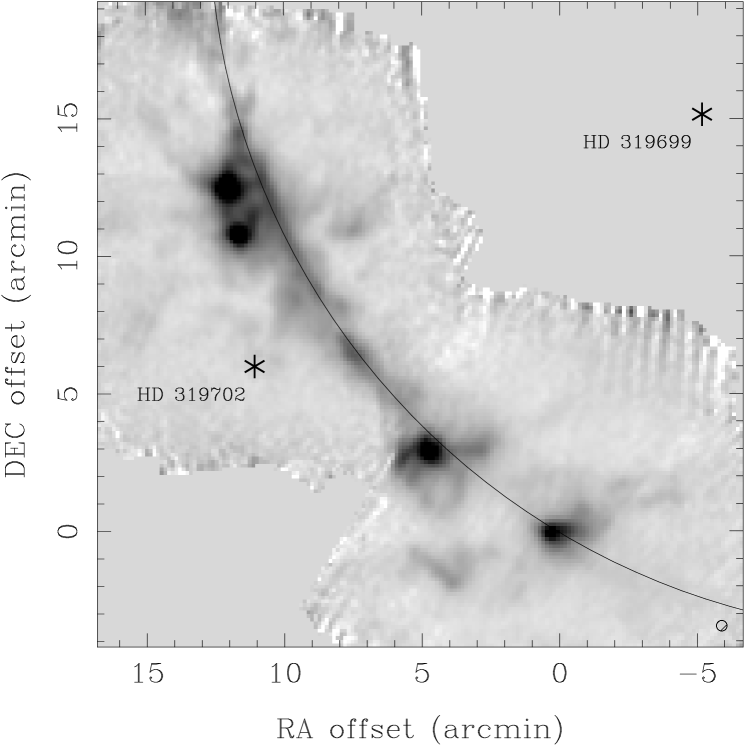
The main features of the 1.1 mm map of Sandell (2000) can be recognized on the present SIMBA map, despite a lower S/N available here. A careful inspection of the image reveals filaments reaching out from the dense ridge, bearing much likeness to the structures associated with OMC-1 discovered by Johnstone & Bally (1999) on a JCMT/SCUBA map. The suggestion of Johnstone & Bally (1999) that these features could represent the cavity walls of past outflows is appropriate also in this case. Filamentary structures are rather common features in GMCs forming high mass clusters, so there is no reason to consider them as artefacs of the data reduction.
The ’linear filament’ discussed by Sandell (2000) continues to the north and southwest and in fact the ridge is arc-shaped. In Fig. 6 an arc of a circle of radius (13 pc) and centred at R.A. , Dec. is superposed on the SIMBA map. The alignment evident in the figure suggests that the ridge has been formed by an expanding H ii region with its centre near the given position. This H ii region has probably been ionized by one or more of the matured OB stars in the region. The closest O-type star on the western side of the ridge is HD 319 699 (O7, distance 1.6 kpc). The UV radiation from this star is likely to dominate the excitation of the extended emission nebula in this direction. It seems, however, that the star has not been in the centre of the expansion, because it lies about southeast of the centre of the circle, and its proper motion vector (although very uncertain) points northwest (The Tycho-2 Catalogue; Høg et al. (2000)). The O-stars lying southeast and south of the ridge, HD 319 702 (O9, kpc), HD 319 703 (O6, kpc), and HD 156 738 (O7, kpc) are surrounded by separate, roundish ionization regions which probably have not contributed to shaping the ridge (see, e.g., Fig. 5 of Kraemer & Jackson (1999) or SkyView, http://skyview.gsfc.nasa.gov/).
5.3.3 G351.77-0.54
G351.77-0.54 is the brightest SiO line source of the sample (see Fig. 2). It is associated with the luminous steep-spectrum far-infared source IRAS 17233-3606, the strongest known ground-state OH maser source at 1665 MHz, other OH masers, and H2O and CH3OH masers (e.g., Caswell & Vaile (1995); MacLeod et al. (1998); Val’tts et al. (2000)). The kinematic distance derived using the LSR velocity from CH3CCH is 700 pc, which would make this source the nearest in our sample. The distance is smaller than the usually adopted value ( kpc), but it is close to the distance derived by MacLeod et al. (1998) (1.0 kpc) from the LSR velocity of the H2CO absorption. The neighbourhood of the source direction to that of the Galactic centre causes a large uncertainty to the kinematic distance estimate. Nevertheless, the proximity is supported by the intensity of the SiO emission, suggesting a large beam-filling factor.
5.3.4 W28 A2
G5.89-0.39 (also known as W28 A2) is one of the best-studied UC H ii regions, but probably it does not belong to the best understood. W28 A2 is associated with a highly energetic outflow, one of the most powerful ones in the Galaxy. Actually, in W28 A2 there might be multiple outflows and driving sources.
A bipolar outflow in the east-west direction with a mass of M☉ was identified by Harvey & Forveille (1988) in the lines of CO, 13CO, and C18O toward this source. C34S observations shows a north-south oriented outflow (Cesaroni et al. (1991)). There is growing evidence that the O5 star in G5.89 produced the N-S molecular outflow and hence is forming through accretion process (see Arce et al. (2006) and references therein). The SiO (, ) observations made with the VLA by Acord et al. (1997) shows a northeast-southwest bipolarity, which is confirmed by 1.3 mm continuum and several molecular line observations by Sollins et al. (2004). The 1.3 mm continuum source peaks in the centre of the H ii region (Sollins et al. (2004)). Moreover, NIR observations of the H2 rovibrational line and the Br emission show evidence of three outflows with distinct orientations and driving sources (Puga et al. (2006)). Puga et al. suggest that the northwest-southeast oriented outflow is possibly connected to the H2 knots seen in that direction. One of them (’knot B’), NW of W28 A2, can be identified in our SIMBA map. The two other features seen in our map, NW of knot B, at , , and , , could be related to NW-SE oriented outflow.
Thus it is unlikely that there exist a single central high-mass star in W28 A2 as was initially thought to be the case due to the symmetric morphology of H ii region.
The kinematic distance derived from H i observations towards the supernova remnant W28 by Velázquez et al. (2002) is 1.9 kpc. Adopting this value instead of 2.7 kpc derived by us, the mass of the cloud would decrease from 970M☉ to 480 M☉.
Thompson & Macdonald (1999) found rotational temperature of K from CH3CCH and observations and Gómez et al. (1991) derived the temperature of K from NH3(2, 2) and (3, 3) inversion transitions for the molecular envelope surrounding the UC H ii region. We have observed much lower CH3CCH transition , which trace the gas in outer layers and thus giving lower rotational temperature (34.6 K). The CH3CCH abundance estimate of by Thompson & Macdonald is an order of magnitude higher than our value of . NH3(3, 3), (4, 4), and (5, 5) observations by Acord et al. (1997) imply the kinetic temperature of around 100 K for the outflowing gas and they found the SiO abundance of in this gas, which is also an order of magnitude higher than the abundance estimate in the present study in the position of W28 A2 (2). These results support the idea that the CH3CCH and SiO abundances are are clearly larger in hot core than in the warm envelope.
5.3.5 W31
W31 is one of the largest H ii complexes in our Galaxy. G10.6-0.4 lying in the centre of our SIMBA map is one of the main extended H ii regions in this complex along with G10.2-0.3 and G10.3-0.1 (see, e.g., Corbel and Eikenberry (2004) and references therein). NH3(1, 1) and (3, 3) observations show that the molecular core in G10.6-0.4 is rotating and collapsing inward toward the UC H ii region where molecular masers are seen distributed in the following way: H2O and CH3OH masers linearly in the plane of rotation, and OH masers along the rotation axis (see, e.g., Sollins & Ho (2005) and references therein). Further evidence for collapse comes from two-peaked profile of CO(4-3) line observed with the APEX (Wyrowski et al. (2006)). Observations made with the VLA by Sollins & Ho (2005) suggest that there is a rotating molecular accretion flow which flattens but does not form an accretion disk. Velocities of molecular lines observed from the surrounding neutral gas in G10.6-0.4 suggest that accretion flow passes through the H ii region boundary and continues inward as an ionized flow (Keto (2002)). The associated infrared source (see Fig. 1), IRAS 18075-1956, has a luminosity of L☉ (Casoli et al. (1986)).
The distance of W31 is not well known. However, spectral types of O stars identified in W31 and the NIR photometry made by Blum et al. (2001) show that the distance to W31 must be kpc. Corbel and Eikenberry (2004) suggest that G10.6-0.4 is located on the km s-1 spiral arm at a distance from the Sun of kpc, which is consistent with the spectrophotometric distance obtained by Blum et al. We have used the value of 3.1 kpc which was derived by Blum et al. assuming that O star spectra are consistent with ZAMS. Note that Sollins & Ho (2005) and Sollins et al. (2005) adopt the kinematic distance of 6.0 kpc from Downes et al. (1980).
5.3.6 W33
The W33 complex is heavily obscured in the visual. It contains a compact radio core G12.8-0.2. The FIR sources W33 A (G12.91-0.26) and W33 B (G12.70-0.17) associated with OH/H2O masers lie on the opposite sides of G12.8-0.2 (Capps et al. (1978); Stier et al. (1984)).
IR and radio continuum observations have revealed a cluster of compact sources in the region of G12.8-0.2 (Dyck & Simon (1977); Haschick & Ho (1983)). The total IR luminosity of G12.81-0.19 assuming a distance of 3.7 kpc is L☉ (Stier et al. (1984)). According to the results of Stier et al. the minimum mass of the star associated with the radio core is 20 M☉. G12.8-0.2 is considered as a good candidate for a very young OB cluster (see, e.g., Beck et al. (1998)).
6 Summary and conclusions
Spectral line observations at 3 and 2 mm, and dust continuum observations at 1.2 mm performed with the SEST were used to derive physical characteristics and fractional SiO and CH3CCH abundances in 15 high-mass star-forming cores. The sample represents typical GMC cores with the following average properties K, , and . While most cores seem to be near the virial equilibrium, for five of them the gravitational potential energy is large compared with the kinetic energy.
The fractional SiO abundances determined from the velocity range with detectable CH3CCH emission were found to be . CH3CCH abundances were found to be . In consistence with earlier results towards GMC cores (e.g., Ungerechts et al. (1997); Bergin et al. (1997)) the CH3CCH abundance is found to be clearly larger than in the dense cores of dark clouds. It also shows a slight increase as a function of . As this tendency does not agree with the predictions of gas-phase chemistry models (e.g. Lee et al. (1996)), a possible explanation is that warm conditions lead to an intensified desorption of the precursor molecules of CH3CCH from the icy mantles of dust grains. This suggestion is supported by the chemistry model of Canosa et al. (1997).
The SiO abundances are midway between the upper limit from dark clouds and PDRs () and the values derived for powerful shocks (). The abundance seem to decrease with rising temperature. This finding contradicts with the models where SiO production is dominated by neutral reactions with activation energies (Ziurys et al. (1989); Langer & Glassgold (1990)), and with models where desorption of Si-containing species from grain mantles are significant for the SiO production (MacKay (1996)). As suggested by the recent observational results of Fuente et al. (2005), warmer cores represent more evolved objects where highly energetic protostellar outlows releasing SiO into the gas phase are less frequent; this together with the rapid post-shock processing have lead to a diminished SiO abundance.
Acknowledgements.
We thank the referee for a careful and critical reading of the manuscript and for very helpful comments and suggestions. The work has been supported by the Academy of Finland through grants Nos. 1201269 and 1210518. We acknowledge the use of the SIMBAD database, operated at CDS, Strasbourg, France, and the NASA’s SkyView facility (http://skyview.gsfc.nasa.gov) located at NASA Goddard Space Flight Center.References
- Acord et al. (1997) Acord, J. M., Walmsley, C. M., & Churchwell, E. 1997, ApJ, 475, 693
- Alakoz et al. (2002) Alakoz, A. V., Kalenskii, S. V., Promislov, V. G., Johansson, L. E. B., and Winnberg, A. 2002, ARep, 46, 551
- Anderson et al. (1999) Anderson, I. M., Caselli, P., Haikala, L. K., and Harju, J. 1999, A&A, 347, 983
- Arce et al. (2006) Arce, H. G., et al. 2006, in Protostars and Planets V, (Reipurth, B., et al. eds.), Univ. of Arizona, Tuscon
- Askne et al. (1984) Askne, J., Höglund, B., Hjalmarson, Å., & Irwine, W. M. 1984, A&A, 130, 311
- Bachiller et al. (1991) Bachiller, R., Martin-Pintado, J., Fuente, A. 1991, A&A, 243, 21
- Bauer et al. (1979) Bauer, A., Boucher, D., Burie, J., Demaison, J. & Dubrulle, A. 1979, JPCRD, 8, 537
- Beck et al. (1998) Beck, S. C., Kelly, D. M., and Lacy, J. H. 1998, 115, 2504
- Bergin et al. (1994) Bergin, E. A., Goldsmith, P. F., Snell, R. L., & Ungerechts, H. 1994, ApJ, 431, 674
- Bergin et al. (1997) Bergin, E. A., Goldsmith, P. F., Snell, R. L., and Langer, W. D. 1997, ApJ, 482, 285
- Blum et al. (2001) Blum, R. D., Damineli, A., and Conti, P. S. 2001, AJ, 121, 3149
- Brand & Blitz (1993) Brand, J., and Blitz, L. 1993, A&A, 275, 67
- Brand et al. (1994) Brand, J., Cesaroni, R., Caselli, P. et al. 1994, A&AS, 103, 541
- Braz & Epchtein (1983) Braz, M. A., & Epchtein, N. 1983, A&AS, 54, 167
- Bronfman et al. (1996) Bronfman, L., Nyman, L-Å., & May, J. 1996, A&AS, 115, 81
- Brooks & Whiteoak (2001) Brooks, K. J., Whiteoak, J. B. 2001, MNRAS, 320, 465
- Burrell et al. (1980) Burrell, P. M., Bjarnov, E., and Schwendeman, R. H. 1980, J. Mol. Spectrosc., 82, 193
- Canosa et al. (1997) Canosa, A., Sims, I. R., Travers, D., Smith, I. W. M., and Rowe, B. R. 1997, A&A, 323, 644
- Capps et al. (1978) Capps, R. W., Gillett, F. C., Knacke, R. F. ApJ, 226, 863
- Caselli et al. (1997) Caselli, P., Hartquist, T. W., Havnes, O. 1997, A&A, 322, 296
- Casoli et al. (1986) Casoli, F., Combes, F., Dupraz, C., Gerin., M., & Boulanger, F. 1986, A&A, 169, 281
- Caswell (1998) Caswell, J. L. 1998, MNRAS, 297, 215
- Caswell et al. (1989) Caswell, J. L., Batchelor, R. A., Forster, J. R., and Wellington, K. J. 1989, Australian J. Phys., 42, 33
- Caswell & Haynes (1983) Caswell, J. L., & Haynes, R. F. 1983, Australian J. Phys., 36, 361
- Caswell et al. (1981) Caswell, J. L., Haynes, R. F., Goss, W. M., and Mebold, U. 1981, Australian J. Phys., 34, 333
- Caswell & Vaile (1995) Caswell, J. L., Vaile, R. A. 1995, MNRAS, 273, 328
- Caswell et al. (1995) Caswell, J. L., Vaile, R. A., Ellingsen, S. P., Whiteoak, J. B., and Norris, R. P. 1995, MNRAS, 272, 96
- Caswell (2000) Caswell, J. L., Yi, Jiyune, Booth, R. S., and Cragg, D. M. 2000, MNRAS, 313, 599
- Cesaroni et al. (1991) Cesaroni, R., Walmsley, C. M., Kömpe, C., & Churchwell, E. 1991, A&A, 252, 278
- Chini et al. (2003) Chini, R., Kämpgen, K., Reipurth, B., et al. 2003, A&A, 409, 235
- Codella et al. (1999) Codella, C., Bachiller, R., and Reipurth, B. 1999, A&A, 343, 585
- Cohen et al. (1988) Cohen, R. J., Baart, E. E., & Jonas, J. L. 1988, MNRAS, 231, 205
- Comoretto et al. (1990) Comoretto, G., Palagi, F., Cesaroni, L. et al. 1990, A&AS, 84, 179
- Corbel and Eikenberry (2004) Corbel, S., and Eikenberry, S. S. 2004, A&A, 419, 191
- Downes et al. (1980) Downes, D., Wilson, T. L., Bieging, J., and Wink, J. 1980, A&AS, 40, 379
- Dyck & Simon (1977) Dyck, H. M., & Simon, M. 1977, ApJ, 211, 421
- Evans II (1999) Evans II, N. J. 1999, ARA&A, 37, 311
- Faúndez et al. (2004) Faúndez, S., Bronfman, L., Garay, G., Chini, R., Nyman, L-Å., and May, J. 2004, A&A, 426, 97
- Fontani et al. (2002) Fontani, F., Cesaroni, R., Caselli, P., and Olmi, L. 2002, A&A, 389, 603
- Fontani et al. (2005) Fontani, F., Beltrán, M. T., Brand, J., Cesaroni, R., Testi, L., Molinari, S., and Walmsley, C. M. 2005, A&A, 432, 921
- Fuente et al. (2005) Fuente, A., Rizzo, J. R., Caselli, P., and Henkel, C. 2005, A&A, 433, 535
- Garay & Lizano (1999) Garay, G., and Lizano, S. 1999, PASP, 111, 1049
- Gaume & Mutel (1987) Gaume, R. A., & Mutel, R. A. 1987, A&AS, 65, 193
- Gezari (1982) Gezari, D. Y. 1982, ApJ, 259, L29
- Gibb et al. (2004) Gibb, A. G., Richer, J. S., Chandler, C. J., and Davis, C. J. 2004, ApJ, 603, 198
- Goldsmith & Langer (1999) Goldsmith, P. F., & Langer, W. D. 1999, ApJ, 517, 209
- Gómez et al. (1991) Gómez, Y., Rodríquez, L. F., Garay, G., and Moran, J. M. 1991, ApJ, 377, 519
- Greaves et al. (1996) Greaves, J. S., Ohishi, M., Nyman, L-Å. 1996, A&A, 307, 898
- Harju et al. (1998) Harju, J., Lehtinen, K., Booth, R. S., & Zinchenko, I. 1998, A&AS, 132, 211
- Harvey & Forveille (1988) Harvey, P. M., & Forveille, T. 1988, A&A, 197, L19
- Haschick & Ho (1983) Haschick, A., & Ho, P. T. P. 1983, ApJ, 267, 638
- Hatchell et al. (1998) Hatchell, J., Thompson, M. A., Millar, T. J., and Macdonald, G. H. 1998, A&AS, 133, 29
- Hatchell et al. (2001) Hatchell, J., Fuller, G. A., & Millar, T. J. 2001, A&A, 372, 281
- Henning et al. (2000) Henning, Th., Lapinov, A., Schreyer, K., Stecklum, B., and Zinchenko, I. 2000, A&A, 364, 613
- Hill et al. (2005) Hill, T., Burton, M. G., Minier, V., Thompson, M. A., Walsh, A. J., Hunt-Cunningham, M., and Garay, G. 2005, MNRAS, 363, 405
- Høg et al. (2000) Høg, E., Fabricius, C., Makarov, V. V., et al. 2000, A&A355, L27
- Jackson & Kraemer (1999) Jackson, J. M., and Kraemer, K. E. 1999, ApJ, 512, 260
- Johnstone & Bally (1999) Johnstone, D., Bally, J. 1999, ApJ, 510, L49
- Kontinen et al. (2000) Kontinen, S., Harju, J., Heikkilä, A., Haikala, L. K. 2000, A&A, 361, 704
- Keto (2002) Keto, E. 2002, ApJ, 568, 754
- Kraemer & Jackson (1999) Kraemer, K. E., and Jackson, J. M. 1999, ApJS, 124, 439
- Kraemer et al. (1999) Kraemer, K. E., Deutsch, L. K., Jackson, J. M., et al. 1999, ApJ, 516, 817
- Kuiper et al. (1984) Kuiper, T. B. H., Kuiper, E. N. R., and Dickinson, D. F. 1984, ApJ, 276, 211
- Langer & Glassgold (1990) Langer, W. D., and Glassgold, A. E. 1990, ApJ, 352, 123
- Lee et al. (1996) Lee, H. H., Bettens, R. P. A., Herbst, E. 1996, ApJS, 119, 111
- Lee et al. (2004) Lee, J-E., Bergin, E. A., and Evans II, N. J. 2004, ApJ, 617, 360
- Lefloch et al. (1998) Lefloch, B., Castets, A., Cernicharo, J., Loinard L. 1998, ApJ, 504, L109
- MacKay (1995) MacKay, D. D. S. 1995, MNRAS, 274, 694
- MacKay (1996) MacKay, D. D. S. 1996, MNRAS, 278, 62
- MacLeod et al. (1998) MacLeod, G. C., Scalise, E., Saedt, S., Galt, J. A., Gaylard, M. J. 1998, AJ, 116, 1897
- Markwick et al. (2005) Markwick, A. J., Charnley, S. B., Butner, H. M., Millar, T. J. 2005, ApJ, 627, L117
- Martín-Pintado et al. (1992) Martín-Pintado, J., Bachiller, R., & Fuente, A. 1992, A&A, 254, 315
- McBreen et al. (1979) McBreen, B., Fazio, G. G., Steir, M., and Wright, E. L. 1979, ApJ, 232, L183
- McCutcheon et al. (2000) McCutcheon, W. H., Sandell, G., Matthews, H. E., et al. 2000, MNRAS, 316, 152
- Moran & Rodriquez (1980) Moran, J., & Rodriquez, L. 1980, ApJ, 236, L159
- Neckel (1978) Neckel, T. 1978, A&A, 69, 51
- Ossenkopf & Henning (1994) Ossenkopf, V., and Henning, T. 1994, A&A, 291, 943
- Osterloh et al. (1997) Osterloh, M., Henning, Th., & Launhardt, R. 1997, ApJS, 110, 71
- Palagi et al. (1993) Palagi, F., Cesaroni, R., Comoretto, G., Felli, M., & Natale, V. 1993, A&AS, 101, 153
- Penzias (1981) Penzias, A. A. 1981, ApJ, 249, 513
- Pineau des Forêts et al. (1997) Pineau des Forêts, G., Flower, D. R., and Chièze, J.-P. 1997, IAUS, 182, 199
- Puga et al. (2006) Puga, E., et al. 2006, ApJ, 641, 373
- Raga and Cabrit (1993) Raga, A., and Cabrit, S. 1993, A&A, 278, 267
- Rodríguez et al. (1982) Rodríguez, L. F., Cantó, J., and Moran, J. M. 1982, ApJ, 255, 103
- Sandell (2000) Sandell, G. 2000, A&A, 358, 242
- Sarma et al. (2000) Sarma, A. P., Troland, T. H., Roberts, D. A, and Crutcher, R. M. 2000, ApJ, 533, 271
- Scalise et al. (1989) Scalise, E. Jr., Rodríguez, L. F., Medoza-Torres, E. 1989, A&A, 221, 105
- Schilke et al. (2001) Schilke, P., Pineau des Fôrets, G., Walmsley, C. M., Martín-Pintado, J. 2001, A&A, 372, 291
- Schilke et al. (1997) Schilke, P., Walmsley, C. M., Pineau des Forêts, & Flower, D. R. 1997, A&A, 321, 293
- Shepherd et al. (2004) Shepherd, D. S., Kurtz, S. E., Testi, L. 2004, ApJ, 601, 952
- Sollins et al. (2004) Sollins, P. K., et al. 2004, ApJ, 616, L35
- Sollins & Ho (2005) Sollins, P. K., & Ho, P. T. P. 2005, ApJ, 630, 987
- Sollins et al. (2005) Sollins, P. K., Zhang, Q., Keto, E., and Ho, P. T. P. 2005, A&A, 624, L49
- Stier et al. (1984) Stier, M. T., et al. 1984, ApJ, 283, 573
- Takahashi et al. (1983) Takahashi, T., Hollenbach, D. J., and Silk, D. 1983, ApJ, 275, 145
- Thompson and Macdonald (1999) Thompson, M. A., and Macdonald, G. H. 2003, A&AS, 135, 531
- Thompson and Macdonald (2003) Thompson, M. A., and Macdonald, G. H. 2003, A&A, 407, 237
- Ungerechts et al. (1997) Ungerechts, H., Bergin, E. A., Goldsmith, P. F., et al. 1997, ApJ, 482, 245
- Val’tts et al. (2000) Val’tts, I. E., Ellingsen, S. P., Slysh, V. I., et al. 2000, MNRAS, 317, 315
- Velázquez et al. (2002) Velázquez, P. F., Dubner, G. M., Goss, W. M., & Green, A. J. 2002, AJ, 124, 2145
- Walsh et al. (1998) Walsh, A. J., Burton, M. G., Hyland, A. R., Robinson, G. 1998, MNRAS, 301, 640
- Wyrowski et al. (2006) Wyrowski, F., Heyminck, S., Güsten, R., Menten, K. M. 2006, A&A, 454, L95
- Zinchenko et al. (1995) Zinchenko, I., Mattila, K., & Toriseva, M. 1995, A&AS, 111, 95
- Ziurys et al. (1989) Ziurys, L. M., Friberg, P., & Irvine, W. M. 1989, ApJ, 343, 201
| Molecule | Transition | [MHz] | [K] |
|---|---|---|---|
| 29SiO | 85759.0000 | 6.195 | |
| 28SiO | 86846.9600 | 6.252 | |
| 29SiO | 128636.7064 | 12.390 | |
| 28SiO | 130268.6100 | 12.504 | |
| CH3CCH | 85457.2720 | 12.304 | |
| CH3CCH | 85455.6220 | 19.505 | |
| CH3CCH | 85450.7300 | 41.107 | |
| CH3CCH | 85442.5280 | 77.112 | |
| CH3CCH | 102547.9842 | 17.225 | |
| CH3CCH | 102546.0241 | 24.426 | |
| CH3CCH | 102540.1447 | 46.029 | |
| CH3CCH | 102530.3487 | 82.033 |
| Source | , | notes | |||||
|---|---|---|---|---|---|---|---|
| [h:m:s] | [::] | [] | [kpc] | [kpc] | [km s-1] | ||
| IRAS 12326-6245 | 12:35:34.1 | -63:02:28 | 301.13-0.22 | 4.4a | 7.1 | -39.5 | OHA/H2OB/CH3OHC/UC H iiD,E |
| G326.64+0.61 | 15:44:32.3 | -54:05:54 | 326.64+0.61 | 2.7 | 6.4 | -39.8 | H2OF |
| OH328.81+0.63 | 15:55:47.3 | -52:43:08 | 328.81+0.63 | 2.9 | 6.2 | -41.7 | OHF/CH3OHG/UC H iiH |
| IRAS 15566-5304 | 16:00:30.7 | -53:12:34 | 329.03-0.20 | 3.0 | 6.2 | -43.6 | OHI/H2OJ/CH3OHG |
| G330.95-0.19 | 16:09:52.2 | -51:55:20 | 330.95-0.19 | 6.1 | 4.3 | -100.0 | OHH/H2OF |
| G345.01+1.8N | 16:56:47.2 | -40:14:09 | 345.01+1.80 | 1.7 | 6.9 | -13.8 | OHK/H2OF/CH3OHG/UC H iiH |
| IRAS 16562-3959 | 16:59:41.9 | -40:03:42 | 345.49+1.47 | 1.6 | 7.0 | -12.2 | OHH/UC H iiD |
| G345.00-0.23 | 17:05:11.7 | -41:29:11 | 345.00-0.23 | 2.9 | 5.7 | -27.7 | OHK/H2OF/CH3OHG |
| NGC 6334 FIR-V | 17:19:55.9 | -35:57:45 | 351.16+0.70 | 1.7b | 7.2 | -6.6 | OHK/H2OF |
| NGC 6334F | 17:20:53.5 | -35:47:01 | 351.42+0.65 | 1.7b | 7.1 | -7.0 | OHL/H2OF/CH3OHG/UC H ii H |
| G351.77-0.54 | 17:26:42.6 | -36:09:17 | 351.77-0.54 | 0.7 | 7.8 | -3.2 | OHK/H2OF/CH3OHG/UC H iiH |
| G353.41-0.36 | 17:30:26.0 | -34:41:57 | 353.41-0.36 | 3.5 | 5.1 | -16.8 | OHM,K/H2OF/CH3OHF/UC H iiH |
| W28 A2(2) | 18:00:30.4 | -24:04:00 | 5.88-0.39 | 2.7 | 2.4 | 6.1 | OHH/H2ON/UC H iiH |
| W31 (2) | 18:10:28.7 | -19:55:50 | 10.62-0.38 | 3.1c | 5.5 | -2.8 | OHH/H2ON/UC H iiH |
| W33 CONT | 18:14:13.6 | -17:55:25 | 12.81-0.20 | 3.7 | 4.9 | 34.8 | H2ON |
References: A Cohen et al. (1988); B Caswell et al. (1989); C Caswell et al. (1995); D Bronfman et al. (1996); E Zinchenko et al. (1995); F The catalog of non-stellar H2O/OH masers (Braz & Epchtein (1983)); G Caswell (2000); H Caswell (1998); I Caswell et al. (1995); J Scalise et al. (1989); K Caswell & Haynes (1983); L Moran & Rodriquez (1980); Gaume & Mutel (1987); M Caswell et al. (1981); N Arcetri Atlas of galactic H2O masers (Comoretto et al. (1990); Palagi et al. (1993); Brand et al. (1994)). Distance references: a Zinchenko et al. (1995); Osterloh et al. (1997); b Neckel (1978); c Blum et al. (2001). When no reference is given, the distance is a kinematic distance calculated from the CH3CCH velocities.
| Source | peak No. | [MJy/sterad] | ||
|---|---|---|---|---|
| IRAS 12326-6245 | 12:35:34.7 | -63:02:40 | 546 | |
| G326.64+0.61 | 1 | 15:44:43.2 | -54:05:46 | 226 |
| 2 | 15:44:33.2 | -54:05:22 | 201 | |
| 3 | 15:44:59.5 | -54:02:26 | 197 | |
| 4 | 15:44:56.9 | -54:07:14 | 101 | |
| 5 | 15:45:01.4 | -54:09:14 | 63 | |
| OH328.81+0.63 | 15:55:48.6 | -52:43:04 | 419 | |
| IRAS 15566-5304 | 16:00:31.1 | -53:12:38 | 166 | |
| G330.95-0.19 | 1 | 16:09:53.1 | -51:54:52 | 995 |
| 2 | 16:10:17.3 | -51:58:44 | 36 | |
| G345.01+1.8N | 1 | 16:56:47.2 | -40:14:21 | 303 |
| 2 | 16:56:40.9 | -40:13:17 | 151 | |
| 3 | 16:56:43.7 | -40:15:57 | 65 | |
| 4 | 16:56:52.1 | -40:17:01 | 44 | |
| IRAS 16562-3959 | 1 | 16:59:41.7 | -40:03:34 | 401 |
| 2 | 16:59:28.5 | -40:10:06 | 131 | |
| 3 | 16:59:06.9 | -40:05:50 | 49 | |
| G345.00-0.23 | 17:05:11.0 | -41:28:59 | 372 | |
| NGC 6334 | 1 | 17:20:53.4 | -35:46:58 | 1150 |
| 2 | 17:20:55.4 | -35:45:06 | 850 | |
| 3 | 17:20:19.3 | -35:54:51 | 519 | |
| 4 | 17:19:57.5 | -35:57:47 | 447 | |
| 5 | 17:20:32.4 | -35:51:23 | 147 | |
| 6 | 17:20:42.9 | -35:49:14 | 81 | |
| 7 | 17:20:15.3 | -35:59:39 | 61 | |
| 8 | 17:20:33.0 | -35:46:51 | 59 | |
| G351.77-0.54 | 1 | 17:26:42.9 | -36:09:17 | 1007 |
| 2 | 17:26:39.0 | -36:08:05 | 114 | |
| 3 | 17:26:47.6 | -36:12:05 | 82 | |
| 4 | 17:26:25.8 | -36:04:45 | 55 | |
| G353.41-0.36 | 17:30:26.7 | -34:41:45 | 487 | |
| W28 A2(2) | 1 | 18:00:30.4 | -24:04:00 | 626 |
| 2 | 18:00:40.9 | -24:04:16 | 205 | |
| 3 | 18:00:15.2 | -24:01:20 | 40 | |
| W31 (2) | 1 | 18:10:28.7 | -19:55:50 | 690 |
| 2 | 18:10:18.5 | -19:54:22 | 60 | |
| W33 CONT | 1 | 18:14:13.9 | -17:55:41 | 1071 |
| 2 | 18:14:39.7 | -17:52:05 | 172 | |
| 3 | 18:13:54.8 | -18:01:49 | 119 | |
| 4 | 18:14:36.3 | -17:55:01 | 57 | |
| 5 | 18:14:25.7 | -17:53:57 | 53 | |
| 6 | 18:14:07.7 | -18:00:37 | 48 |
| Source | [MJy/sterad] | [Jy] | [] |
|---|---|---|---|
| IRAS 12326-6245 | 134 | 12.8 | 13 |
| G326.64+0.61 | 98 | 10.9 | 27 |
| OH328.81+0.63 | 136 | 14.6 | 22 |
| IRAS 15566-5304 | 74 | 7.8 | 34 |
| G330.95-0.19 | 154 | 22.8 | 13 |
| G345.01+1.8N | 154 | 16.4 | 47 |
| IRAS 16562-3959 | 185 | 19.1 | 36 |
| G345.00-0.23 | 110 | 11.4 | 19 |
| NGC 6334 FIR-V | 189 | 19.4 | 39 |
| NGC 6334F | 360 | 34.7 | 16 |
| G351.77-0.54 | 289 | 27.5 | 17 |
| G353.41-0.36 | 197 | 22.6 | 33 |
| W28 A2(2) | 163 | 15.5 | 15 |
| W31 (2) | 198 | 19.1 | 89 |
| W33 CONT | 395 | 41.1 | 32 |
| Source | [K] | |||
|---|---|---|---|---|
| G326.64+0.61 | 3.0 0.4 | 2.5 0.7 | 5.2 1.7 | 2 |
| OH 328.81+0.63 | 2.1 0.2 | 2.1 0.2 | 4.8 0.4 | 10 |
| IRAS 15566-5304 | 3.8 0.4 | 2.6 0.6 | 4.7 0.6 | 5 |
| G345.01+1.8N | 1.5 0.3 | 1.3 0.4 | 5.3 2.7 | 1 |
| G345.00-0.23 | 2.2 0.3 | 1.5 0.3 | 4.6 0.7 | 6 |
| NGC 6334 FIR-V | 1.7 0.4 | 1.1 0.3 | 4.1 1.6 | 1 |
| NGC 6334F | 2.3 0.3 | 1.2 0.4 | 3.4 0.7 | 3 |
| G351.78-0.54 | 1.9 0.2 | 1.7 0.1 | 4.2 0.2 | 13 |
| G353.41-0.36 | 2.2 0.2 | 2.0 0.3 | 6.1 1.1 | 5 |
| W28 A2(2) | 2.4 0.6 | 2.0 0.5 | 5.2 1.7 | 3 |
| W31 (2) | 2.9 0.4 | 2.9 0.4 | 4.0 0.4 | 6 |
| W33 CONT | 2.7 0.7 | 3.0 0.6 | 7.2 5.1 | 1 |
| Line centre | Whole line | ||||||||
|---|---|---|---|---|---|---|---|---|---|
| Source | Line | ||||||||
| [km s-1] | [km s-1] | [km s-1] | [Kkm s-1] | [km s-1] | [km s-1] | [Kkm s-1] | |||
| IRAS 12326-6245 | -41.8 | -37.2 | -38.4 | 0.10(0.01) | -49.3 | -35.0 | 0.20(0.02) | ||
| -40.0 | 0.23(0.02) | -48.4 | -32.0 | 0.40(0.03) | |||||
| G326.64+0.61 | -42.2 | -37.7 | -40.7 | 0.26(0.01) | -46.1 | -33.6 | 0.47(0.02) | ||
| -41.0 | 0.17(0.02) | -45.5 | -33.6 | 0.31(0.03) | |||||
| OH328.81+0.63 | -44.6 | -38.3 | -41.9 | 0.51(0.01) | -55.3 | -24.9 | 0.99(0.03) | ||
| -42.5 | 0.60(0.02) | -49.6 | -31.4 | 1.07(0.03) | |||||
| IRAS 15566-5304 | -46.2 | -41.0 | -45.8 | 0.41(0.01) | -53.1 | -33.4 | 0.85(0.03) | ||
| -44.6 | 0.26(0.02) | -50.1 | -36.7 | 0.50(0.03) | |||||
| G330.95-0.19 | -92.7 | -88.7 | -91.6 | 0.16(0.01) | -99.6 | -80.5 | 0.37(0.03) | ||
| -88.4 | 0.13(0.02) | -97.5 | -85.0 | 0.20(0.03) | |||||
| G345.01+1.8N | -16.8 | -10.6 | -16.4 | 0.31(0.02) | -23.5 | -6.5 | 0.50(0.03) | ||
| -17.3 | 0.24(0.02) | -21.1 | -7.4 | 0.39(0.03) | |||||
| IRAS 16562-3959 | -14.9 | -8.7 | -12.2 | 0.21(0.02) | -19.1 | -0.7 | 0.35(0.03) | ||
| -11.3 | 0.27(0.02) | -21.8 | -2.4 | 0.62(0.03) | |||||
| G345.00-0.23 | -29.7 | -22.4 | -28.2 | 0.43(0.02) | -40.4 | -13.9 | 0.88(0.03) | ||
| -26.9 | 0.48(0.02) | -40.7 | -11.2 | 1.09(0.04) | |||||
| NGC 6334 FIR-V | -9.3 | -2.9 | -6.7 | 0.23(0.02) | -20.7 | -3.7 | 0.51(0.03) | ||
| -7.0 | 0.29(0.02) | -17.7 | 1.4 | 0.56(0.03) | |||||
| NGC 6334F | -8.5 | -2.7 | -8.8 | 0.22(0.01) | -11.1 | -2.5 | 0.34(0.01) | ||
| -10.1 | 0.20(0.01) | -13.8 | -0.1 | 0.37(0.02) | |||||
| G351.77-0.54 | -5.1 | 0.8 | -3.9 | 0.72(0.01) | -19.0 | 11.0 | 1.85(0.03) | ||
| -3.7 | 0.91(0.02) | -17.8 | 11.0 | 2.29(0.03) | |||||
| G353.41-0.36 | -19.7 | -13.6 | -16.7 | 0.39(0.01) | -24.7 | -6.2 | 0.66(0.02) | ||
| -17.1 | 0.30(0.01) | -21.7 | -9.2 | 0.42(0.02) | |||||
| W28 A2(2) | 6.5 | 12.8 | 10.2 | 0.23(0.02) | -2.5 | 26.6 | 0.69(0.04) | ||
| 11.9 | 0.35(0.02) | 0.1 | 37.9 | 1.34(0.05) | |||||
| W31 (2) | -5.2 | 1.6 | -4.5 | 0.39(0.02) | -12.8 | 7.2 | 0.68(0.03) | ||
| -2.1 | 0.41(0.02) | -12.5 | 5.7 | 0.67(0.03) | |||||
| W33 CONT | 31.9 | 39.2 | 35.0 | 0.24(0.02) | 28.9 | 48.0 | 0.33(0.03) | ||
| 35.4 | 0.28(0.02) | 27.1 | 47.7 | 0.48(0.03) |
| Source | [km s-1] | [km s-1] | [Kkm s-1] | |||
|---|---|---|---|---|---|---|
| K=0 | K=1 | K=2 | K=3 | |||
| IRAS 12326-6245 | -39.54(0.04) | 3.68(0.02) | 0.69(0.02) | 0.58(0.02) | 0.29(0.02) | 0.13(0.02) |
| G326.64+0.61 | -39.76(0.02) | 3.35(0.02) | 1.41(0.02) | 1.10(0.02) | 0.47(0.02) | 0.19(0.02) |
| OH328.81+0.63 | -41.72(0.01) | 3.07(0.02) | 1.89(0.02) | 1.57(0.02) | 0.63(0.01) | 0.30(0.01) |
| IRAS 15566-5304 | -43.64(0.03) | 3.73(0.03) | 0.95(0.03) | 0.77(0.03) | 0.31(0.03) | 0.11(0.02) |
| G330.95-0.19 | -90.95(0.05) | 5.42(0.06) | 1.31(0.02) | 1.00(0.02) | 0.54(0.02) | 0.21(0.02) |
| G345.01+1.8N | -13.78(0.02) | 3.60(0.02) | 1.23(0.02) | 0.96(0.02) | 0.48(0.01) | 0.24(0.01) |
| IRAS 16562-3959 | -12.17(0.01) | 3.65(0.01) | 4.92(0.02) | 4.16(0.02) | 1.92(0.02) | 1.06(0.001) |
| G345.00-0.23 | -27.69(0.04) | 5.56(0.05) | 1.53(0.02) | 1.36(0.02) | 0.46(0.02) | 0.26(0.02) |
| NGC 6334 FIR-V | -6.63(0.01) | 3.45(0.01) | 2.08(0.02) | 1.61(0.02) | 0.76(0.02) | 0.39(0.02) |
| NGC 6334F | -7.00(0.03) | 5.08(0.03) | 2.17(0.02) | 1.65(0.02) | 0.83(0.02) | 0.45(0.02) |
| G351.77-0.54 | -3.16(0.02) | 4.88(0.02) | 3.10(0.03) | 2.56(0.02) | 1.13(0.02) | 0.62(0.02) |
| G353.41-0.36 | -16.78(0.02) | 4.02(0.02) | 1.89(0.02) | 1.57(0.02) | 0.58(0.02) | 0.19(0.02) |
| W28 A2(2) | 8.88(0.01) | 3.65(0.01) | 3.73(0.02) | 3.21(0.02) | 1.51(0.02) | 0.76(0.02) |
| W31 (2) | -2.78(0.03) | 5.00(0.03) | 2.08(0.02) | 1.76(0.02) | 0.81(0.02) | 0.43(0.02) |
| W33 CONT | 34.80(0.01) | 3.79(0.01) | 4.20(0.02) | 3.77(0.02) | 1.77(0.02) | 1.05(0.02) |
| Source | ||||||
|---|---|---|---|---|---|---|
| [K] | [] | [] | [] | [] | [] | |
| IRAS 12326-6245a | 34.0 | 6.4 | 2.0 | 3.1 | 0.8 | 1.3 |
| G326.64+0.61 | 29.0 | 5.7 | 3.4 | 6.0 | 2.0 | 3.5 |
| OH328.81+0.63 | 30.5 | 7.4 | 4.9 | 6.6 | 3.8 | 5.1 |
| IRAS 15566-5304 | 27.2 | 4.7 | 2.2 | 4.7 | 3.1 | 6.6 |
| G330.95-0.19 | 31.9 | 8.0 | 3.5 | 4.4 | 1.2 | 1.5 |
| G345.01+1.8N | 34.5 | 7.3 | 3.5 | 4.8 | 2.3 | 3.2 |
| IRAS 16562-3959 | 35.9 | 8.3 | 15.0 | 18.0 | 1.6 | 1.9 |
| G345.00-0.23 | 30.6 | 6.0 | 4.0 | 6.7 | 3.3 | 5.5 |
| NGC 6334 FIR-V | 33.6 | 9.2 | 5.8 | 6.3 | 1.8 | 2.0 |
| NGC 6334F | 35.8 | 16.3 | 6.3 | 3.9 | 1.6 | 1.0 |
| G351.77-0.54 | 34.4 | 13.7 | 8.9 | 6.5 | 5.5 | 4.0 |
| G353.41-0.36 | 25.2 | 13.7 | 4.2 | 3.1 | 3.0 | 2.2 |
| W28 A2(2) | 34.6 | 7.7 | 11.2 | 14.6 | 1.7 | 2.2 |
| W31 (2) | 35.0 | 9.2 | 6.2 | 6.8 | 2.9 | 3.2 |
| W33 CONT | 38.6 | 16.4 | 14.3 | 8.7 | 1.8 | 1.1 |
aThe rotational temperature and CH3CCH column density derived from the line are 37.2 K and , respectively.
| Source | ||||
|---|---|---|---|---|
| [pc] | [M☉] | [M☉] | [cm-3] | |
| IRAS 12326-6245 | 0.1 | 2200 | 410 | |
| G326.64+0.61 | 0.2 | 850 | 430 | |
| OH328.81+0.63 | 0.2 | 1200 | 320 | |
| IRAS 15566-5304 | 0.2 | 810 | 740 | |
| G330.95-0.19 | 0.2 | 8100 | 1200 | |
| G345.01+1.8N | 0.1 | 410 | 550 | |
| IRAS 16562-3959 | 0.1 | 400 | 400 | |
| G345.00-0.23 | 0.1 | 960 | 870 | |
| NGC 6334 FIR-V | 0.2 | 500 | 420 | |
| NGC 6334F | 0.1 | 830 | 360 | |
| G351.77-0.54 | 0.03 | 120 | 150 | |
| G353.41-0.36 | 0.3 | 3500 | 960 | |
| W28 A2(2) | 0.1 | 970 | - | |
| W31 (2) | 0.7 | 1600 | 3500 | |
| W33 CONT | 0.3 | 4300 | 900 |