High-resolution observations of water masers in Bok globules
Abstract
We present Very Large Array observations at 1.3 cm of several water maser detections obtained by previous single-dish studies of Bok globules in the Clemens & Barvainis (1988; CB) catalog. We report water maser emission in CB 3 (CB3-mm), CB 54 (IRAS 070201618), CB 101 (IRAS 175030833), and CB 232 (IRAS 21352+4307), and non-detection towards CB 65 (IRAS 162772332) and CB 205 (IRAS 19433+2743). These are the first reported interferometric observations of water masers in Bok globules of the CB catalog. We also present single-dish observations of millimeter and centimeter spectral lines towards CB 101 (IRAS 175030833) and CB 65 (IRAS 162772332). All the maser emission seems to be associated with star forming regions hosting bipolar molecular outflows, except IRAS 175030833 in CB 101, which we suggest to be a possible Mira evolved star, and IRAS 162772332 in CB 65, of unknown nature. We have used the precise position of the maser emission to derive information about the powering source of the masers. By analyzing the spatio-kinematical distribution of the water masers, we confirm the millimeter source CB 3-mm as the most likely powering source of the CB 3 masers. We propose the near-IR source CB 232 YC1-I as the best candidate for pumping the maser emission observed in CB 232, while in CB 54, we suggest that the pumping source of the masers could be located at the position of an elongated feature observed in near-infrared maps.
1 Introduction
Bok globules (Bok & Reilly, 1947) are small ( pc), isolated clouds, some of which are sites of low- and intermediate-mass star formation (Yun & Clemens, 1990). They have been observed to be in different evolutionary stages, from starless dark cores (Yun et al., 1996; Kane & Clemens, 1997) to sites hosting T-Tauri stars (Yun & Clemens, 1995; Launhardt & Henning, 1997). These globules have traditionally been considered important laboratories for the study of star formation processes, since their small size and relative simplicity make these processes less likely to be affected by confusion from different generations of young stellar objects. Another important aspect of star formation in Bok globules is that it may explain the somewhat puzzling existence of pre-main-sequence objects apparently not related with known molecular clouds. At least some of these objects may have originated in already dispersed Bok globules (Launhardt & Henning, 1997).
Among the observational tools used in star-formation studies, water masers have proved to be a very powerful one. Water maser emission at 22 GHz is a good tracer of mass-loss activity in young stars (Rodríguez et al., 1980; Felli et al., 1992; Xiang & Turner, 1995; De Buizer et al., 2005). In the low-mass young stellar objects (YSOs) this signpost of mass loss phenomena occurs in their most embedded phase, at the earliest stages of evolution. This period is characterized by the presence of the disk/young stellar object/outflow system (Shu et al., 1987) and a large amount of circumstellar dust. In the low-mass YSOs framework, the youngest evolutionary stage is represented by Class 0 sources (André et al., 1993), which show the most powerful and collimated molecular outflows (e.g., Hirano et al. 2006, and references therein), centimeter emission (e.g. Anglada 1995), and host strong submillimeter and millimeter continuum emission (André et al., 1993; André & Montmerle, 1994).
Water maser studies have shown that this emission provides a good characterization of the age of low-mass YSOs (e.g. Furuya et al. 2001), with Class 0 sources being the most probable candidates to harbor water maser emission, due to the interaction of powerful jets with a larger amount of circumstellar material. This fact makes sources that host water maser emission good candidates for being in a very early stage of its evolution. In addition, several water maser surveys towards low-mass YSOs have shown that this emission tends to be located close (within several hundred AU) to the central powering source (Chernin, 1995; Claussen et al., 1998; Furuya et al., 2000, 2003). These characteristics make the water maser phenomenon well-suited to derive information about the location of the exciting source of the mass-loss phenomena observed in young star forming regions. Moreover, maser emission can be a useful tool for studying the physical conditions and kinematics of the gas surrounding the most embedded YSOs at very high angular resolution ( 1 mas), due to the very specific conditions which pump the maser emission (hundreds of K and n cm-3) (Claussen et al., 1998; Furuya et al., 2000; Patel et al., 2000; Torrelles et al., 2003; Goddi et al., 2005; Marvel, 2005; Vlemmings et al., 2006). These conditions can be generated in shocked gas compressed by winds (Chernin, 1995; Torrelles et al., 1997; Furuya et al., 2000; Moscadelli et al., 2000), as well as in circumstellar disks (Fiebig et al., 1996; Torrelles et al., 1996, 1998; Seth et al., 2002; Brand et al., 2003). This dichotomy has also been suggested to be a possible evolutionary sequence, with water masers tracing gravitationally bound material (e.g., circumstellar disks) in the youngest sources, and outflows in more evolved YSOs (Torrelles et al., 1997, 1998). Recently, the hot dense infalling gas after the accretion shock has also been proposed as a good environment for pumping the maser emission (Menten & van der Tak, 2004).
Therefore, there are different evolutionary aspects related to water maser emission (e.g., the likely occurrence of masers in Class 0 YSOs, and their association with either disks and jets). Bok globules are appropriate sites to study evolution of YSOs, since they are usually identified as dark patches in optical images, without any selection criterion related to possible star-forming activity (Clemens & Barvainis 1988, hereafter CB; Bourke et al. 1995), and therefore they may span a large range of evolutionary stages. Surprisingly, studies of water masers in Bok globules are relatively scarce. Recently, our group undertook a sensitive and systematic single-dish survey for water masers in 207 positions within Bok globules (Gómez et al., 2006), using NASA’s 70m antenna in Robledo de Chavela (Spain), which provided six new detections in CB 34 (catalog ), CB 54 (catalog ), CB 65 (catalog ), CB 101 (catalog ), CB 199 (catalog ), and CB 232 (catalog ). Before this survey, only Scappini et al. (1991) conducted a search for water masers specifically in Bok globules, with 80 target positions and only one detection towards CB 3 (catalog ). Other surveys for water masers included some Bok globules within their target positions (e.g., Felli et al., 1992; Palla & Prusti, 1993; Wouterloot et al., 1993; Persi et al., 1994; Codella et al., 1995), although they did not find any detection in these types of sources.
Using as a reference the catalogs of Bok globules of CB in the northern hemisphere, and Bourke et al. (1995) in the southern one (probably the more complete ones available), we are only aware of 9 Bok globules in those catalogs that are apparently associated with water maser emission: The six new detections mentioned above in the survey by Gómez et al. (2006), the detection towards CB 3 reported by Scappini et al. (1991), as well as the detections obtained by Schwartz & Buhl (1975) and Neckel et al. (1985) in CB 39 (catalog ) and CB 205 (catalog ) respectively. All these reported detections of masers in Bok globules present single-dish data. However, interferometric high-angular resolution observations are necessary to pinpoint accurately the actual pumping source of water maser emission among several candidates, and to determine whether maser emission in these Bok globules tends to trace collimated jets or circumstellar disks.
In this paper we present for the first time interferometric, high-angular resolution observations using the Very Large Array (VLA) of the National Radio Astronomy Observatory111The National Radio Astronomy Observatory is a facility of the National Science Foundation operated under cooperative agreement by Associated Universities, Inc. of some of these water masers in Bok globules. This paper is structured as follows: in §2 we describe our observations and data processing; in §3 we present our observational results and we discuss them; we summarize our conclusions in §4.
2 Observations and data processing
2.1 Target selection
We present interferometric observations using the VLA in the Bok globules in which water masers were detected in the survey by Gómez et al. (2006) between 2002 April and 2003 May (i.e., CB 54, CB 65, CB 101, and CB 232), as well as CB 3 (Scappini et al., 1991) and CB 205 (Neckel et al., 1985). The interferometric data have been complemented with a multimolecular single-dish study at millimeter and centimeter wavelengths using the IRAM-30m and Robledo-70m antenna of CB 101 (IRAS 175030833) and CB 65 (IRAS 162772332), in order to better understand the nature of these sources, and determine the internal structure of their surrounding region.
2.2 VLA Observations
We observed simultaneously the 616-523 transition of H2O (rest frequency = 22235.080 MHz) and continuum at 1.3 cm with the VLA, toward the Bok globules CB 54, CB 65, CB 101, CB 205, and CB 232. The observations were carried out on 2004 February 2 and 3 using the VLA in its CnB configuration, except for the CB 65 observations that were carried out on 2005 February 12 in the BnA configuration. We selected the four IF spectral line mode to observe line and continuum simultaneously, processing both right and left circular polarizations, which we averaged together. Two IFs were used to observe the water maser transition, sampled on 64 channels over a bandwidth of 3.125 MHz, with a velocity resolution of 0.66 km s-1. The other two IFs were used for radio continuum observations at 1.3 cm, covering a 25 MHz bandwidth on 8 channels, and centered 50 MHz above the central frequency used for line observations. The central velocity of the bands for line observations, the coordinates of the phase centers and the synthesized beam information are listed in Table 1 for each source. The primary calibrators were 3C48 (adopted flux density of 1.132 Jy) for observations on 2004 February 2, and 3C286 (adopted flux density of 2.539 Jy) for observations on 2004 February 3 and 2005 February 12. The phase calibrators and their bootstrapped flux densities are given in Table 1. We used J0609-157, J1743-038, and 3C286 as bandpass calibrators. Calibration and data reduction were performed with the Astronomical Image Processing System (AIPS) of NRAO. We detected water maser emission in CB 54, CB 101, and CB 232 (see Table 2), but we did not detect any emission towards either CB 65 or CB 205. In the case of CB 101 and CB 232, maser data were self-calibrated, and spectral Hanning smoothing was applied (to alleviate ringing in the bandpass), which provides a final velocity resolution of 1.3 km s-1. The continuum data of these two sources were cross-calibrated using the self-calibration solutions obtained for the stronger maser lines. None of the sources is detected in radio continuum (see §3), probably because the typical values of the centimeter continuum emission observed in Bok globules (see Moreira et al. 1997, 1999) fall below our sensitivity limit
We have also processed water maser data in source CB 3, taken from the VLA archive. The observations were carried out on 1995 October 28, in the B configuration. These observations were made in the 1IF spectral line mode, in right circular polarization only, with a bandwidth of 6.25 MHz sampled over 128 channels (velocity resolution of 0.66 km s-1). The velocity of the center of the bandwidth, coordinates of the phase center, and synthesized beam size are also listed in Table 1. The source 3C48 was used as primary flux calibrator, with an assumed flux density of 1.131 Jy, while J0136+478 was used as phase and bandpass calibrator (Table 1). Water maser emission was detected toward CB 3 (see Table 2). The data were self-calibrated and spectral Hanning smoothing was applied, with a final velocity resolution of 1.3 km s-1.
2.3 Single-dish observations
2.3.1 IRAM 30 m
Millimeter single-dish observations were carried out towards CB 65 (IRAS 162772332) and CB 101 (IRAS 175030833) with the IRAM 30-m telescope at Pico Veleta (Spain), in 2004 July-August. We have used Superconductor-Insulator-Superconductor (SIS) heterodyne receivers to observe nine different transitions at , , and mm. We observed the 13CO(), 13CO(), C18O(), C18O(), CO(), CO(), SiO(), CS(), and CS() lines towards CB 101. In the case of CB 65, only the CO() and CO() lines were observed. In Table 3 we have summarized the rest frequencies of the different molecular transitions observed, the typical system temperature (Tsys), the half power beam width, the main beam efficiency, averaging area in case the spectrum corresponds to the average of several positions, and the derived line parameters. Pointing was checked every hour by observing J1743038, giving a pointing accuracy better that . The observations were made by wobbling the secondary mirror to a distance of 220′′ from the source for CO(), CO(), and CS() transitions, and in frequency switching mode for C18O(), C18O(), 13CO(), 13CO(), CS(), and SiO() transitions. In addition, we observed CO() and CO() in frequency switching mode at one selected position to better estimate the excitation conditions. The data were taken with the versatile spectrometer assembly (VESPA) autocorrelator, split into two or three parts (depending on the lines), to observe simultaneously two or three different frequencies. This provided resolutions between 0.05 and 0.4 km s-1 at 1.3 mm, between 0.05 and 0.8 km s-1 at 2.7 mm, and km s-1 at 3 mm. Moreover, we used a 1 MHz filter bank split into two parts of 256 channels each, in combination with VESPA. It provided a velocity resolution of 1.3 and 2.6 km s-1 at 1.3 and 2.7 mm, respectively. The calibration was made using the chopper wheel technique and the line intensities are reported as main beam brightness temperatures. With this setup, in some cases the same transition was observed with different velocity resolutions. The values shown in Table 3 correspond to the data with best rms.
2.3.2 Robledo de Chavela 70 m
Centimeter single-dish spectral line observations of CB 101 were obtained with NASA’s 70 m antenna (DSS-63) at Robledo de Chavela, Spain, for both CCS and NH3(1,1) transitions. Rest frequencies, typical system temperatures, half power beam widths, main beam efficiencies, and averaging region are given in Table 3. The rms pointing accuracy of the telescope was better than and for CCS and ammonia observations, respectively. The data were taken with a 1.3 cm receiver comprising a cooled high-electron-mobility transistor (HEMT) amplifier. A noise diode was used to calibrate the data. Observations were made in frequency switching mode, using a 256-channel digital Fast Fourier Transform spectrometer. The CCS observations were performed on 2002 May with a bandwidth of 1 MHz (velocity resolution km s-1), while the NH3 observations were carried out during 2003 July with a bandwidth of 10 MHz (velocity resolution km s-1).
All the single-dish data reduction was carried out using the CLASS package, developed at IRAM and the Observatoire de Grenoble as part of the GAG software.
3 Results and discussion
3.1 CB 3
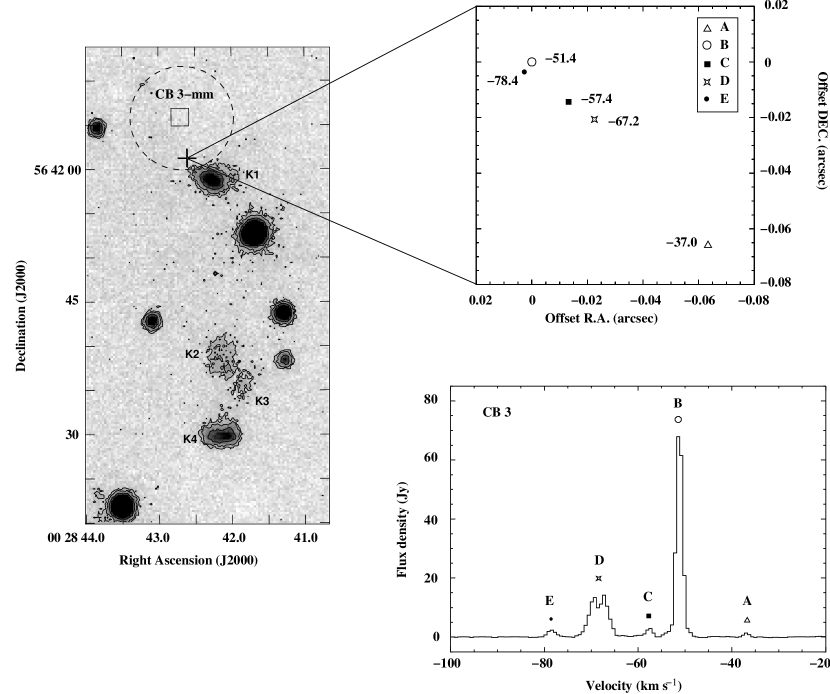
CB 3 is located at the near side of the Perseus arm, at a distance of 2.5 kpc (Launhardt & Henning, 1997; Wang et al., 1995). This globule shows a highly luminous FIR/submillimeter dust condensation ( = 930 ), and it seems to be associated with intermediate-mass star formation (Launhardt & Henning, 1997; Launhardt et al., 1997). Several sources in different stages of evolution have been identified in CB 3: the young stellar object CB 3/YC1 (catalog ), which corresponds to IRAS 00259+5625 (catalog ) (Yun & Clemens, 1994b), a near-infrared source, CB 3 YC1-I (catalog ), that was proposed to be a Class II source (Yun & Clemens, 1995), and a millimeter source, CB 3-mm (catalog ) (Launhardt & Henning, 1997), cataloged by Codella & Bachiller (1999) as a probable Class 0 object, which also shows submillimeter emission (Launhardt et al., 1997). This Bok globule is associated with a bipolar molecular outflow elongated in the northeast-southwest direction (Yun & Clemens, 1994b; Codella & Bachiller, 1999), of which CB 3-mm was proposed to be the driving source (Codella & Bachiller, 1999). The CO channel maps reveal different clumps along its main axis, which suggest episodic mass loss (Codella & Bachiller, 1999). There are four H2 emission knots, projected towards the blueshifted lobe of the outflow, and whose distribution does not follow a straight line (see Fig. 1), probably due to precession of the outflow axis (Massi et al., 2004).
Our VLA maser spectrum is shown in Fig. 1. Water maser emission in this source was first detected by Scappini et al. (1991), although the position reported with those single-dish observations is shifted (30′′, 60′′) from our VLA position. At least five independent spectral features are evident in the VLA maser spectrum (Fig. 1), which we designated as A, B, C, D, and E on Table 2, and are centered at , 51.4, 57.4, 67.2, and 78.4 km s-1 respectively. Component D may in its turn be composed of two individual features, but they are blended together, given our spectral resolution. All except component A are blueshifted with respect to the cloud velocity (=38.3 km s-1, Clemens & Barvainis 1988). The five maser features delineate a spatial structure of 01 elongated from northeast to southwest (see Fig. 1). Assuming that the emission from a given velocity channel is dominated by a single component, its position can be determining with high accuracy. Therefore, the linear structure observed is real and it is likely to be tracing the base of a jet, since the relative positional uncertainty ( 0007, see fourth column in Table 2) of the emission for individual maser spectral features is better than the total size of the structure ( 01; see Fig. 1). The emission corresponding to the velocity closest to that of the cloud (feature A) occupies the southern part of the structure, while that of the most blueshifted one (E) is located at the north.
The maser emission is aligned in the same direction than the blueshifted molecular outflow, and it is located 5” south of the position of CB3-mm reported by Launhardt & Henning (1997), between this source and the northernmost H2 knot observed by Massi et al. (2004) (see Fig. 1). However, the mm observations were made with a beamsize of , so it is possible that both mm and water maser emission actually come from the same location, which would be more accurately traced by the masers. The proximity of the masers to the mm source is consistent with the idea that the YSO traced by this source is exciting the water masers and probably powering the molecular outflow. Nevertheless, although this mm source is the best candidate, we cannot rule out the existence of another embedded source closer to the masers, and higher resolution observations at millimeter and submillimeter wavelengths are needed in order to clarify this point.
In Fig. 2 we have represented the position-velocity diagram of the maser emission along the major axis of the maser structure, by considering the centroids of the maser emission for each velocity channel. We note that although these centroids are not independent spectral features, spatio-kinematical information of the gas traced by water masers can be derived from the analysis of these centroids, under the assumption that each velocity channel there is a single dominant component. This diagram shows an interesting wave-like distribution, similar to that observed in AFGL 2591 (Trinidad et al., 2003). Massi et al. (2004), based on the relative spatial distribution of H2 knots with respect to the powering source, suggested the possible presence of a precessing outflow. Our position-velocity diagram also supports this suggestion, but at smaller scales, with the wave-like distribution pattern compatible with a precessing jet traced by masers at scales of 250 AU. To illustrate this possibility we have represented an ideal model of a precessing jet that can qualitatively explain the same wave-like tendency observed in the position-velocity diagram. In the lower panels of Fig. 2, we show a sketch reproducing the model we propose. In order to fit the model with the observed pattern, we approximated the precessing jet with a narrow cone on whose surface discrete ejections of material are located and we assumed that the ejected material is being decelerated (bottom left panel of Fig. 2). We also consider that the motion of the ejected material is dominated by deceleration, while the changes in velocity due to precession are negligible. Therefore, our model can reproduce a wave-like distribution (solid lines joining the dots in the bottom right panel of Fig. 2) similar to the one observed (dashed lines joining the symbols in the upper panel of Fig. 2). Under these assumptions, we estimate a deceleration of the ejected material of 2.2 10-8 cos km s-2 ( 0.14 cos AU yr-2), where is the position angle between the direction of the jet and the plane of the sky. We caution that our aim with this model is to explain the wave-like tendency observed with the position-velocity diagram, and not to reproduce exactly the observed maser emission. Further support for the possible presence of a precessing jet at these small scales (250 AU) could be obtained with proper motions studies of masers by means of VLBI observations.
3.2 CB 54
This Bok globule hosts a multiple system of YSOs towards CB54 YC1 (catalog ) (IRAS 07020-1618 (catalog )), with the presence of two bright near-infrared (K band, 2.2 m) objects (CB54 YC1-I (catalog ), YC1-II (catalog ), which are probably Class I protostars), plus a bright elongated feature (hereafter CB54 YC1-SW (catalog )) mainly seen in H2 [v = 1–0 S(1), 2.121 m] (Yun & Clemens 1994a, 1995; Yun et al. 1996; see Fig. 3). In addition, Yun et al. (1996) and Moreira et al. (1997) reported a radio continuum source (CB 54 VLA1) at 3.6 and 6 cm located 5′′ to the NE of the nominal position of the IRAS source (see Fig. 3). These sources are located near the center of a bipolar CO outflow that is oriented in the northeast-southwest direction and probably moves close to the plane of the sky (Yun & Clemens, 1994b).
Our VLA observations (Fig. 3) reveal water maser emission with two distinct spectral features, at and 17.8 km s-1. These velocities are blueshifted with respect to the velocity of the cloud (=19.5 km s-1; Clemens & Barvainis 1988). No maser emission was detected with the Robledo antenna at the velocities reported here (Gómez et al., 2006), which is understandable since the flux density reported here is below the sensitivity threshold of those single-dish observations. However, Gómez et al. (2006) detected a component at km s-1, which reached a flux density of up to Jy, and another one of up to Jy at km s-1. Neither of these is evident in the VLA spectrum (Fig. 3), although the component at km s-1 might be present at a very low level, and blended with the one at km s-1.
The maser emission is located at the position of the elongated feature CB54 YC1-SW (see Fig. 3). Yun (1996), on the basis that the elongated feature appears brighter in H2 than in the K-band, proposed that it could trace shocked material, such as a knot in a near-infrared jet. However, given the association of CB 54 YC1-SW with the water masers, we suggest that this feature is another embedded YSO and that, according to the association of water masers with mass-loss phenomena, this object would be a good candidate for being the powering source of the observed molecular outflow in the region. In fact, masers are located 18000-20000 AU (at a distance of 1.5 kpc; Launhardt & Henning 1997) from both CB 54 YC1-I and CB 54 YC1-II, which make these objects less likely candidates for pumping the maser emission, since masers in low-mass star-forming regions tend to be within several hundred AU from the powering source (Chernin, 1995; Claussen et al., 1998; Furuya et al., 2000, 2003). We did not detect 1.3 cm continuum emission with the VLA either at the position of CB54 YC1-SW or toward the other proposed YSOs in the region, with a 3 upper limit of 0.4 mJy. Deeper radio continuum measurements in this region could help to confirm whether CB54 YC1-SW is indeed a YSO.
3.3 CB 65
IRAS 162772332 (catalog ) is located at the north-western edge of the Bok globule CB 65, in Ophiucus. The nature of this IRAS source is unknown, and in fact, Parker (1988) suggested that it may not be associated with the globule. Visser et al. (2002) carried out submillimeter observations towards CB 65, and detected a submillimeter core at the center of the globule at a distance of southeast of IRAS 162772332, but no emission was detected at the IRAS position. Our single dish survey with the Robledo de Chavela antenna (Gómez et al., 2006) revealed water maser emission in IRAS 162772332, near the CB 65 cloud velocity (VLSR = 2.3 km s-1; Clemens & Barvainis 1988), with a peak flux density of 0.3 Jy on 2002 June 16. However, no water maser emission was detected with the VLA ( 40 mJy, 3 upper limit), which is not surprising given the time variability of these masers (Reid & Moran, 1981). No 1.3 cm continuum emission was detected, with a 3 upper limit of 2.7 mJy. On the other hand, the observations performed with the IRAM 30 m antenna in the CO(10) and (21) transitions, showed no high-velocity wings in the spectra, with an rms of 0.03 K and 0.3 K respectively. This indicates the absence of any significant mass-loss activity.
Unfortunately, there is not enough information in the literature about IRAS 162772332 that may help us to clarify the real nature of this source. For instance, IRAS data show emission at 60 m, but only upper limits at 12, 25, and 100 m. There are no Midcourse Space Experiment (MSX) infrared data nor emission in the 2MASS K, H, or J bands, from which to obtain information about its spectral energy distribution. Deeper infrared observations are needed to reveal the nature of this source.
3.4 CB 101
CB 101 is a Bok globule located at 200 pc (Lee & Myers, 1999), and cataloged as a cold and quiescent cloud (Clemens et al., 1991) that hosts two IRAS sources, IRAS 175030833 (catalog ) and IRAS 175050828 (catalog ). Our water maser single-dish survey (Gómez et al., 2006) revealed water maser emission towards IRAS 175030833. This source is located 9′ south of the globule center.
3.4.1 Water Masers and Radio Continuum Emission
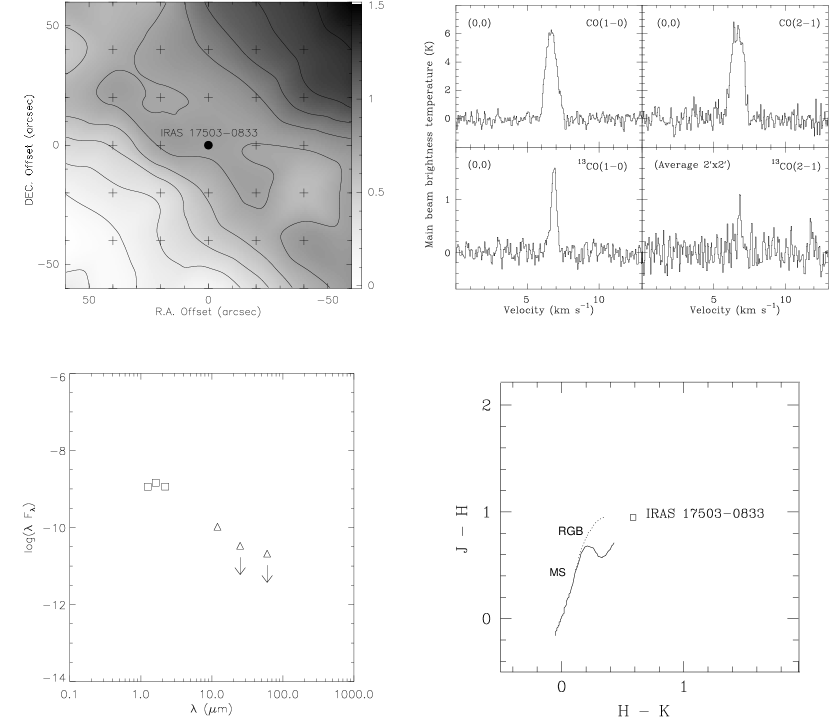
We have detected with the VLA water maser emission toward IRAS 175030833 at VLSR 29.5 km s-1 (see Table 2 and Fig. 4), which is redshifted with respect to the velocity of the molecular cloud ( = 6.7 kms-1; Clemens & Barvainis 1988). The flux density and velocity of the water maser emission are similar to those found with the Robledo antenna (Gómez et al., 2006). The water maser emission coincides with a point source observed in the 2MASS K-band, which is probably the near-IR counterpart of IRAS 175030833 (see Fig. 4). We did not detect VLA radio continuum emission at 1.3 cm, with a 3 upper limit of 0.4 mJy.
3.4.2 Millimeter and Centimeter Single-Dish Observations
Our aim was to search for any sign of star formation activity toward IRAS 175030833 (e.g., presence of molecular outflows, high density molecular gas, and/or shocked material). We mapped the CO() and () transitions over an area of in order to detect a possible molecular outflow in the region. No high-velocity emission was detected in the spectra of any of these transitions, with a rms of 0.012 K per channel (channel width 0.8 km s-1) and 0.026 K per channel (channel width 0.4 km s-1), respectively. Moreover, as for the general distribution of the molecular gas, Fig. 5 shows the map of 13CO() integrated intensity in a region of . It reveals more intense emission towards the northwest of the IRAS source, which probably originates from the molecular gas contained in the Bok globule, but there is no obvious local maximum of molecular gas towards the source. In Table 3 we summarized the parameters of the single-dish spectra of different molecular transitions towards IRAS 175030833.
The 13CO() emission is weak, and barely detectable in the region (Fig. 5). We did not detect emission of high-density molecular gas tracers such as the CCS(21-10), NH3(1,1), CS() and CS() lines. No emission of the SiO() transition was detected either. This transition is usually associated with shocked regions around young stellar objects (Harju et al., 1998; Gibb et al., 2004).
We derived the physical conditions from the CO and 13CO spectra obtained towards the IRAS source, under the following three assumptions (Estalella & Anglada, 1996): (1) local thermodynamic equilibrium, (2) the CO emission is optically thick, and (3) 13CO emission is optically thin. The CO() emission towards the IRAS position was used to obtain the excitation temperature () from:
where is the main beam brightness temperature of the CO() emission, in K.
For the 13CO() we derived its optical depth () and its column density (13CO) as:
where is the main beam brightness temperature of the 13CO() emission in K, and is the line width at half maximum, in km s-1.
The physical parameters (derived from the spectra shown in Fig. 5 and their corresponding values in Table 3), are K, , and cm-2 at the position of the IRAS source. The value of is (3.31.2)1020 cm-2, derived from the relative abundance of 13CO with respect to H2, proposed by Dickman (1978), [H2/13CO]=5105. Kim & Hong (2002) reported a value of N()=3.71015 cm -2 towards the central peak position of CB 101 (located north). This value at the center of the globule is 6 times higher than the value derived by us at the position of IRAS 175030833, which is consistent with a decrease of the gas density towards the edges of the cloud.
3.4.3 The Nature of IRAS 175030833
The absence of any signpost of star formation activity associated with the water maser emission, suggests that the water maser in CB 101 may not be associated with a young object but with an evolved star, since water maser emission is also known to be associated with circumstellar envelopes of late-type stars (Bowers & Hagen, 1984; Engels et al., 1986, 1988; Habing, 1996). Moreover, the difference between the centroid velocity of the detected water maser and the cloud velocity is km s-1, whereas this difference is usually km s-1 in the case of YSOs (Wilking et al., 1994; Anglada et al., 1996; Brand et al., 2003). To further investigate the true nature of IRAS 175030833, we searched for additional data in the literature.
The IRAS flux density at 12 m is well determined, but the values for 25, 60, and 100 m are only upper limits. The near-infrared flux densities were retrieved from the 2MASS catalog, and dereddened with a value for E(BV) = 0.21, taken from Whitelock et al. (1986) for stars with galactic latitude b = 8 . The corrected J, H, and K magnitudes are: 8.643, 7.690, and 7.100, respectively. The near- and far-infrared data flux densities are shown in Table 4, where we do not include the IRAS flux density at 100 m due to the low quality of those data.
In Fig. 5 we have plotted the spectral energy distribution (SED) of IRAS 175030833, including the upper limits for the IRAS flux densities. Evolved objects may show one or two maxima in their SED. After the AGB the SEDs usually show two maxima, one belonging to the central star and the other to the circumstellar envelope (Kwok, 1993). In the case of IRAS 175030833, if it is an evolved object there seem to be only one maximum in the near infrared; the second maximum should have shown up in the far infrared. The presence of only one maximum suggests that no disk or circumstellar envelope is detached from the central star. This would restrict the evolutionary stage of the star to the phase between Red Giant and the Asymptotic Giant Branch (AGB). The SED is then compatible with a black body distribution at a temperature of K, although more data points at different wavelengths would be necessary to better constrain this temperature. In Fig. 5, we have plotted the dereddened IR colours of the object in an IR color-color diagram, to further check its evolutionary stage. IRAS 175030833 is located to the right and above the Main Sequence and the Red Giant Branch, which is typical of Mira stars (see Whitelock et al. 1994, 1995). The temperatures of these stars fall in the range between 2000 K and 3500 K (van Belle et al., 2002) , which is compatible with the temperature of K estimated by us. Moreover, water maser emission is very frequent in Mira-type stars (Bowers & Hagen, 1984). Therefore, we suggest that the CO emission found belongs to the cloud CB 101, and IRAS 175030833 is a field star, not associated with the cloud. This is consistent with the location of this source at the edge of the Bok globule, at a distance of from its center. In any case, additional observations at other frequencies, in order to be able to accurately determine the effective temperature of the star from the SED, together with a light curve to perform variability studies of this source are needed to confirm its identification as a Mira star.
3.5 CB 205
CB 205 (catalog ), at a distance of 2 kpc (Launhardt & Henning, 1997), is a very active star formation region containing several YSOs (Herbst & Turner, 1976; Neckel et al., 1985; Neckel & Staude, 1990; Huard et al., 2000; Massi et al., 2004), and a weakly collimated bipolar molecular outflow with a significant overlapping of the redshifted and blueshifted emission lobes (Xie & Goldsmith, 1990).
CB 205 is one of the few Bok globules in the CB catalog where water maser emission was known (Neckel et al., 1985) before the survey of Gómez et al. (2006). The maser, located near IRAS 19433+2743 (catalog ), showed a peak flux density of 4.8 Jy on May-October 1983. This emission was detected again by Brand et al. (1994) on 1992 January 18, with a peak flux density of 0.7 Jy and located 40′′ west of our phase center, although inside the 2′ VLA primary beam at 22 GHz. However, Gómez et al. (2006) did not detect the maser, with a upper limit of 0.75 Jy on 2003 July 11 and of 0.15 Jy on 2004 July 22 and 2005 June 16. Our VLA observations also failed to detect any water maser emission on 2004 February 3, at a level of mJy (3). In our VLA observations, we did not detect any radio continuum emission at 1.3 cm, with a 3 upper limit of 0.5 mJy.
3.6 CB 232
This Bok globule contains a CO bipolar molecular outflow centered near CB 232 YC1 (catalog ) (IRAS 21352+4307 (catalog )), whose lobes are slightly overlapped and exhibit a poor degree of collimation (Yun & Clemens, 1994b). Near-infrared maps reveal a single source, the possible counterpart of IRAS 21352+4307 (Yun & Clemens, 1994a), which was designated as CB 232 YC1-I (catalog ) and classified as a Class I object by Yun & Clemens (1995). Huard et al. (1999) detected two submillimeter sources, SMM1 (the westernmost one) and SMM2 (the easternmost one), located 10′′ west and 5′′ south-east from CB 232 YC1-I respectively, with a positional error of . SMM1 was classified as a Class 0 source while SMM2 was proposed to be either the submillimeter counterpart of CB 232 YC1-I, or another Class 0 source without infrared counterpart (Huard et al., 1999).
Our VLA observations show water maser emission with velocity VLSR 10.1 km s-1 (see Table 2 and Fig. 6), close to the cloud velocity (=12.6 km s-1; Clemens & Barvainis 1988), and coinciding, within the positional uncertainty, with the position of the near-infrared source CB 232 YC1-I (see Fig. 6). This positional agreement favors CB 232 YC1-I as the most likely candidate to power the maser emission and the molecular outflow observed in the region (according to the typical association of water masers to mass-loss phenomena).
The velocity of the maser is consistent with that found in the single-dish detection by Gómez et al. (2006), although the flux density was a factor of larger at the epoch of our interferometric observations. We did not detect radio continuum emission at 1.3 cm, with a 3 upper limit of 0.5 mJy.
4 Conclusions
In this work we have presented interferometric observations using the VLA, of several sources of water maser emission detected as part of a single-dish survey performed with the Robledo-70m antenna towards Bok globules. The general conclusions we have obtained are the following:
-
•
We have detected water maser emission with the VLA in CB 3, CB 54, CB 101 and CB 232. No water maser emission was detected towards CB 65 or CB 205.
-
•
These water masers are associated with star forming regions showing bipolar molecular outflows, except for CB 101 (IRAS 175030833), which we propose is an evolved object, possibly a Mira star, and CB 65 (IRAS 162772332), whose nature is unknown.
-
•
All of the Bok globules associated with star formation present multiple stellar systems in different evolutionary stages. Accurate positions of water masers has helped us to get information about the powering sources in the case of CB 3, CB 54, and CB 232. We propose the millimeter source CB 3-mm and the near-IR source CB 232 YC1-I as the best candidates for pumping the maser emission in CB 3 and CB 232 respectively. In the case of CB 54, we propose a new young object (CB 54 YC1-SW), seen as an elongated feature in near-infrared images, as the powering source of the maser emission.
-
•
The maser emission in CB 3 is distributed along the direction of the molecular outflow, and seems to be tracing the inner part of a collimated jet. The position-velocity distribution of the maser emission shows a wave-like structure, which is consistent with a precessing jet.
References
- André et al. (1993) André, P., Ward-Thompson, D., & Barsony, M. 1993, ApJ, 406, 122
- André & Montmerle (1994) André, P. & Montmerle, T. 1994, ApJ, 420, 837
- Anglada (1995) Anglada, G. 1995, Revista Mexicana de Astronomía y Astrofísica Conference Series, 1, 67
- Anglada et al. (1996) Anglada, G., Estalella, R., Pastor, J., Rodríguez, L. F., & Haschick, A. D. 1996, ApJ, 463, 205
- Brand et al. (2003) Brand, J., Cesaroni, R., Comoretto, G., Felli, M., Palagi, F., Palla, F., & Valdettaro, R. 2003, A&A, 407, 573
- Bok & Reilly (1947) Bok, B. J., & Reilly, E. F. 1947, ApJ, 105, 255
- Bourke et al. (1995) Bourke, T. L., Hyland, A. R., Robinson, G., James, S. D., & Wright, C. M. 1995, MNRAS, 276, 1067
- Bowers & Hagen (1984) Bowers, P. F., & Hagen, W. 1984, ApJ, 285, 637
- Brand et al. (1994) Brand, J., Cesaroni, R., Caselli, P., Catarzi, M., Codella, C., Comoretto, G., Curioni, G. P., Curioni, P., di Franco, S., Felli, M., Giovanardi, C., Olmi, L., Palagi, F., Palla, F., Panella, D., Pareschi, G., Rossi, E., Speroni, N., & Tofani, G. 1994, A&AS, 103, 541
- Brand et al. (2003) Brand, J., Cesaroni, R., Comoretto, G., Felli, M., Palagi, F., Palla, F., & Valdettaro, R. 2003, A&A, 407, 573
- Chernin (1995) Chernin, L. M. 1995, ApJ, 440, L97
- Claussen et al. (1998) Claussen, M. J., Marvel, K. B., Wootten, A., & Wilking, B. A. 1998, ApJ, 507, L79
- Clemens & Barvainis (1988) Clemens, D. P. & Barvainis, R. 1988, ApJS, 68, 257 (CB)
- Clemens et al. (1991) Clemens, D. P., Yun, J. L., & Heyer, M. H. 1991, ApJS, 75, 877
- Codella & Bachiller (1999) Codella, C. & Bachiller, R. 1999, A&A, 350, 659
- Codella et al. (1995) Codella, C., Palumbo, G. G. C., Pareschi, G., Scappini, F., Caselli, P., & Attolini, M. R. 1995, MNRAS, 276, 57
- De Buizer et al. (2005) De Buizer, J. M., Radomski, J. T., Telesco, C. M., & Piña, R. K. 2005, ApJS, 156, 179
- Dickman (1978) Dickman, R. L. 1978, ApJS, 37, 407
- Elitzur et al. (1989) Elitzur, M., Hollenbach, D. J., & McKee, C. F. 1989, ApJ, 346, 983
- Elitzur et al. (1992) Elitzur, M., Hollenbach, D. J., & McKee, C. F. 1992, ApJ, 394, 221
- Engels et al. (1986) Engels, D., Schmid-Burgk, J., & Walmsley, C. M. 1986, A&A, 167, 129
- Engels et al. (1988) Engels, D., Schmid-Burgk, J., & Walmsley, C. M. 1988, A&A, 191, 283
- Estalella & Anglada (1996) Estalella, R., & Anglada, G. 1996, Introducción a la Física del Medio Interestelar. Textos docents, 50 (Edicions de la Universitat de Barcelona; Barcelona)
- Felli et al. (1992) Felli, M., Palagi, F., & Tofani, G. 1992, A&A, 255, 293
- Fiebig et al. (1996) Fiebig, D., Duschl, W. J., Menten, K. M., & Tscharnuter, W. M. 1996, A&A, 310, 199
- Furuya et al. (2000) Furuya, R. S., Kitamura, Y., Wootten, H. A., Claussen, M. J., Saito, M., Marvel, K. B., & Kawabe, R. 2000, ApJ, 542, L135
- Furuya et al. (2001) Furuya, R. S., Kitamura, Y., Wootten, H. A., Claussen, M. J., & Kawabe, R. 2001, ApJ, 559, L143
- Furuya et al. (2003) Furuya, R. S., Kitamura, Y., Wootten, A., Claussen, M. J., & Kawabe, R. 2003, ApJS, 144, 71
- Gibb et al. (2004) Gibb, A. G., Richer, J. S., Chandler, C. J., & Davis, C. J. 2004, ApJ, 603, 198
- Goddi et al. (2005) Goddi, C., Moscadelli, L., Alef, W., Tarchi, A., Brand, J., & Pani, M. 2005, A&A, 432, 161
- Goldreich & Kwan (1974) Goldreich, P. & Kwan, J. 1974, ApJ, 191, 93
- Gómez et al. (2006) Gómez, J. F., de Gregorio-Monsalvo, I., Suárez, O, & Kuiper, T. B. H. 2006, AJ, 132, 1322
- Habing (1996) Habing, H. J. 1996, A&A Rev., 7, 97
- Harju et al. (1998) Harju, J., Lehtinen, K., Booth, R. S., & Zinchenko, I. 1998, A&AS, 132, 211
- Herbst & Turner (1976) Herbst, W. & Turner, D. G. 1976, PASP, 88, 308
- Hirano et al. (2006) Hirano, N., Liu, S.-Y., Shang, H., Ho, P. T. P., Huang, H.-C., Kuan, Y.-J., McCaughrean, M. J., & Zhang, Q. 2006, ApJ, 636, L141
- Huard et al. (1999) Huard, T. L., Sandell, G., & Weintraub, D. A. 1999, ApJ, 526, 833
- Huard et al. (2000) Huard, T. L., Weintraub, D. A., & Sandell, G. 2000, A&A, 362, 635
- Kane & Clemens (1997) Kane, B. D., & Clemens, D. P. 1997, AJ, 113, 1799
- Kim & Hong (2002) Kim, H. G., & Hong, S. S. 2002, ApJ, 567, 376
- Kwok (1993) Kwok, S. 1993, ARA&A, 31, 63
- Launhardt & Henning (1997) Launhardt, R. & Henning, T. 1997, A&A, 326, 329
- Launhardt et al. (1997) Launhardt, R., Ward-Thompson, D., & Henning, T. 1997, MNRAS, 288, L45
- Lee & Myers (1999) Lee, C. W., & Myers, P. C. 1999, ApJS, 123, 233
- Marvel (2005) Marvel, K. B. 2005, AJ, 130, 2732
- Massi et al. (2004) Massi, F., Codella, C., & Brand, J. 2004, A&A, 419, 241
- Menten & van der Tak (2004) Menten, K. M., & van der Tak, F. F. S. 2004, A&A, 414, 289
- Moreira et al. (1999) Moreira, M. C., Yun, J. L., Torrelles, J. M., Afonso, J. M., & Santos, C. A. 1999, AJ, 118, 1315
- Moreira et al. (1997) Moreira, M. C., Yun, J. L., Vázquez, R., & Torrelles, J. M. 1997, AJ, 113, 1371
- Moscadelli et al. (2000) Moscadelli, L., Cesaroni, R., & Rioja, M. J. 2000, A&A, 360, 663
- Neckel et al. (1985) Neckel, T., Chini, R., Guesten, R., & Wink, J. E. 1985, A&A, 153, 253
- Neckel & Staude (1990) Neckel, T. & Staude, H. J. 1990, A&A, 231, 165
- Palla & Prusti (1993) Palla, F., & Prusti, T. 1993, A&A, 272, 249
- Parker (1988) Parker, N. D. 1988, MNRAS, 235, 139
- Patel et al. (2000) Patel, N. A., Greenhill, L. J., Herrnstein, J., Zhang, Q., Moran, J. M., Ho, P. T. P., & Goldsmith, P. F. 2000, ApJ, 538, 268
- Persi et al. (1994) Persi, P., Palagi, F., & Felli, M. 1994, A&A, 291, 577P
- Reid & Moran (1981) Reid, M. J. & Moran, J. M. 1981, ARA&A, 19, 231
- Rodríguez et al. (1980) Rodríguez, L. F., Moran, J. M., Gottlieb, E. W., & Ho, P. T. P. 1980, ApJ, 235, 845
- Scappini et al. (1991) Scappini, F., Caselli, P., & Palumbo, G. G. C. 1991, MNRAS, 249, 763
- Schwartz & Buhl (1975) Schwartz, P. R. & Buhl, D. 1975, ApJ, 201, L27
- Seth et al. (2002) Seth, A. C., Greenhill, L. J., & Holder, B. P. 2002, ApJ, 581, 325
- Shu et al. (1987) Shu, F. H., Adams, F. C., & Lizano, S. 1987, ARA&A, 25, 23
- Torrelles et al. (1998) Torrelles, J. M., Gómez, J. F., Rodríguez, L. F., Curiel, S., Anglada, G., & Ho, P. T. P. 1998, ApJ, 505, 756
- Torrelles et al. (1996) Torrelles, J. M., Gomez, J. F., Rodríguez, L. F., Curiel, S., Ho, P. T. P., & Garay, G. 1996, ApJ, 457, L107
- Torrelles et al. (1997) Torrelles, J. M., Gómez, J. F., Rodríguez, L. F., Ho, P. T. P., Curiel, S., & Vázquez, R. 1997, ApJ, 489, 744
- Torrelles et al. (2003) Torrelles, J. M., Patel, N. A., Anglada, G., Gómez, J. F., Ho, P. T. P., Lara, L., Alberdi, A., Cantó, J., Curiel, S., Garay, G., & Rodríguez, L. F. 2003, ApJ, 598, L115
- Trinidad et al. (2003) Trinidad, M. A., Curiel, S., Cantó, J., D’Alessio, P., Rodríguez, L. F., Torrelles, J. M., Gómez, J.F., Patel, N., Ho, P. T. P. 2003, ApJ, 589, 386
- van Belle et al. (2002) van Belle, G. T., Thompson, R. R., & Creech-Eakman, M. J. 2002, AJ, 124, 1706
- Visser et al. (2002) Visser, A. E., Richer, J. S., & Chandler, C. J. 2002, AJ, 124, 2756
- Vlemmings et al. (2006) Vlemmings, W. H. T., Diamond, P., van Langevelde, H. J., Torrelles, J, M. 2006, A&A, 448, 597
- Wang et al. (1995) Wang, Y., Evans, N. J., Zhou, S., & Clemens, D. P. 1995, ApJ, 454, 217
- Whitelock et al. (1986) Whitelock, P., Feast, M., & Catchpole, R. 1986, MNRAS, 222, 1
- Whitelock et al. (1995) Whitelock, P., Menzies, J., Feast, M., Catchpole, R., Marang, F., & Carter, B. 1995, MNRAS, 276, 219
- Whitelock et al. (1994) Whitelock, P., Menzies, J., Feast, M., Marang, F., Carter, B., Roberts, G., Catchpole, R., & Chapman, J. 1994, MNRAS, 267, 711
- Wilking et al. (1994) Wilking, B. A., Claussen, M. J., Benson, P. J., Myers, P. C., Terebey, S., & Wootten, A. 1994, ApJ, 431, L119
- Wouterloot et al. (1993) Wouterloot, J. G. A., Brand, J., & Fiegle, K. 1993, A&AS, 98, 589
- Xiang & Turner (1995) Xiang, D. & Turner, B. E. 1995, ApJS, 99, 121
- Xie & Goldsmith (1990) Xie, T. & Goldsmith, P. F. 1990, ApJ, 359, 378
- Yun & Clemens (1990) Yun, J. L., & Clemens, D. P. 1990, ApJ, 365, L73
- Yun & Clemens (1994a) Yun, J. L. & Clemens, D. P. 1994a, AJ, 108, 612
- Yun & Clemens (1994b) Yun, J. L. & Clemens, D. P. 1994b, ApJS, 92, 145
- Yun & Clemens (1995) Yun, J. L. & Clemens, D. P. 1995, AJ, 109, 742
- Yun et al. (1996) Yun, J. L., Moreira, M. C., Torrelles, J. M., Afonso, J. M., & Santos, N. C. 1996, AJ, 111, 841
- Yun (1996) Yun, J. L. 1996, AJ, 111, 930


| Source | R.A.aaCoordinates of the phase center. Units of right ascension are hours, minutes, and seconds. Units of declination are degrees, arcminutes, and arcseconds. | Dec.aaCoordinates of the phase center. Units of right ascension are hours, minutes, and seconds. Units of declination are degrees, arcminutes, and arcseconds. | bbocal standard of rest velocity of the center of the bandwidth. | Beam Size | Beam P.A. | Phase calibrator | ccBootstrapped flux densities of phase calibrators at 22 GHz. Uncertainties are 2. | DateddObservation date, YY/MM/DD |
|---|---|---|---|---|---|---|---|---|
| (J2000) | (J2000) | (km s-1) | () | () | (Jy) | |||
| CB 3eeArchive data | 00 28 43.5075 | 56 41 56.868 | 60.0 | 0.550.25 | 81 | J0136478 | 5.81.2 | 95/10/28 |
| CB 54 | 07 04 21.2170 | 16 23 15.000 | 7.9 | 0.930.44 | 73 | J0609157 | 4.550.17 | 04/02/02 |
| CB 65 | 16 30 43.7109 | 23 39 07.736 | 2.3 | 0.280.18 | 86 | J1626298 | 2.000.03 | 05/02/12 |
| CB 101 | 17 53 05.2300 | 08 33 41.170 | 28.8 | 0.990.39 | 68 | J1743038 | 7.040.05 | 04/02/03 |
| CB 205 | 19 45 23.8630 | 27 50 57.840 | 13.2 | 0.860.79 | 48 | J2015371 | 3.060.05 | 04/02/03 |
| CB 232 | 21 37 11.3100 | 43 20 36.260 | 12.1 | 1.080.67 | 53 | J2202422 | 2.500.04 | 04/02/03 |
| Source | Offset R.A.aaPosition offsets of the peak of each distinct water maser feature with respect to the reference feature used for self-calibration, which are (R.A., Dec.)J2000.0 = (00 28 42.612, 56 42 01.17) for CB 3, (17 53 05.882, 08 33 38.17) for CB 101 and (21 37 11.402, 43 20 38.26 ) for CB 232, or with respect to the phase center (07 04 21.217, 16 23 15.00) for CB 54. Units of right ascension are hours, minutes, and seconds. Units of declination are degrees, arcminutes, and arcseconds. | Offset Dec.aaPosition offsets of the peak of each distinct water maser feature with respect to the reference feature used for self-calibration, which are (R.A., Dec.)J2000.0 = (00 28 42.612, 56 42 01.17) for CB 3, (17 53 05.882, 08 33 38.17) for CB 101 and (21 37 11.402, 43 20 38.26 ) for CB 232, or with respect to the phase center (07 04 21.217, 16 23 15.00) for CB 54. Units of right ascension are hours, minutes, and seconds. Units of declination are degrees, arcminutes, and arcseconds. | PositionbbUncertainty in the relative positions with respect to the reference positions. The absolute position uncertainty of the reference position is 019 for CB 3, 005 for CB 101, and 012 for CB 232 and CB 54. Uncertainties are 2. | Flux densityccQuoted uncertainties are two times the rms noise in the maps. | ddLSR velocity of the spectral features. Velocity resolution 1.3 km s-1. |
|---|---|---|---|---|---|
| () | () | uncertainty () | (Jy) | (km s-1) | |
| CB 3 (A) | 0.063 | 0.065 | 0.007 | 1.290.03 | |
| (B) | 0 | 0 | eeReference feature. | 68.190.04 | |
| (C) | 0.013 | 0.014 | 0.003 | 2.770.03 | |
| (D) | 0.0226 | 0.0207 | 0.0006 | 19.780.04 | |
| (E) | 0.003 | 0.003 | 0.003 | 2.860.03 | |
| CB 54 | 6.49 | 6.30 | 0.03 | 0.0870.005 | |
| 6.467 | 6.293 | 0.018 | 0.1290.005 | ||
| CB 101 | 0 | 0 | eeReference feature. | 0.4990.003 | |
| CB 232 | 0 | 0 | eeReference feature. | 46.5680.006 |
| Molecule | Transition | 0 | Telescope | aaVelocity resolution for each transition. | TsysbbTypical system temperature. | HPBWccHalf power beam width of the telescope. | ddMain beam efficiency. | eePeak main beam brightness temperature of the line. Uncertainties are 2 . Upper limits are 3 . | AveragingffArea over which data were averaged to obtain the quoted , centered on IRAS 162772332 for CB 65 and on IRAS 175030833 for CB 101. (0,0) means that only the central spectrum was used. | gg width at half maximum, obtained from a Gaussian fit to the line. Uncertainties are 2 , and represent the error in the Gaussian fit. | hhVelocity integrated mean brightness temperature of the line. Uncertainties are 2 . |
|---|---|---|---|---|---|---|---|---|---|---|---|
| (MHz) | (km s-1) | (K) | (′′) | (K) | area ( ) | (km s-1) | (K km s-1) | ||||
| CB 65 | |||||||||||
| CO | 115271.2018 | IRAM-30m | 2.60 | 400 | 21 | 0.73 | 0.03 | (0,0) | |||
| 230538.0000 | IRAM-30m | 1.30 | 600 | 11 | 0.52 | 0.3 | (0,0) | ||||
| CB 101 | |||||||||||
| 13CO | 110201.3541 | IRAM-30m | 0.05 | 270 | 22 | 0.74 | 1.510.23 | (0,0) | 0.440.04 | 0.610.16 | |
| 220398.6765 | IRAM-30m | 0.05 | 2700 | 11 | 0.54 | 1.10.5 | 22 | 0.240.09 | 0.270.21 | ||
| C18O | 109782.1734 | IRAM-30m | 0.05 | 290 | 22 | 0.74 | 0.10 | 22 | |||
| 219560.3568 | IRAM-30m | 0.05 | 1300 | 11 | 0.54 | 0.4 | 22 | ||||
| CO | 115271.2018 | IRAM-30m | 0.05 | 400 | 21 | 0.73 | 6.30.6 | (0,0) | 0.860.03 | 5.70.7 | |
| 230538.0000 | IRAM-30m | 0.05 | 600 | 11 | 0.52 | 6.61.0 | (0,0) | 0.950.05 | 6.41.5 | ||
| SiO | 86846.9600 | IRAM-30m | 0.07 | 700 | 28 | 0.77 | 0.7 | (0,0) | |||
| CS | 97980.9500 | IRAM-30m | 0.06 | 270 | 25 | 0.76 | 0.11 | 22 | |||
| 244935.6435 | IRAM-30m | 1.22 | 500 | 10 | 0.49 | 0.4 | (0,0) | ||||
| CCS | 22344.0330 | Robledo-70m | 0.05 | 60 | 41 | 0.38 | 0.5 | (0,0) | |||
| NH3 | (J,K)=(1,1) | 23694.4955 | Robledo-70m | 0.50 | 90 | 39 | 0.35 | 0.14 | 1.71.7 |
| Flux density | |
|---|---|
| () | (Jy) |
| 1.25 | 0.48 |
| 1.65 | 0.82 |
| 2.17 | 0.82 |
| 12 | 0.42 |
| 25 | 0.28 |
| 60 | 0.42 |