A Search for Nitrogen-Enhanced Metal-Poor Stars11affiliation: Based on observations obtained at Cerro Tololo Inter-American Observatory and Kitt Peak National Observatory, a division of the National Optical Astronomy Observatories, which are operated by the Association of Universities for Research in Astronomy, Inc. under cooperative agreement with the National Science Foundation.
Abstract
Theoretical models of very metal-poor intermediate-mass Asymptotic Giant Branch (AGB) stars predict a large overabundance of primary nitrogen. The very metal-poor, carbon-enhanced, s-process-rich stars, which are thought to be the polluted companions of now-extinct AGB stars, provide direct tests of the predictions of these models. Recent studies of the carbon and nitrogen abundances in metal-poor stars have focused on the most carbon-rich stars, leading to a potential selection bias against stars that have been polluted by AGB stars that produced large amounts of nitrogen, and hence have small [C/N] ratios. We call these stars Nitrogen-Enhanced Metal-Poor (NEMP) stars, and define them as having [N/Fe] and [C/N] . In this paper, we report on the [C/N] abundances of a sample of 21 carbon-enhanced stars, all but three of which have . If NEMP stars were made as easily as Carbon-Enhanced Metal-Poor (CEMP) stars, then we expected to find between two and seven NEMP stars. Instead, we found no NEMP stars in our sample. Therefore, this observational bias is not an important contributor to the apparent dearth of N-rich stars. Our [C/N] values are in the same range as values reported previously in the literature ( to ), and all stars are in disagreement with the predicted [C/N] ratios for both low-mass and high-mass AGB stars. We suggest that the decrease in [C/N] from the low-mass AGB models is due to enhanced extra-mixing, while the lack of NEMP stars may be caused by unfavorable mass ratios in binaries or the difficulty of mass transfer in binary systems with large mass ratios.
Subject headings:
nuclear reactions, nucleosynthesis, abundances–stars: abundances–stars: AGB and post-AGB–stars:carbon–stars: Population II1. Introduction
Very Metal-Poor (VMP) stars ()111We adopt the usual spectroscopic notation that [A/B] log10(NA/NB)⋆ – log10(NA/NB) ⊙, and log (A) log10(NA/NH) + 12.0, for elements A and B. provide essential tools for the study of element production in stars and galactic chemical processing during the early stages of the evolution of our Galaxy. The number of VMP stars with measured elemental abundance ratios has been increasing rapidly in the past decade. The large modern surveys for metal-poor stars, most importantly the HK survey of Beers and colleagues (Beers et al., 1992; Beers, 1999) and the Hamburg/ESO Survey (HES) of Christlieb and collaborators (Christlieb, 2003), have produced medium-resolution confirmation spectra of many thousands of metal-poor candidates; the most interesting of these have been (and are being) followed up with high-resolution spectroscopic studies on large-aperture telescopes (e.g. Cayrel et al., 2004; Honda et al., 2004a; Johnson & Bolte, 2004; Barklem et al., 2005).
One of the most important discoveries of these new surveys is that at least 20 % of all VMP stars exhibit conspicuous enrichments of the CNO elements, most notably C (Beers & Christlieb, 2005; Lucatello et al., 2006). These Carbon-Enhanced Metal-Poor (CEMP) stars are defined by Beers & Christlieb as metal-poor stars with . Many of the CEMP stars exhibit overabundances of the elements associated with s-process nucleosynthesis. Aoki et al. (2003) estimate this fraction to be between 70 % and 80 %; Beers & Christlieb refer to these as the CEMP-s stars. The observed abundance patterns for CEMP-s stars suggest nucleosynthetic origin in low- or intermediate-mass stars that have evolved through the thermally pulsing asymptotic giant branch (AGB) phase, and later transferred this processed material to a surviving low(er)-mass companion. In this sense the CEMP-s stars are the metal-poor analogs of the classical CH stars (Keenan, 1942). The AGB star that originally enriched the presently observed companion VMP star is now a white dwarf; its presence is often revealed by tell-tale radial-velocity variations observed for the companion star. Based on the still-limited numbers of CEMP-s stars for which sufficient multi-epoch spectroscopic data has been obtained, a % binary fraction is possible (Lucatello et al., 2005). It is thus expected that the large overabundances of a number of elements observed in CEMP-s stars should reflect the AGB nucleosynthetic yields, perhaps with some modification due to giant-branch evolution of the companion.
In all AGB stars C is produced by the triple- reaction in He-shell flashes and convectively dredged up into the stellar envelope. For stars of low initial mass (2–3 ), this eventually leads to a C-rich composition, with . In these models N is not enhanced because it is burned during the He-shell flash. During the interpulse phase the convective envelope has no mixing connection with the H-shell, according to standard models, and no alteration of N is expected. For larger masses (, depending on metallicity) the efficiently dredged up carbon is transformed into N by the hot-bottom burning (HBB) process (Lattanzio, 1992; Boothroyd et al., 1993; Forestini & Charbonnel, 1997; Herwig, 2004a; Ventura & D’Antona, 2005). As a result, the models predict small C/N ratios in the stellar envelope ().
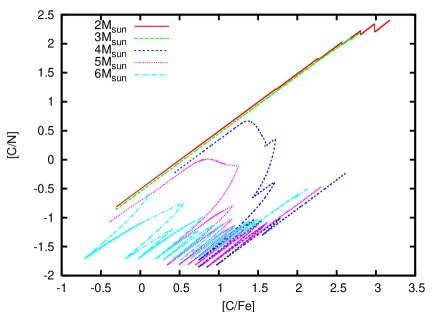
Simulations of low- and intermediate-mass stellar evolution confirm that the well-established trends of C and N production in solar-metallicity AGB stars extend to very low metallicity (Herwig, 2004b). The amount of N produced is independent of the initial metallicity of the star, because it is based on the primary production of C in the He-burning shell. Therefore, HBB in intermediate-mass VMP AGB stars provides a primary source of nitrogen in the early Universe. Figure 1 shows the evolution of [C/N] ratios on the surface of metal-poor AGB stars from the models of Herwig (2004b). Two effects are immediately clear: (1) a lower predicted [C/N] ratio in more massive AGB stars, and (2) a lower predicted [C/Fe] on the surfaces of these same stars.
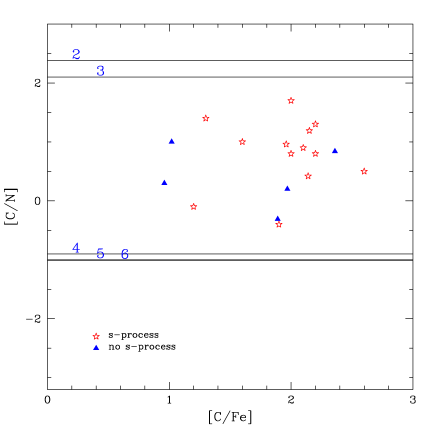
The predicted time-averaged yields for AGB stars are shown in Figure 2. In this Figure we also plot [C/N] ratios for CEMP stars that were available in the literature when we began this project. We would expect that at least one-third of the stars should have been polluted by intermediate-mass AGB stars, assuming (1) stars between 3.5 M⊙ and 7.5 M⊙ undergo HBB, (2) stars between 1.0 M⊙ and 7.5 M⊙ produce enough C to enhance their companions during mass transfer, and (3) the binary mass ratios from Pinsonneault & Stanek (2006) are correct for low-metallicity stars. It is evident that the observed [C/N] ratios in CEMP stars do not fit the predictions of either the low-mass or the intermediate-mass AGB models, but instead fall in an intermediate regime that is not covered by the models.
We are left with two questions. First, why do the observations of stars with large [C/Fe] show larger N (smaller [C/N]) than predicted by models for the evolution of 2–3 stars? This problem is reminiscent of the high N abundances observed in the moderately metal-poor CH stars, and may be related to mixing processes that are not accounted for in models of AGB evolution (Vanture, 1992). This issue will be discussed later in this paper. Second, where are the VMP stars that were, in the context of the mass-transfer scenario, polluted by the N-rich 3.5–7.5 stars? The solution for this problem is less obvious. The HBB responsible for the very efficient production of N in intermediate-mass stars is a robust prediction of stellar-evolution models. If the binary mass-transfer scenario is invoked for the CEMP-s stars with , then one may ask why there are no NEMP stars with , as might be expected to arise from systems in which the donor is a more massive HBB AGB star. Before considering possible solutions to this second problem we need to test one obvious possibility, that the absence of NEMP stars among previously analysed VMP stars may be simply the result of a selection bias against their detection.
Because of the requirement for large-aperture telescopes in order to obtain high-resolution, high- spectra of the CEMP stars in the HK and HES, only a limited number of these objects have been observed to date. Special attention has been focused on the subsample of CEMP stars that are likely to be the most iron-poor and/or carbon-rich (e.g. Norris et al., 1997; Aoki et al., 2002d). This may have led to an observational bias against the discovery of NEMP stars. The CH features at 4305 Å are routinely covered in the medium-resolution spectroscopic follow-up of metal-poor candidates from the HK survey and the HES; thus, CEMP stars are readily identified and placed on target lists for examination at high resolution. However, N-rich stars are not so easily recognized. The medium-resolution confirmation spectra generally extend no bluer than about 3600 Å; the only N-sensitive feature included in this range is the CN band at 3850 Å, which requires large enhancements of both C and N to be strong. As a result, the majority of stars in the current literature with detailed studies of their elemental abundance patterns are those with , i.e., they are more C-rich than they are N-rich. Thus, the lack of stars with could well be an observational selection effect, especially since the lower C-enhancements predicted in intermediate-mass AGB stars would make their companions potentially less C-rich, and hence less likely to be followed up at high spectral-resolution.
Previous low-resolution surveys of metal-poor () dwarf stars that included the blue NH band have discovered some stars with stronger than average nitrogen abundances, including HD 74000 and HD 160617 (Bessell & Norris, 1982), HD 97916 and HD 166913 (Laird, 1985) and HD 25329 (Carbon et al., 1987). Higher-resolution follow-up studies (e.g., Beveridge & Sneden, 1994; Mashonkina et al., 2003) have shown that these stars are somewhat s-process rich (). They do not appear to be C-enhanced, however, and their binary status is not confirmed. These stars are probably related to the phenomenon discussed here, but we confine ourselves in the rest of the paper to the discussion of CEMP stars found in recent surveys.
We have undertaken a medium-resolution observing campaign to address the question of whether observational selection biases might be responsible for the lack of known NEMP stars. We examine a sample of VMP stars with moderate carbon enhancements, (based on their medium-resolution confirmation spectra), in order to better constrain the range of the N enhancements in these stars, and to see if the N abundances obtained agree better with expectations based on AGB models. This is accomplished using near-UV medium-resolution spectroscopy that covers the region of the NH band at 3360–3370 Å for a sample of 21 moderately carbon-enhanced metal-poor stars, along with a number of similar stars from the literature with available high-resolution results. In § 2 we describe our sample selection criteria, observations, and data reduction procedures. Details of our abundance analysis for this sample are provided in § 3. In § 4 we summarize our results. A discussion of the theoretical expectations and a comparison with our present results is provided in §5.
2. Observations and Data Reduction
2.1. Sample Selection
We wished to observe a sample of stars with and [C/Fe] between and . Our primary source of targets was the list of [Fe/H] and [C/Fe] values for the HK survey stars calibrated by Rossi et al. (2005). We also added stars from the Beers, Preston, & Shectman (1992) list of stars with abnormally strong G-bands (their Table 8). To compare our derived abundances with those obtained from higher-resolution spectra, we also took spectra of some well-known bright metal-poor HD and BD stars, as well as three stars from the HK survey, namely CS 22892-052, CS 22968-014, and CS 22950-46. These three are not part of our C-enhanced sample either, because they are known to be r-process-rich and probably polluted by a different mechanism altogether (CS 22892-052) or are not C-enhanced (CS 22968-014 and CS 22950-048). Ideally, all of our stars would be subgiant or main-sequence stars, to avoid possible alterations in the surface C and N abundances due to CN processing and mixing on the red giant branch, which can result in decreasing C and increasing N abundances (Gratton et al., 2000; Spite et al., 2005). However, molecular features such as CH and NH are much weaker in hotter stars, so we decided to include giants in our list. Any CN cycling that might have operated would serve to increase the N abundances, and therefore bias the study toward finding more NEMP stars than would otherwise be the case. This turned out not to be a concern in the final analysis.
2.2. Observations
To observe the NH band we require near-UV sensitivity, however, a resolution of – Å is more than adequate. The RC spectrographs at Kitt Peak National Observatory and at Cerro Tololo Interamerican Observatory have these capabilities, allowing us to observe both northern and southern hemisphere targets. We observed 8 stars at KPNO over three nights from 30 Aug to 1 Sep 2003. We employed the BL420 grating and the CuS04 order blocking filter. This produced a wavelength coverage of 3250 Å to 4700 Å with a resolution of 2.0Å. The F3B chip was used, with a gain setting of 2.3 e-/ADU, and a read noise of 7.5 e-. The dispersion was 0.76Å/pix. A quartz lamp with a BG3 blocking filter was used to obtain flatfields, and the FeAr lamp was used for wavelength calibration. We also observed 20 stars over 6 nights at CTIO in two observing sessions: 6–8 Sep 2003 and 26–28 Nov 2004. Some part of each run was lost to weather. We used the RC Spectrograph with the blue collimator, the KPGL1 grating, and the CuSO4 order-blocking filter. We adopted Decker 2, which provided a 1 arcsec slit. This produced a wavelength coverage of 3250 Å to 4700 Å with a resolution of 2.5 Å. The gain setting was 1.94 e-/ADU, and the read noise was 7.5 e-. The dispersion was 0.95Å/pix. A helium-neon-argon lamp was used for wavelength calibration for these data. The second run at CTIO (26–28 Nov 2004) was plagued by large amounts of scattered light in the spectra. Although the scattered light was subtracted, the Poisson noise from its presence reduced the around the NH band to –. We were still able to obtain useful upper limits on N, and therefore lower limits on [C/N], with these data. Table 1 present a summary of the observations. Figure 3 shows a typical spectrum obtained from these observations.
| Star | V | Telescope | Date of Obs. | Exposures | at Å |
|---|---|---|---|---|---|
| BD | 9.270 | CTIO | 2003 Sep 05 | 2600 | 192 |
| HD 122563 | 6.196 | KPNO | 2003 Aug 31 | 3200s | 267 |
| HD 160617 | 8.740 | CTIO | 2003 Sep 04 | 3600s | 207 |
| HD 186478 | 8.920 | CTIO | 2003 Sep 04 | 3600s | 425 |
| CS 22174-007 | 12.409 | CTIO | 2003 Aug 30 | 31800s | 142 |
| CS 22183-031 | 13.622 | CTIO | 2004 Nov 28 | 31200s | 17 |
| CS 22879-029 | 14.425 | CTIO | 2003 Sep 06 | 11200s,2900s | 117 |
| CS 22884-097 | 14.868 | CTIO | 2003 Sep 05 | 31200s | 33 |
| CS 22887-048 | 12.866 | KPNO | 2003 Aug 30 | 11800s,2900s | 123 |
| CS 22891-171 | 14.293 | CTIO | 2003 Sep 06 | 31200s | 58 |
| CS 22892-052 | 13.213 | CTIO | 2003 Sep 04 | 4600s | 115 |
| CS 22898-062 | 13.788 | KPNO | 2003 Aug 31 | 31800s | 71 |
| CS 22945-024 | 14.360 | CTIO | 2003 Sep 04 | 31200s | 55 |
| CS 22947-187 | 12.962 | CTIO | 2003 Sep 04 | 31200s | 117 |
| CS 22948-104 | 13.929 | CTIO | 2004 Nov 28 | 31200s | 17 |
| CS 22949-008 | 14.168 | KPNO | 2003 Aug 31 | 1600s 31800s | 95 |
| CS 22950-046 | 14.224 | KPNO | 2003 Aug 30 | 4 1800s | 45 |
| CS 22958-042 | 14.516 | CTIO | 2003 Sep 06 | 41200s | 42 |
| CS 22958-083 | 14.423 | CTIO | 2044 Nov 27 | 31200 | 17 |
| CS 22960-053 | 14.830 | CTIO | 2003 Sep 06 | 31200s | 40 |
| CS 22968-014 | 13.684 | CTIO | 2003 Sep 04 | 31200s | 80 |
| CS 29493-090 | 14.039 | CTIO | 2003 Sep 04 | 31200s | 57 |
| CS 29495-042 | 14.516 | CTIO | 2003 Sep 06 | 11200s 2900s | 67 |
| CS 29497-030 | 12.656 | CTIO | 2003 Sep 06 | 11200s,3600s | 134 |
| CS 29512-073 | 14.137 | KPNO | 2003 Aug 30 | 21800s,1900 | 66 |
| CS 30314-067 | 11.817 | CTIO | 2003 Sep 04 | 31200s | 122 |
| CS 31062-041 | 13.934 | KPNO | 2003 Aug 31 | 31800s | 53 |
| CS 31080-095 | 12.989 | CTIO | 2004 Nov 27 | 41200s | 17 |

2.3. Data Reduction
The data were reduced using IRAF222IRAF is distributed by the National Optical Astronomy Observatories, which are operated by the Association of Universities for Research in Astronomy, Inc., under cooperative agreement with the National Science Foundation.. The usual reduction procedures were applied: bias-subtraction, flat-fielding, spectral extraction, sky subtraction, and wavelength calibration. For most stars, with the exception of the observations in 2004, we achieved our desired of 50/1 per resolution element. The at the NH bandhead is listed in Table 1.
3. Abundance Analysis
We used the 2002 version of MOOG (Sneden, 1973) for our synthesis of the NH, CH and Ca II K regions. We interpolated the grids of Kurucz (2006a), using the models with overshooting, but without -enhancements or the new opacity distribution functions, because that grid was the most extensive at the lowest metallicities. For the accuracy we require in [C/N] at these low metallicities, our choice of model atmosphere grid is not a significant source of error.
3.1. Molecular and Atomic Data
We assembled linelists covering 3340–3400 Å for NH and 4270-4330 Å for CH. The atomic parameters are from the Vienna Line Database (Piskunov et al., 2000). The molecular line lists were in general adopted from Kurucz (2006b) and are discussed further below. We adopted the solar values of Anders & Grevesse (1989), with the exception of Fe, where we assume a solar value of . While the solar values of C and N have been the subject of much dispute in recent years (Asplund et al., 2005), in our case they merely represent scaling factors applied to both the yields from AGB stars of Herwig (2004b), and to our derived for C and N from these stars.
3.1.1 NH
We used the bandhead for the A-X (0-0) and (1-1) transition at 3360 Å and 3370 Å, respectively. The only important isotope is 14N, because the 14N/15N ratio is wherever it has been measured (Chin et al., 1999). The wavelengths of NH from Kurucz (2006b) are in excellent agreement with the laboratory wavelengths measured by Brazier et al. (1986) for the regions near the NH bandhead. However, Shavrina et al. (1996) pointed out that the Kurucz gf-values were too high by a factor of two. Therefore, we have adopted Kurucz wavelengths, but divide his oscillator strengths by this factor. These gf-values are then on the same scale as those of Sneden (1973).
Conflicting values for the dissociation potential of NH exist in the literature. Seal & Gaydon (1966) measured eV. More recent experiments have found higher values. Graham & Lew (1978) measured eV, while Tarroni et al. (1997) measured eV. With these results in mind, we have adopted 3.45 eV, close to the value used by Spite et al. (2005) in their study of C, N and O abundances in VMP stars.
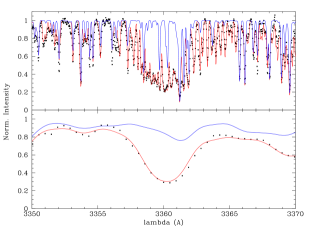
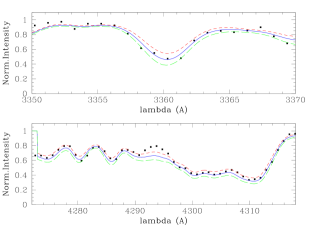
Our linelist in the NH region is illustrated in Figure 4. We first show the fit to a high-resolution spectrum of the metal-poor star HD 186478 from Johnson (2002) and then to the lower-resolution spectrum taken for this study.
If we used a dissociation potential of eV instead of eV, our derived N abundances would increase by dex. If we used the uncorrected Kurucz gf-values, our abundances would decrease by a similar amount. The lack of agreement among different studies on the dissociation potential and oscillator strengths is a major source of the differences in the derived C and N abundances in the present literature. Fortunately, these issues are dwarfed by the dex difference we hope to observe.
3.1.2 CH
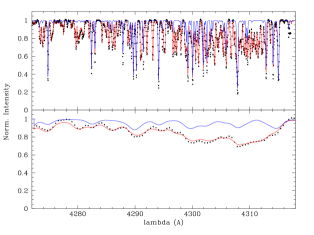
Our analysis of the carbon abundances for program stars used the CH G band feature. Again, we used the Kurucz line list for this region. The wavelengths and oscillator strengths agreed well with the more limited lists of wavelengths from Zachwieja (1995, 1997) and oscillator strengths from LIFBASE (Luque & Crosley, 1996). Theoretical models predict different 12C/13 ratios for AGB stars of different masses, ranging from for 2 M⊙ to for 6 M⊙. The G band contains both 12CH and 13CH lines. However in our low-resolution spectra, these lines are intermingled to such an extent that if the total carbon abundance does not change, our synthesis of the G-band remains essentially independent of the carbon isotope ratios. We adopted a value of 80 for our synthesis. Figure 5 shows the fit in the G-band region for HD 186478.
3.1.3 C and N Abundances from Different Molecular Species
Most studies of metal-poor stars measure the N abundance from the blue CN system near 3870–3880 Å, as this wavelength region is usually covered in the setups used for medium-resolution spectroscopy. Spite et al. (2005) were able to work with high-resolution spectra of metal-poor stars that covered both the NH and CN features. They found that the NH lines consistently yielded dex higher N abundances than those obtained from the CN lines. The source of the disagreement is unclear (and we do not resolve it here), but note that our N abundances (derived from NH) would be lower by 0.3 dex if the CN abundance scale were the correct one. Literature sources also derive C abundances from both the C2 and the CH features. Aoki et al. (2002a) measured a higher C abundance, by 0.2 dex, in the subgiant LP 625-44 from the C2 lines as compared to the CH feature. These differences could result in systematic offsets in C or N abundances; however, their magnitude is smaller than the size of the expected [C/N] range. Where necessary for our discussion, we thus adopt literature C and N values as stated, selecting C from CH and N from NH whenever possible.
3.2. Model Atmosphere Parameters
We used broadband photometry, provided by either Beers et al. (2006) or taken from the SIMBAD listing, to derive Teff and isochrones to derive gravities. We also took advantage of the well-known correlation between log and for estimation of microturbulent velocities, as described below. Finally, we synthesized the Ca II K line to determine the appropriate metallicity. We discuss additional details and comparisons with other methods of deriving model atmosphere parameters below.
| Star | V | B-V | U-B | V-R | V-I | V-J | V-K | E(B-V) |
|---|---|---|---|---|---|---|---|---|
| BD | 9.270 | 9.270 | 0.910 | 0.230 | 0.530 | 2.068 | 2.715 | 0.17 |
| HD 122653 | 6.196 | 0.912 | 0.340 | 0.580 | … | 1.815 | 2.473 | 0.02 |
| HD 160617 | 8.740 | … | … | … | … | 1.112 | 1.429 | 0.01 |
| HD 186478 | 8.920 | 0.930 | … | … | … | 1.803 | 2.477 | 0.10 |
| CS 22174-007 | 12.409 | 0.694 | … | 0.448 | 0.900 | 1.524 | 2.091 | 0.03 |
| CS 22183-031 | 13.622 | 0.673 | … | 0.444 | 0.898 | 1.511 | 2.040 | 0.04 |
| CS 22884-097 | 14.868 | 0.579 | … | 0.407 | 0.849 | 1.401 | 1.742 | 0.23 |
| CS 22887-048 | 12.866 | 0.389 | … | 0.278 | 0.556 | 0.901 | 1.192 | 0.05 |
| CS 22879-029 | 14.425 | 0.420 | … | 0.280 | 0.604 | 1.000 | 1.299 | 0.04 |
| CS 22891-171 | 14.293 | 0.872 | … | 0.485 | 0.918 | 1.522 | 2.030 | 0.07 |
| CS 22892-052 | 13.213 | 0.800 | … | 0.491 | 0.990 | 1.721 | 2.284 | 0.03 |
| CS 22898-062 | 13.788 | 0.627 | … | 0.420 | 0.840 | 1.439 | 1.937 | 0.05 |
| CS 22945-024 | 14.360 | 0.722 | 0.006 | … | … | 1.450 | 1.926 | 0.03 |
| CS 22947-187 | 12.962 | 0.648 | … | 0.454 | 0.877 | 1.494 | 1.934 | 0.09 |
| CS 22948-104 | 13.929 | 0.604 | … | 0.410 | 0.821 | 1.431 | 1.917 | 0.02 |
| CS 22949-008 | 14.168 | 0.494 | … | 0.310 | 0.623 | 1.045 | 1.380 | 0.04 |
| CS 22950-046 | 14.224 | … | … | 0.585 | 1.158 | 1.974 | 2.641 | 0.06 |
| CS 22958-042 | 14.516 | 0.479 | … | 0.294 | 0.614 | 1.001 | 1.303 | 0.02 |
| CS 22958-083 | 14.423 | 0.664 | 0.030 | 0.442 | 0.902 | 1.477 | 2.029 | 0.04 |
| CS 22960-053 | 14.830 | 0.760 | 0.100 | … | … | 1.532 | 2.069 | 0.01 |
| CS 22968-014 | 13.684 | 0.755 | … | 0.472 | 0.969 | 1.658 | 2.217 | 0.01 |
| CS 29493-090 | 14.039 | 0.835 | … | 0.516 | 1.028 | 1.740 | 2.366 | 0.03 |
| CS 29495-042 | 13.607 | 0.626 | … | 0.415 | 0.825 | 1.261 | 1.737 | 0.03 |
| CS 29497-030 | 12.656 | 0.299 | … | 0.215 | 0.440 | 0.694 | 0.911 | 0.02 |
| CS 29527-048 | 14.833 | 0.455 | … | 0.314 | 0.632 | 1.046 | 1.356 | 0.02 |
| CS 29512-073 | 14.137 | 0.568 | … | 0.377 | 0.753 | 1.235 | 1.624 | 0.05 |
| CS 30314-067 | 11.817 | 1.123 | … | 0.642 | 1.234 | 2.058 | 2.789 | 0.07 |
| CS 31062-041 | 13.934 | 0.820 | … | 0.458 | 0.950 | 1.545 | 2.113 | 0.03 |
| CS 31080-095 | 12.989 | 0.521 | 0.291 | 0.317 | 0.617 | 1.050 | 1.394 | 0.01 |
3.2.1 Teff
We used the color-Teff relations from Alonso et al. (1996, 1999). Accurate photometry for our targets in Johnson , and Kron-Cousins was obtained as part of an ongoing program of observing metal-poor stars (Beers et al., 2006). Near-IR magnitudes were retrieved from the 2MASS catalog (Skrutskie et al., 2006). Table 2 lists the available photometry. We have adopted reddening values from Schlegel et al. (1998). Almost all our targets have distances kpc, much larger than the 110 pc scale height of the dust (Mendez & van Altena, 1998), hence the assumption that all the reddening is between us and the star is appropriate. For the more nearby stars, we calculated the correct amount of reddening to use based on the model of Mendez & van Altena (1998) (their Equation 4), iterating until the following quantities converged: assumed reddening based on distance from Sun, Teff from , log and MV from isochrones, and finally distance from MV. This required between one and three cycles.
We adopt the temperature because it is independent of metallicity and not strongly affected by carbon molecular features, contrary to the way that bluer colors, such as , have been shown to behave (e.g. Preston & Sneden, 2001; Cohen et al., 2006). A comparison of Teff with temperatures derived from other colors shows an average offset of by 53 K, by 60 K, by 95 K and by 74 K. The higher temperatures for compared to and are expected if carbon absorption in the blue bands makes the stars appear redder than the non C-rich calibration sample. A comparison with literature values for our sample (Table 4) shows that our Teff estimates are hotter, on average, by 60 K, with an rms scatter of 150 K. A reasonable random error for our Teff determinations is therefore 150 K.
3.2.2 log
We adopted the (, ), 14 Gyr isochrone from Bergbusch & VandenBerg (2001). Note that the age is unimportant as long as it is greater than Gyr. In choosing a log for a given Teff, we assume that the star is a turnoff, subgiant, or giant star, as appropriate for its location on the isochrone. In general, this assumption is a good one. However, a few stars could be horizontal-branch stars, and, indeed, a high-resolution analysis by McWilliam et al. (1995a) showed that CS 22947-187 has the lower gravity of a red horizontal-branch star, , compared to our value of . We recalculated the abundances using the log and value of McWilliam et al. (1995a). The derived [Ca/H] did not change, while the and the increased by 0.9 dex and 0.80 dex, respectively. The [C/N] ratio, however, changed by a mere 0.10 dex. Thus, for the small subset of stars which we may mistakenly classify as subgiants rather than horizontal-branch stars, the change in [C/N], the crucial aspect of this paper, is smaller than that which could arise from other sources of error.
The major uncertainty in estimation of log for almost all stars is the uncertainty in Teff, because a change of K leads to a change of dex in log for a turnoff star, dex for a subgiant and dex for a giant. A comparison with literature values (Table 4) yields an average difference of dex with an rms scatter of dex. Therefore, we adopt a log error of dex for turnoff and subgiant stars and dex for giants, respectively.
3.2.3 Microturbulent velocity
Our abundances derived from lower dispersion data are not very sensitive to , the microturbulent velocity, but it still needs to be known to within . Fortunately, there exists a well-known correlation between log and . The HERES collaboration (Barklem et al., 2005) measured for 254 metal-poor stars from high-resolution spectra. We fit their log and values with a second-order polynomial and use the relation for our sample:
| (1) |
This equation is valid for the range of surface gravities exhibited by stars in the HERES sample , which encompasses the expected range of surface gravity for our program stars. The HERES data exhibit an rms scatter of 0.17 km s-1 around this relation. We tested changes of km s-1 and found no change in our synthesis; therefore uncertainties in do not contribute significantly to our final abundance errors.
3.2.4 [Fe/H]
We require an estimate of [Fe/H] for two reasons, most importantly to have the correct metallicity atmospheric model, and secondly in order to measure the [C/Fe] ratio associated with the overall enhancement from AGB-star pollution. For these purposes, an accuracy of dex is sufficient. Test syntheses of the NH and CH features and the Ca II K lines revealed only a small ( dex) dependence of these quantities on the metallicity of the model atmosphere. Furthermore, the carbon-enhanced nature of these stars has already been established by larger-scale surveys with many stars to provide a control sample. The lack of dependence on the overall metallicity of the model is fortunate, as we did not use carbon-enhanced models, in keeping with most of the previous work in the field. Masseron (2005, priv. comm.) has shown that errors on the abundances from neglecting C-enhancement is mitigated in the hotter, less C-rich stars that comprise our present sample.
We first measured [Ca/H] using the CaII K line that is prominent in all of our medium-resolution spectra, regardless of temperature and metallicity. The linelist for this exercise was taken from Castelli & Kurucz (2003). We then converted to [Fe/H] using an assumed [Ca/Fe] ratio of dex, the average [Ca/Fe] ratio determined by Cayrel et al. (2004) in their sample of non carbon-enhanced metal-poor stars.
| Star | EB-V (mag) | Teff (K) | logg | [m/H] | (km/s) |
|---|---|---|---|---|---|
| BD | 0.17 | 4806 | 1.72 | 2.89 | 1.91 |
| HD 122653 | 0.02 | 4615 | 1.27 | 2.47 | 2.10 |
| HD 160617 | 0.01 | 5882 | 3.69 | 1.69 | 1.45 |
| HD 186478 | 0.10 | 4831 | 1.78 | 2.63 | 1.89 |
| CS 22174-007 | 0.03 | 5059 | 2.37 | 2.00 | 1.69 |
| CS 22183-031 | 0.04 | 5196 | 2.76 | 2.79 | 1.59 |
| CS 22879-029 | 0.04 | 6300 | 3.90 | 1.93 | 1.43 |
| CS 22884-097 | 0.23 | 6460 | 4.00 | 1.94 | 1.43 |
| CS 22887-048 | 0.05 | 6455 | 3.99 | 2.22 | 1.43 |
| CS 22891-171 | 0.07 | 5297 | 3.07 | 2.45 | 1.52 |
| CS 22892-052 | 0.03 | 4861 | 1.86 | 2.76 | 1.86 |
| CS 22898-062 | 0.05 | 5309 | 3.10 | 1.74 | 1.52 |
| CS 22945-024 | 0.03 | 5289 | 3.04 | 2.26 | 1.53 |
| CS 22947-187 | 0.09 | 5489 | 3.44 | 2.25 | 1.47 |
| CS 22948-104 | 0.02 | 5270 | 2.99 | 2.39 | 1.54 |
| CS 22949-008 | 0.04 | 6144 | 3.82 | 1.92 | 1.44 |
| CS 22950-046 | 0.06 | 4604 | 1.25 | 3.29 | 2.11 |
| CS 22958-042 | 0.02 | 6224 | 3.86 | 2.65 | 1.44 |
| CS 22958-083 | 0.04 | 5189 | 2.74 | 2.50 | 1.59 |
| CS 22960-053 | 0.01 | 5061 | 2.38 | 3.08 | 1.68 |
| CS 22968-014 | 0.01 | 4892 | 1.93 | 3.30 | 1.83 |
| CS 29493-090 | 0.03 | 4739 | 1.56 | 2.82 | 1.97 |
| CS 29495-042 | 0.03 | 5400 | 3.32 | 2.30 | 1.49 |
| CS 29497-030 | 0.02 | 7163 | 4.20 | 2.20 | 1.43 |
| CS 29512-073 | 0.05 | 5751 | 3.62 | 2.10 | 1.45 |
| CS 30314-067 | 0.07 | 4476 | 0.96 | 2.67 | 2.25 |
| CS 31062-041 | 0.03 | 5042 | 2.32 | 2.30 | 1.70 |
| CS 31080-095 | 0.01 | 5972 | 3.73 | 2.75 | 1.44 |
Several of our targets have been observed at high spectral resolution by previous authors. These include some of the most C-rich stars in our sample, as well as three bright metal-poor stars (HD 122563, HD 186478 and BD) that we observed in order to compare with previous results. In Table 4, we compare our model atmosphere parameters with values taken from the literature, restricting ourselves to recent papers in the case of the HD and BD stars. In general, our model atmospheres have somewhat higher Teff and higher log values. Our [Fe/H] values are also higher, which is expected based on the differences in model atmospheres.
In order to test this, and to show that our [Fe/H] values derived from Ca II K are good to within about 0.15 dex, we studied a subsample of the stars that had equivalent widths (EWs) based on high-resolution spectra available in the literature. These EWs were run through our analysis, adopting our model atmosphere parameters; the results are shown in Table 3.2.4. The [Fe/H] derived from the CaII K line, with an assumed [Ca/Fe] of , is in good agreement with the [Fe/H] derived from the EWs of Fe I lines, except for CS 22183-031, whose [Fe/H] in our analysis is 0.4 dex higher than in the EW analysis. The abundance ratios of [Ca/Fe], [Mg/Fe], [Ti/Fe] and [Fe II/Fe I] are also quite reasonable, although our higher adopted gravity for CS 22947-187 means that we derive much higher abundances for the ionized species than for the neutral species. From Table 3.2.4, we conclude that basing our model atmosphere metallicities on the Ca II K line results in an offset of dex with a rms scatter of dex, which is in line with the expected uncertainty due to our fits of the Ca II K region. Our final model atmosphere parameters are summarized in Table 3.
| Star | Teff | log g | [m/H] | Source | |
|---|---|---|---|---|---|
| BD | 4750 | 1.4 | 3.06 | 1.80 | Cayrel et al. (2004) |
| 4806 | 1.72 | 2.89 | 1.91 | This study | |
| HD 122563 | 4600 | 1.10 | 2.82 | 2.00 | Cayrel et al. (2004) |
| 4500 | 1.30 | 2.74 | 2.5 | Westin et al. (2000) | |
| 4615 | 1.27 | 2.47 | 2.10 | This study | |
| HD 160617 | 5967 | 3.79 | 1.77 | 1.50 | Jonsell et al. (2005) |
| 5931 | 3.77 | 1.79 | 1.50 | Akerman et al. (2004) | |
| 5999 | 3.74 | 1.36 | 1.31 | Gratton et al. (2000) | |
| 5882 | 3.69 | 1.69 | 1.45 | This study | |
| HD 186478 | 4700 | 1.30 | 2.59 | 2.00 | Cayrel et al. (2004) |
| 4831 | 1.78 | 2.63 | 1.89 | This study | |
| CS 22183-031 | 5270 | 2.8 | 2.93 | 1.20 | Honda et al. (2004b) |
| 5196 | 2.76 | 2.79 | 1.59 | This study | |
| CS 22892-052 | 4850 | 1.50 | 2.97 | 2.50 | Norris et al. (1997) |
| 4790 | 1.60 | 2.92 | 1.80 | Honda et al. (2004b) | |
| 4850 | 1.60 | 3.03 | 1.90 | Cayrel et al. (2004) | |
| 4760 | 1.30 | 3.10 | 2.29 | McWilliam et al. (1995a) | |
| 4861 | 1.86 | 2.76 | 1.86 | This study | |
| CS 22947-187 | 5160 | 1.30 | 2.6 | 2.26 | McWilliam et al. (1995a) |
| 5489 | 3.44 | 2.25 | 1.47 | This study | |
| CS 22950-046 | 4640 | 0.85 | 3.5 | 2.68 | McWilliam et al. (1995a) |
| 4730 | 1.30 | 3.30 | 2.02 | Carretta et al. (2002) | |
| 4604 | 1.25 | 3.29 | 2.11 | This study | |
| CS 22958-042 | 6250 | 3.50 | 2.85 | 1.50 | Sivrani et al. (2006) |
| 6224 | 3.86 | 2.65 | 1.44 | This study | |
| CS 22968-014 | 4840 | 1.80 | 3.5 | 1.90 | McWilliam et al. (1995a) |
| 4850 | 1.70 | 3.56 | 1.90 | Cayrel et al. (2004) | |
| 4892 | 1.93 | 3.30 | 1.83 | This study | |
| CS 29497-030 | 6650 | 3.50 | 2.80 | 2.00 | Sivarani et al. (2004) |
| 7000 | 4.10 | 2.57 | 1.90 | Ivans et al. (2005) | |
| 7163 | 4.20 | 2.20 | 1.43 | This study | |
| CS 30314-067 | 4400 | 0.70 | 2.85 | 2.50 | Aoki et al. (2002d) |
| 4476 | 0.96 | 2.67 | 2.25 | This Study | |
| CS 31085-090 | 6050 | 4.50 | 2.85 | 1.00 | Sivrani et al. (2006) |
| 5972 | 3.73 | 2.75 | 1.44 | This study |
| Our Synthesis | Abundances Derived with Literature EWs and Our Model Atmospheres | |||||||||
|---|---|---|---|---|---|---|---|---|---|---|
| Star | [Ca II/H] | [Fe/H] | [Ca I/H] | [Fe I/H] | [Ca I/Fe I] | [Mg I/Fe I] | [Ti I/Fe I] | [Ti II/Fe I] | [Fe II/Fe I] | EW Source |
| CS 22183-031 | 2.49 | 2.79 | 2.76 | 3.19 | 0.43 | 0.72 | 0.68 | 0.58 | 0.13 | 1 |
| CS 22947-187 | 1.95 | 2.25 | 1.77 | 2.11 | 0.34 | 0.44 | 0.30 | 0.96 | 0.59 | 2 |
| CS 22892-052 | 2.46 | 2.76 | 2.65 | 2.94 | 0.30 | 0.46 | 0.20 | 0.16 | 0.00 | 3 |
| CS 22950-046 | 2.99 | 3.29 | 3.23 | 3.46 | 0.23 | 0.63 | 0.19 | 0.22 | 0.00 | 4 |
| CS 22968-014 | 3.00 | 3.30 | 3.35 | 3.38 | 0.03 | 0.47 | 0.10 | 0.06 | 0.05 | 5 |
| CS 29497-030 | 1.90 | 2.20 | 1.85 | 2.30 | 0.45 | 0.66 | 0.65 | 0.47 | 0.15 | 6 |
| CS 30314-067 | 2.37 | 2.67 | 2.61 | 2.71 | 0.10 | 0.69 | 0.22 | 0.42 | 0.06 | 7 |
3.3. C and N Measurements and Upper Limits
We measured C and N abundances by creating a synthetic spectrum for each star and comparing it with the observed spectra (Figure 6). When the NH and CH regions were synthesized, the abundance ratios of [Mg/Fe], [Ca/Fe] and [Ti/Fe] were set to be , , and , based on the Cayrel et al. (2004) results for the enhancements in the -elements for metal-poor halo stars. Other elemental abundance ratios may also differ from solar in these stars, but their lines are either not strong or sufficiently plentiful to noticeably affect the synthesis. We calculated the molecular equilibrium among the species H2, CH, NH, OH, C2, CN, CO, N2, NO, O2, H2O, and CO2. Therefore, our derived C and N abundances could depend on the adopted O abundance. We set the [O/Fe] at (Fulbright & Kraft, 1999) in our syntheses, however the C and N abundances are not sensitive to the adopted [O/Fe] unless it exceeds , and then only at the – dex level. The synthesis of the NH band does not depend on the C abundance, which was one of the advantages of this program. The random uncertainty from continuum placement, , and imperfect line lists is estimated to be dex for the C, N and Ca syntheses based on by-eye fits to the data with different abundances and continuum placements.
Our resolution is sufficiently low that a determination of a lower limit on N for some of our program stars relies on the lowest point in the spectra in the region of the NH feature. We found a lower limit by selecting the lowest pixel value within a window Å wide, centered on the expected position of the maximum N absorption. The rms scatter was determined from the , and a 4- offset downward was added to that data point. Then, the lowest points in many NH syntheses were found, and interpolated in order to yield a lower limit on the N abundance.
3.4. Three-Dimensional and Non-LTE Effects
Three-dimensonial effects are likely to be very important in deriving correct C and N abundances. Preliminary calculations in red giant atmospheres for the NH lines at 3360 Å and the CH lines at 4305 Å indicate that the corrections can be as large as and dex, respectively (Garcia-Perez, priv. comm.) and 0.8 dex and larger for the most iron-poor stars (e.g. Collet et al., 2006). Because we are primarily concerned with [C/N] ratios in this paper, our results are not as sensitive to these corrections, and we ignore them for now. If 3-D corrections of this magnitude are applied to our [C/Fe] values, in many cases the values will drop below , and one might wonder if we still have a useful sample. However, in that case, [C/Fe] for metal-poor field stars in general will also drop by the same amount, and our stars will still be enriched relative to normal stars. Hence the assumption that C-enrichment is due to AGB stars still would stand.
3.5. Error Analysis
There are two major sources of error that we need to quantify. The first is the choice of molecular parameters, including the absolute oscillator strengths and dissociation potentials, which were discussed in § 3.1. The second is the choice of model atmosphere parameters, in particular Teff. Our samples includes stars with a wide range of effective temperature and gravity, therefore we selected three stars covering these ranges, CS 22887-042, CS 22947-187, and CS 29493-090, for the error analysis. The changes in for C, N and Ca are listed in Table 6. The dependence on and metallicity are much smaller than those for Teff and log , and hence will be ignored. The increase in with increasing temperature is offset by a decrease with increasing gravity when the actual model atmosphere parameters are used. To account for the expected correlations between error sources, we adopt the following equation:
| Star | log(C) | log(N) | log(Ca) | |||
|---|---|---|---|---|---|---|
| Teff | log | Teff | log | Teff | log | |
| K | dex | K | dex | K | dex | |
| CS 22887-048 | 0.250 | 0.125 | 0.325 | 0.125 | 0.125 | 0.000 |
| CS 22947-187 | 0.275 | 0.100 | 0.275 | 0.125 | 0.015 | 0.050 |
| CS 29493-090 | 0.310 | 0.125 | 0.300 | 0.225 | 0.100 | 0.025 |
| (2) |
where is the abundance error associated with the synthesis and is 0.2 dex. In this case, where log is derived from Teff, we write as
| (3) |
The slope of the log -Teff relation depends on the evolutionary state of the star. We found slopes of for the giant CS 29493-090, for the subgiant CS 22947-187, and for the turnoff star CS 29493-090. The errors in [X/H] were calculated using equation 2, while the the abundance ratio errors for [C/N], [C/Fe] and [N/Fe] were calculated using a modification of Equations A19 and A20 from McWilliam et al. (1995a). Our uncertainties for turnoff, subgiant, and giant stars are summarized in Table 7.
| Star | Teff range | (log(C)) | (log(N)) | (log(Fe)) | ([C/Fe]) | ([N/Fe]) | ([C/N]) |
|---|---|---|---|---|---|---|---|
| turnoff | TeffK | 0.30 | 0.36 | 0.24 | 0.31 | 0.35 | 0.31 |
| subgiant | KTeffK | 0.30 | 0.31 | 0.24 | 0.30 | 0.32 | 0.30 |
| giant | TeffK | 0.25 | 0.25 | 0.21 | 0.29 | 0.25 | 0.41 |
4. Results
The abundances of N and C, derived from the NH, CN, and CH lines, are listed in Table 8 and plotted in Figure 7. Twenty-one of the stars in our sample are C-mild to C-rich and are pertinent to the problem of the “missing” NEMP stars. The seven often-observed calibration stars (CS 22892-052, CS 22968-014, CS 22950-046 and the HD/BD stars) are not shown in Figure 7. It is clear from the low Teff of CS 22950-046 that its low [C/N] ratio is due to internal mixing (Gratton et al., 2000; Spite et al., 2005), and it is similar to the other low Teff calibration giants, HD 122563 and HD 186478.
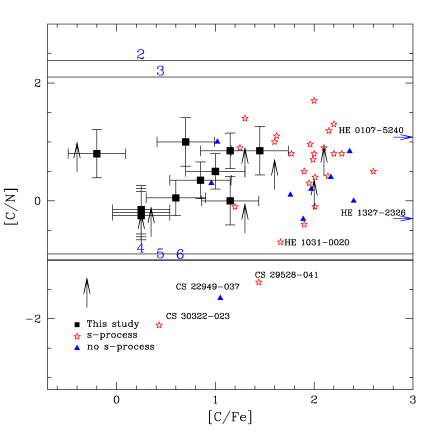
Two facts are immediately apparent from inspection of Figure 7. (1) We have mild C-enhancements for many stars in our sample, and have managed to fill in the region of the diagram and (2) our [C/N] values are not consistent with those expected to be produced by HBB in AGB stars, and indeed are rather similar to previous results. Therefore, it appears that an observational bias is not the solution to the scarcity of NEMP stars.
Table 9 lists our derived [C/Fe] and [C/N] ratios compared with available literature values for stars in common, while Table 10 lists the additional literature values used in Figure 7. There are three stars in the non-calibration sample with . However, examination of Table 9 shows that our [C/Fe] ratios are in general lower than the literature values. Because these stars were chosen out of a large sample with consistent C-abundance determinations (Rossi et al., 2005), we believe they are still C-enhanced relative to the field population.
There are four stars with literature [C/N] values in the interesting low range of [C/N] in Figure 7; these deserve some special discussion. Based on the observations in Figure 7, we define the class of NEMP stars as having [N/Fe]0.5 and [C/N]0.5. This marks stars that have distinctly lower [C/N] ratios than the rest of the CEMP stars, although we note that to agree with the predictions of HBB, these stars would need to have [C/N] . Two of these, CS 29528-041 and HE 10310020 have properties similar to the NEMP stars we were expecting to find in much greater numbers. Of the other two, CS 22949-037 is not s-process rich (but it is oxygen rich), and CS 30322-023 is probably an intrinsic thermally pulsing AGB star (Masseron et al., 2006). The statistics for the presence of NEMP stars in the literature confirm the rarity that led to the lack of them in our sample.
-
•
CS 29528-041: Sivrani et al. (2006) report on the elemental abundances of this C-rich, but even more N-rich star. It has the expected abundance ratios for NEMP stars: , , , hence . Interestingly, this star also has detectable lithium, albeit at a value well below the Spite Plateau, . It is s-process-element rich as well, with , which indicates that more massive AGB stars can produce the s-process.
-
•
HE 10310020: Cohen et al. (2006) found a [C/N] of for this s-process-element rich star, which is one of the less C-enhanced stars in their sample, with .
-
•
CS 22949-037: Norris et al. (2002) showed that this star has a [C/N] ratio of , while Depagne et al. (2002) found an extremely high [O/Fe] ratio of . Models of EMP or low-mass AGB stars based on standard mixing assumptions (no convective overshooting at bottom of He-shell flash convection zone) do predict a range of O overabundances depending on mass (Siess et al., 2002; Herwig, 2004b). For , can be up to 1.7 dex for low-mass models. Like C and N, the O production in AGB stars is primary, and therefore larger overabundances are expected with low metal content. However, the large N overabundance observed in this star is only predicted for more massive AGB stars for which the O overabundance is probably smaller. This, and the lack of enrichment in the s-process elements, supports the hypernova hypothesis for this star.
-
•
CS 30322-023: Masseron et al. (2006) have argued that this extremely low metallicity star, with , and with a clear s-process-element signature, is likely to be an example of an intrinsic AGB star, caught during the brief stage of evolution when thermal pulses are occurring. This star is mildly carbon-rich, with , while the nitrogen abundance ratio is quite high, . We would not classify this an NEMP star, however, if it is an intrinsic AGB star, because there is no binary mass transfer, in analogy to the CEMP-s stars. Note, however, that if the identification of this star as a TP-AGB is correct, its mass cannot be high, but rather, it must be on the order of . Since at masses this low, HBB is not expected to occur, Masseron et al. (2006) suggest an unknown mixing process that happens in VMP stars is responsible.
| Star | log(C) | [C/Fe] | log(N) | [N/Fe] | [Fe/H] | [C/N] |
|---|---|---|---|---|---|---|
| BD | 5.47 | 0.20 | 2.89 | |||
| HD 122563 | 5.14 | 0.95 | 6.58 | 1.00 | 2.47 | 1.95 |
| HD 160617 | 6.27 | 0.60 | 6.76 | 0.40 | 1.69 | 1.00 |
| HD 186478 | 5.73 | 0.20 | 6.12 | 0.70 | 2.63 | 0.90 |
| CS 22174-007 | 6.16 | 0.40 | 5.16 | 0.89 | 2.00 | 0.49 |
| CS 22183-031 | 5.47 | 0.30 | 6.77 | 1.51 | 2.79 | 1.81 |
| CS 22879-029 | 7.93 | 1.30 | 7.02 | 0.90 | 1.93 | 0.40 |
| CS 22884-097 | 7.92 | 1.30 | 7.96 | 1.85 | 1.94 | 0.55 |
| CS 22887-048 | 7.84 | 0.85 | 6.98 | 0.50 | 2.79 | 0.35 |
| CS 22891-171 | 7.56 | 1.45 | 6.20 | 0.60 | 2.45 | 0.85 |
| CS 22892-052 | 6.40 | 0.60 | 5.14 | 0.15 | 2.76 | 0.75 |
| CS 22898-062 | 6.62 | 0.20 | 5.31 | 1.00 | 1.74 | 0.80 |
| CS 22945-024 | 7.00 | 0.70 | 5.49 | 0.30 | 2.26 | 1.00 |
| CS 22947-187 | 6.91 | 0.60 | 6.35 | 0.55 | 2.25 | 0.05 |
| CS 22948-104 | 6.42 | 0.25 | 6.62 | 0.96 | 2.39 | 0.71 |
| CS 22949-008 | 7.79 | 1.15 | 6.43 | 0.30 | 1.92 | 0.85 |
| CS 22950-046 | 4.77 | 0.50 | 6.16 | 0.30 | 3.29 | 0.80 |
| CS 22958-042 | 8.31 | 2.40 | 7.29 | 1.89 | 2.65 | 0.51 |
| CS 22958-083 | 6.41 | 0.35 | 6.51 | 0.96 | 2.50 | 0.61 |
| CS 22960-053 | 6.63 | 1.15 | 6.12 | 1.15 | 3.08 | 0.00 |
| CS 22968-014 | 5.36 | 0.10 | 4.88 | 0.13 | 3.30 | 0.03 |
| CS 29493-090 | 5.99 | 0.25 | 5.68 | 0.45 | 2.82 | 0.20 |
| CS 29495-042 | 7.26 | 1.00 | 6.25 | 0.50 | 2.30 | 0.50 |
| CS 29497-030 | 8.36 | 2.00 | 7.99 | 2.14 | 2.20 | 0.14 |
| CS 29512-073 | 7.51 | 1.05 | 5.95 | 0.00 | 2.10 | 1.05 |
| CS 30314-067 | 6.14 | 0.25 | 5.88 | 0.50 | 2.67 | 0.25 |
| CS 31062-041 | 6.51 | 0.25 | 6.15 | 0.40 | 2.30 | 0.15 |
| CS 31080-095 | 7.91 | 2.10 | 6.56 | 1.26 | 2.75 | 0.84 |
| Star | [C/H] | [N/H] | [C/N] | [C/Fe] | Source |
|---|---|---|---|---|---|
| BD | 3.08 | 3.02 | 0.02 | Spite et al. (2005) | |
| 3.09 | 0.20 | This study | |||
| HD 122563 | 3.29 | 1.72 | 1.57 | 0.47 | Spite et al. (2005) |
| 3.20 | 1.65 | 1.55 | 0.46 | Westin et al. (2000) | |
| 3.42 | 1.47 | 1.95 | 0.95 | This study | |
| HD 160617 | 1.82 | 0.03 | Akerman et al. (2004) | ||
| 1.69 | 0.34 | Laird (1985) | |||
| 2.29 | 1.29 | 1.00 | 0.60 | This study | |
| HD 186478 | 2.89 | 1.57 | 1.32 | 0.30 | Spite et al. (2005) |
| 2.83 | 1.93 | 1.00 | 0.20 | This study | |
| CS 22892-052 | 2.06 | 0.98 | McWilliam et al. (1995a) | ||
| 2.26 | 2.22 | 0.04 | 0.88 | Sneden et al. (2003) | |
| 2.16 | 2.91 | 0.75 | 0.60 | This study | |
| CS 22958-042 | 0.14 | 1.00 | 1.14 | 3.01 | Sivrani et al. (2006) |
| 0.25 | 0.51 | 2.40 | This study | ||
| CS 30314-067 | 2.4 | 1.7 | 0.70 | 0.50 | Aoki et al. (2002c) |
| 2.42 | 2.17 | 0.25 | 0.25 | This study | |
| CS 31085-095 | 0.31 | 2.40 | 2.09 | 2.56 | Sivrani et al. (2006) |
| 0.65 | 1.49 | 0.84 | 2.10 | This study |
| Star | log(C) | log(N) | [Fe/H] | [C/N] | Source | s-process? |
|---|---|---|---|---|---|---|
| Original Literature Sample | ||||||
| CS 22877-001 | 6.86 | 5.35 | 2.72 | 1.00 | Aoki et al. (2002c) | no |
| CS 22880-074 | 7.93 | 6.02 | 1.93 | 1.40 | Aoki et al. (2002d) | yes |
| CS 22881-036 | 8.46 | 6.99 | 2.06 | 0.96 | Preston & Sneden (2001) | yes |
| CS 22898-027 | 8.51 | 6.70 | 2.25 | 1.30 | Aoki et al. (2002d) | yes |
| CS 22942-019 | 7.92 | 6.01 | 2.64 | 1.70 | Aoki et al. (2002d) | yes |
| CS 22948-027 | 7.96 | 7.25 | 2.57 | 0.20 | Aoki et al. (2002c) | no |
| CS 22957-027 | 7.80 | 6.45 | 3.38 | 0.84 | Aoki et al. (2002b) | no |
| CS 29497-034 | 7.56 | 7.45 | 2.90 | 0.40 | Hill et al. (2000) | yes |
| CS 29498-043 | 6.70 | 6.50 | 3.75 | 0.31 | Aoki et al. (2002b) | no |
| CS 29502-092 | 6.76 | 5.95 | 2.76 | 0.30 | Aoki et al. (2002c) | no |
| CS 29526-110 | 8.38 | 7.07 | 2.38 | 0.80 | Aoki et al. (2002d) | yes |
| CS 30301-015 | 7.52 | 6.01 | 2.64 | 1.00 | Aoki et al. (2002d) | yes |
| CS 31062-012 | 8.11 | 6.70 | 2.55 | 0.90 | Aoki et al. (2002d) | yes |
| CS 31062-050 | 8.24 | 6.93 | 2.32 | 0.80 | Aoki et al. (2002d) | yes |
| HD 196944 | 7.51 | 7.10 | 2.25 | 0.10 | Aoki et al. (2002d) | yes |
| HE 0024-2523 | 8.44 | 7.43 | 2.72 | 0.50 | Lucatello et al. (2003) | yes |
| LP 625-44 | 8.00 | 6.30 | 2.71 | 1.19 | Aoki et al. (2001) | yes |
| LP 706-7 | 7.96 | 7.03 | 2.74 | 0.42 | Aoki et al. (2001) | yes |
| New and Updated Literature Sample | ||||||
| HE 0012-1441 | 7.66 | 6.05 | 2.52 | 1.10 | Cohen et al. (2006) | yes |
| HE 0058-0244 | 7.76 | 6.95 | 2.75 | 0.30 | Cohen et al. (2006) | yes |
| HE 0107-5240 | 6.81 | 5.22 | 5.46 | 1.08 | Christlieb et al. (2004) | no |
| HE 0143-0441 | 8.26 | 7.35 | 2.31 | 0.40 | Cohen et al. (2006) | yes |
| HE 0212-0557 | 8.06 | 6.75 | 2.27 | 0.80 | Cohen et al. (2006) | yes |
| HE 0336+0113 | 8.16 | 6.85 | 2.68 | 0.80 | Cohen et al. (2006) | yes |
| HE 1150-0428 | 7.66 | 7.15 | 3.30 | 0.00 | Cohen et al. (2006) | no |
| HE 1410+0213 | 8.16 | 6.85 | 2.16 | 0.10 | Cohen et al. (2006) | no |
| HE 1434-1442 | 8.16 | 6.95 | 2.39 | 0.70 | Cohen et al. (2006) | yes |
| HE 1509-0806 | 7.66 | 7.25 | 2.91 | 0.10 | Cohen et al. (2006) | yes |
| HE 2158-0348 | 7.76 | 6.75 | 2.70 | 0.50 | Cohen et al. (2006) | yes |
| HE 2232-0603 | 7.96 | 6.55 | 1.85 | 0.90 | Cohen et al. (2006) | yes |
| HE 2356-0410 | 7.66 | 6.75 | 3.07 | 0.40 | Cohen et al. (2006) | no |
| HE 1327-2326 | 6.99 | 6.83 | 5.73 | 0.37 | Aoki et al. (2006) | no |
| Nitrogen-Rich Stars | ||||||
| CS 29529-041 | 6.70 | 7.57 | 3.32 | 1.38 | Sivrani et al. (2006) | yes |
| CS 22949-037 | 5.82 | 6.96 | 3.79 | 1.65 | Norris et al. (2002) | no |
| CS 30322-023 | 5.60 | 7.20 | 3.39 | 2.11 | Masseron et al. (2006) | yes |
| HE 1031-0020 | 7.36 | 7.55 | 2.86 | 0.70 | Cohen et al. (2006) | yes |
5. Discussion: Why the Lack of Observed NEMP Stars?
We expected to find that between 12 % and 35 % of our sample would turn out to be NEMP stars (see § 5.2), depending on our assumption concerning the mass ratios in the binary progenitors. Instead, we found no candidates in our sample of 21 stars, and only two in the recent literature. The presence of these two , s-process-rich stars suggest that NEMP stars do in fact exist, and their abundance patterns are as expected from the models, just not in the predicted numbers that should be found. However, there remain several outstanding questions concerning the nature of our sample which we should examine before asking if models of primary nitrogen production by intermediate-mass AGB stars are incorrect.
5.1. Are we observing stars that have been polluted by AGB stars?
AGB stars are by far the most likely culprits for the pollution of our sample. The majority of CEMP stars are CEMP-s stars, and much observational evidence, reviewed in the Introduction, points to their being the result of AGB mass transfer. However, it is possible that stars with lower [C/Fe] values have a smaller percentage that are s-process-rich than those with . We have information on the s-process abundances for four stars in the sample: CS 22947-187 and CS 31085-090 are s-process-rich, while CS 30314-067 and CS 22958-042 are not and there appears to be no correlation with C-richness. We are currently obtaining follow-up high-resolution spectra for many of stars in our sample to check for radial-velocity variations and s-process enhancements.
5.2. Are we observing stars that have been polluted by intermediate-mass AGB stars?
Although we are confident that most of our stars have been polluted by AGB stars, we have considerably less information on the distribution of masses of those AGB stars. Our initial estimate was based on the mass ratio () distribution deduced by Pinsonneault & Stanek (2006) from a variety of studies, particularly the data on massive binaries in the Small Magellanic Cloud from Harries et al. (2003) and Hilditch et al. (2005). Their most likely distribution of fractions is that 45 % of binary systems are “twins”, with the primary and secondary masses the same to within 5 %, while the of the other 55 % of systems are matched by a flat mass distribution. We assumed that the observed stars, being main-sequence turnoff, subgiant, giant or horizontal branch stars, all have main-sequence masses close to 0.9 M⊙. Therefore, their “twin” AGB stars would be M⊙ and would have created high [C/N] ratios. Therefore, the NEMP stars must come from the flat mass distribution. We adopt 3.5 M⊙ as the dividing line between those AGB stars that undergo HBB and those that do not. Finally, the maximum mass of an AGB star at is 7.5 M⊙ (Poelarends et al., in prep). Combining all of this information, we find that there should be roughly 33 % NEMP stars and 67 % CEMP-s stars contained in our sample.
There may be difficulties with our predictions. For example, while Pinsonneault & Stanek (2006) consider the mass ratios using studies that cover a wide range of masses, none of the studies is able to cover a wide range of . The SMC binary studies only reach a mass ratio of , which is larger than minimum we are interested in, 0.12, and it is conceivable that the distribution will change as the mass difference between the two components becomes more extreme. Such studies are difficult because of the different luminosities and timescales of the two kinds of stars, but we do have some information on the distribution of binaries with solar-type primaries (Duquennoy & Mayor, 1991). For the longer period ( days) binaries, the data suggested a secondary star drawn from an IMF-weighted distribution. However, for the shorter period binaries, Mazeh et al. (1992) found a distribution that was much flatter, with perhaps a rise toward . For lack of other information, if we make the assumption that the mass of the companion of the observed stars is drawn from a Salpeter (1955) mass function between 1M⊙ and 7.5 M⊙, we find that there should be 1 NEMP for every 6.9 CEMP-s stars. This is a much smaller ratio, but still not small enough to be supported by the observational data. All of these numbers were obtained assuming that there was not a bias towards finding NEMP stars in the C-mild sample; if such a bias existed, the disagreement with theory would only be strengthened.
5.3. Could binarity be affecting our results?
The fact that these AGB stars were in binary systems may have affected their nucleosythesis yields by increasing their mass-loss rates and ending the production of N by HBB. This could be due to tidal synchronization between rotational and orbital motions, as observationally demonstrated for RGB stars by De Medeiros et al. (2002). Even after HBB is terminated, dredge-up can continue if the minimum envelope mass for dredge-up is less than that for HBB, and the resulting [C/N] ratio may be altered. Frost et al. (1998) argued that the presence of high- luminosity C stars in the Large Magellanic Cloud could be explained by continued dredge-up after HBB has ceased. It is not clear if this same reasoning would apply to our present sample, which has much lower metallicity. However, if tidal synchronization leads to a spin-up mixing, N production should be enhanced, possibly balancing the effect of enhanced mass loss. Without detailed models we can only speculate, but it is not immediately clear that binarity could inhibit N production at the bottom of more massive AGB stars.
5.4. Could mass ratios affect mass transfer?
Jorissen & Boffin (1992) summarize the situation regarding mass transfer in both Roche-lobe overflow and wind models. For large mass ratios, only wind models were stable, because the large mass-transfer rates in overflow scenarios puff up the secondary star and lead to a contact binary situation (Tout & Hall, 1991). Vanture (1992) argued that the mass transfer from a wind would not be sufficient to create CH stars, and therefore only in binary systems with Roche-lobe overflow would the nucleosynthesis of the AGB star be preserved in the still-shining secondary. Much work remains to be done in understanding mass-transfer scenarios, but if NEMP stars can only be formed by wind accretion, then their production could be far less efficient than for CEMP stars.
5.5. Could mass transfer rates be affected C- vs. N-richness?
Our understanding of mass loss in AGB stars is seriously incomplete. However, one variable that may be important is the dust-to-gas ratio, with mass-loss rates increasing for increasing amounts of dust. Carbon is a major contributor to dust in AGB stars, and the dust-to-gas ratio has been parameterized by the C-richness (e.g., Arndt et al., 1997). Therefore, since HBB stars produce less C-rich AGB envelopes, their mass loss may be lower and therefore the number of binary companions that are enriched enough to be included in our sample may be small. However, a lower mass-loss rate, given enough time, could still conceivably add up to the same amount of enrichment. Additionally, Arndt et al. (1997) found only a small dependency on C-enhancement.
5.6. Does hot bottom-burning occur in intermediate mass AGB stars?
Another explanation for the absence of NEMP stars in our sample could be the inability of more massive AGB stars (maybe only at very low metallicity) to produce N via HBB. The efficiency of envelope convection, parameterized by the mixing length parameter, determines the efficiency of HBB in stellar evolution models. A larger convective efficiency would imply even more efficient HBB, but could decrease the dredge-up efficiency, in particular if significant convective overshoot is present. This would limit the ability of massive AGB stars to produce primary N. A smaller convective efficiency would lead to less efficient HBB, and a smaller mass range for efficient N production, lowering the expected number of NEMP stars. However, we have not performed calculations with a range of convective efficiencies, and therefore we cannot quantify these possible effects. Stellar evolution modeling of HBB in massive AGB stars also predicts the production of Li through the Cameron & Fowler (1971) mechanism. This property of HBB is observationally confirmed by the discovery that almost all of the luminous AGB stars with in the Magellanic Clouds are lihtium rich (e.g. Smith et al., 1995).
5.7. Could extra-mixing be affecting our results?
The main goal of our study was to establish whether there existed a possible observational selection bias against the discovery of NEMP stars. However, we also noted that previous literature data, as well as our new objects have C/N ratios that are too low compared to standard low-mass AGB models without HBB. Our 2 M⊙ and 3 M⊙ model sequences produce large amounts of C, but no N. The most likely solution to this discrepancy would be an additional mixing process, such as cool-bottom processing, which has been studied in great detail in the context of abundance anomalies in globular cluster stars (Wasserburg et al., 1995; Denissenkov & VandenBerg, 2003). Such an extra-mixing process below the bottom of the convective envelope could also operate in low-mass AGB stars, leading to mild CN cycling that produces some N, but not as complete as in HBB (Nollett et al., 2003). We believe that the present observational data support such a scenario. We plan to test this idea quantitatively in the future with stellar evolution models that include this process.
5.8. Final Thoughts
It is probable that the formation of C-rich stars involves a delicate balancing act in which the N-rich stars are disadvantaged. The most likely possibilities are the binary mass ratios in the early Universe or the process of mass transfer for large mass-ratio systems. With ever larger samples of metal-poor stars with sufficient spectroscopic data becoming available, we expect to continue studies of the relative fractions of CEMP vs. NEMP stars. To confirm that the majority of the CEMP stars in our sample were indeed polluted by AGB progenitors, we and other authors are obtaining high-resolution spectra for many of these stars to look for s-process enhancements, and to check for detectable radial-velocity variations. In addition, other elements, such as Li, Na, F, and the isotopes of Mg, which are affected by nucleosynthesis in AGB stars, will be examined in due course.
References
- Akerman et al. (2004) Akerman, C. J., Carigi, L., Nissen, P. E., Pettini, M., & Asplund, M. 2004, A&A, 414, 931
- Alonso et al. (1996) Alonso, A., Arribas, S., & Martinez-Roger, C. 1996, A&AS, 117, 227
- Alonso et al. (1999) Alonso, A., Arribas, S., & Martínez-Roger, C. 1999, A&AS, 139, 335
- Anders & Grevesse (1989) Anders, E. & Grevesse, N. 1989, Geochim. Cosmochim. Acta, 53, 197
- Aoki et al. (2002a) Aoki, W., Ando, H., Honda, S., Iye, M., Izumiura, H., Kajino, T., Kambe, E., Kawanomonoto, S., Noguchi, K., Okita, K., Sadakane, K., Sato, B., Shelton, I., Takada-Hidai, M., Takeda, Y., Watanabe, E., & Yoshida, M. 2002a, PASJ, 54, 427
- Aoki et al. (2006) Aoki, W., Frebel, A., Christlieb, N., Norris, J. E., Beers, T. C., Minezaki, T., Barklem, P. S., Honda, S., Takada-Hidai, M., Asplund, M., Ryan, S. G., Tsangarides, S., Eriksson, K., Steinhauer, A., Deliyannis, C. P., Nomoto, K., Fujimoto, M. Y., Ando, H., Yoshii, Y., & Kajino, T. 2006, ApJ, 639, 897
- Aoki et al. (2002b) Aoki, W., Norris, J. E., Ryan, S. G., Beers, T. C., & Ando, H. 2002b, ApJ, 576, L141
- Aoki et al. (2002c) —. 2002c, ApJ, 567, 1166
- Aoki et al. (2001) Aoki, W., Ryan, S. G., Norris, J. E., Beers, T. C., Ando, H., Iwamoto, N., Kajino, T., Mathews, G. J., & Fujimoto, M. Y. 2001, ApJ, 561, 346
- Aoki et al. (2002d) Aoki, W., Ryan, S. G., Norris, J. E., Beers, T. C., Ando, H., & Tsangarides, S. 2002d, ApJ, 580, 1149
- Arndt et al. (1997) Arndt, T., Fleischer, A., & Sedlmayr, E. 1997, A&A, 327, 614
- Asplund et al. (2005) Asplund, M., Grevesse, N., & Sauval, A. J. 2005, in ASP Conf. Ser. 336: Cosmic Abundances as Records of Stellar Evolution and Nucleosynthesis, ed. T. G. Barnes & F. N. Bash, 25
- Barklem et al. (2005) Barklem, P. S., Christlieb, N., Beers, T. C., Hill, V., Bessell, M. S., Holmberg, J., Marsteller, B., Rossi, S., Zickgraf, F.-J., & Reimers, D. 2005, A&A, 439, 129
- Beers (1999) Beers, T. C. 1999, in ASP Conf. Ser. 165: The Third Stromlo Symposium: The Galactic Halo, ed. B. K. Gibson, R. S. Axelrod, & M. E. Putman, 202
- Beers & Christlieb (2005) Beers, T. C. & Christlieb, N. 2005, ARAA, 43, 531
- Beers et al. (2006) Beers, T. C., Flynn, C., Rossi, S., Christlieb, N., Sommer-Larsen, J., Wilhelm, R., Marstellar, B., Lee, Y., De Lee, N., Deliyannis, C., Zickgraff, F.-J., Holmberg, J., Önehag, A., Eriksson, A., Terndrup, D., Salim, S., & Frebel, A. 2006, ApJS, submitted
- Beers et al. (1992) Beers, T. C., Preston, G. W., & Shectman, S. A. 1992, AJ, 103, 1987
- Bergbusch & VandenBerg (2001) Bergbusch, P. A. & VandenBerg, D. A. 2001, ApJ, 556, 322
- Bessell & Norris (1982) Bessell, M. S. & Norris, J. 1982, ApJ, 263, L29
- Beveridge & Sneden (1994) Beveridge, R. C. & Sneden, C. 1994, AJ, 108, 285
- Boothroyd et al. (1993) Boothroyd, A. I., Sackmann, I.-J., & Ahern, S. C. 1993, ApJ, 416, 762
- Brazier et al. (1986) Brazier, C. R., Ram, R. S., & Bernath, P. F. 1986, Journal of Molecular Spectroscopy, 120, 381
- Cameron & Fowler (1971) Cameron, A. G. W. & Fowler, W. A. 1971, ApJ, 164, 111
- Carbon et al. (1987) Carbon, D. F., Barbuy, B., Kraft, R. P., Friel, E. D., & Suntzeff, N. B. 1987, PASP, 99, 335
- Carretta et al. (2002) Carretta, E., Gratton, R., Cohen, J. G., Beers, T. C., & Christlieb, N. 2002, AJ, 124, 481
- Castelli & Kurucz (2003) Castelli, F., & Kurucz, R. L. 2003, IAU Symposium, 210, 20P
- Cayrel et al. (2004) Cayrel, R., Depagne, E., Spite, M., Hill, V., Spite, F., François, P., Plez, B., Beers, T., Primas, F., Andersen, J., Barbuy, B., Bonifacio, P., Molaro, P., & Nordström, B. 2004, A&A, 416, 1117
- Chin et al. (1999) Chin, Y.-N., Henkel, C., Langer, N., & Mauersberger, R. 1999, ApJ, 512, L143
- Christlieb (2003) Christlieb, N. 2003, Reviews of Modern Astronomy, 16, 191
- Christlieb et al. (2004) Christlieb, N., Gustafsson, B., Korn, A. J., Barklem, P. S., Beers, T. C., Bessell, M. S., Karlsson, T., & Mizuno-Wiedner, M. 2004, ApJ, 603, 708
- Cohen et al. (2006) Cohen, J., McWilliam, A., Shectman, S., Thompson, I., Melendez, J., Ramirez, S., Swensson, A., & Zickgraf, F.-J. 2006, AJ, 132, 137
- Collet et al. (2006) Collet, R., Asplund, M., & Trampedach, R. 2006, ApJ, 644
- De Medeiros et al. (2002) De Medeiros, J. R., Da Silva, J. R. P., & Maia, M. R. G. 2002, ApJ, 578, 943
- Denissenkov & VandenBerg (2003) Denissenkov, P. A. & VandenBerg, D. A. 2003, ApJ, 593, 509
- Depagne et al. (2002) Depagne, E., Hill, V., Spite, M., Spite, F., Plez, B., Beers, T. C., Barbuy, B., Cayrel, R., Andersen, J., Bonifacio, P., François, P., Nordström, B., & Primas, F. 2002, A&A, 390, 187
- Duquennoy & Mayor (1991) Duquennoy, A. & Mayor, M. 1991, A&A, 248, 485
- Forestini & Charbonnel (1997) Forestini, M. & Charbonnel, C. 1997, A&AS, 123, 241
- Frost et al. (1998) Frost, C. A., Lattanzio, J. C., & Wood, P. R. 1998, ApJ, 500, 355
- Fulbright & Kraft (1999) Fulbright, J. P. & Kraft, R. P. 1999, AJ, 118, 527
- Graham & Lew (1978) Graham, W. R. M. & Lew, H. 1978, Canadian Journal of Physics, 56, 85
- Gratton et al. (2000) Gratton, R. G., Sneden, C., Carretta, E., & Bragaglia, A. 2000, A&A, 354, 169
- Harries et al. (2003) Harries, T. J., Hilditch, R. W., & Howarth, I. D. 2003, MNRAS, 339, 157
- Herwig (2004a) Herwig, F. 2004a, ApJ, 605, 425
- Herwig (2004b) Herwig, F. 2004b, ApJS, 155, 651
- Hilditch et al. (2005) Hilditch, R. W., Howarth, I. D., & Harries, T. J. 2005, MNRAS, 357, 304
- Hill et al. (2000) Hill, V., Barbuy, B., Spite, M., Spite, F., Cayrel, R., Plez, B., Beers, T. C., Nordström, B., & Nissen, P. E. 2000, A&A, 557
- Honda et al. (2004a) Honda, S., Aoki, W., Ando, H., Izumiura, H., Kajino, T., Kambe, E., Kawanomoto, S., Noguchi, K., Okita, K., Sadakane, K., Sato, B., Takada-Hidai, M., Takeda, Y., Watanabe, E., Beers, T. C., Norris, J. E., & Ryan, S. G. 2004a, ApJS, 152, 113
- Honda et al. (2004b) Honda, S., Aoki, W., Kajino, T., Ando, H., Beers, T. C., Izumiura, H., Sadakane, K., & Takada-Hidai, M. 2004b, ApJ, 607, 474
- Ivans et al. (2005) Ivans, I. I., Sneden, C., Gallino, R., Cowan, J. J., & Preston, G. W. 2005, ApJ, 627, L145
- Johnson (2002) Johnson, J. A. 2002, ApJS, 139, 219
- Johnson & Bolte (2004) Johnson, J. A. & Bolte, M. 2004, ApJ, 605, 462
- Jonsell et al. (2005) Jonsell, K., Edvardsson, B., Gustafsson, B., Magain, P., Nissen, P. E., & Asplund, M. 2005, A&A, 440, 321
- Jorissen & Boffin (1992) Jorissen, A. & Boffin, H. M. J. 1992, in Binaries as Tracers of Stellar Formation. Proceedings of a Workshop held in Bettmeralp, Switzerland, Sept. 1991, in honor of Dr. Roger Griffin. Editors, Antoine Duquennoy, Michel Mayor; Publisher, Cambridge University Press, Cambridge, England, New York, NY, 1992. LC # QB821 .B55 1991. ISBN # 0521433584. P. 110, 1992, ed. A. Duquennoy & M. Mayor, 110
- Keenan (1942) Keenan, P. C. 1942, ApJ, 96, 101
- Kurucz (2006a) Kurucz, R. L. 2006a, http://kurucz.harvard.edu/grids.html/
- Kurucz (2006b) —. 2006b, http://kurucz.harvard.edu/LINELISTS/LINESMOL/
- Laird (1985) Laird, J. B. 1985, ApJ, 289, 556
- Lattanzio (1992) Lattanzio, J. C. 1992, PASA, 10, 120
- Lucatello et al. (2006) Lucatello, S., Beers, T. C., Christlieb, N., Barklem, P., Rossi, S., Marstellar, B., Lee, Y., & Sivarani, T. 2006, ApJL, submitted
- Lucatello et al. (2003) Lucatello, S., Gratton, R., Cohen, J. G., Beers, T. C., Christlieb, N., Carretta, E., & Ramirez, S. 2003, AJ, 125, 875
- Lucatello et al. (2005) Lucatello, S., Tsangarides, S., Beers, T. C., Carretta, E., Gratton, R. G., & Ryan, S. G. 2005, ApJ, 625, 825
- Luque & Crosley (1996) Luque, J. & Crosley, D. R. 1996, Journal of Chemical Physics, 104, 2146, http://www.sri.com/psd/lifbase
- Mashonkina et al. (2003) Mashonkina, L., Gehren, T., Travaglio, C., & Borkova, T. 2003, A&A, 397, 275
- Masseron et al. (2006) Masseron, T., Van Eck, S., Famacy, B., Goriely, S., Plez, B., Siess, L., Beers, T., Primas, F., & Jorissen, A. 2006, A&A, in press
- Mazeh et al. (1992) Mazeh, T., Goldberg, D., Duquennoy, A., & Mayor, M. 1992, ApJ, 401, 265
- McWilliam et al. (1995a) McWilliam, A., Preston, G. W., Sneden, C., & Searle, L. 1995a, AJ, 109, 2757
- McWilliam et al. (1995b) McWilliam, A., Preston, G. W., Sneden, C., & Shectman, S. 1995b, AJ, 109, 2736
- Mendez & van Altena (1998) Mendez, R. A. & van Altena, W. F. 1998, A&A, 330, 910
- Nollett et al. (2003) Nollett, K. M., Busso, M., & Wasserburg, G. J. 2003, ApJ, 582, 1036
- Norris et al. (1997) Norris, J. E., Ryan, S. G., & Beers, T. C. 1997, ApJ, 488, 350
- Norris et al. (2002) Norris, J. E., Ryan, S. G., Beers, T. C., Aoki, W., & Ando, H. 2002, ApJ, 569, L107
- Pinsonneault & Stanek (2006) Pinsonneault, M. H. & Stanek, K. Z. 2006, ApJ, 639, L67
- Piskunov et al. (2000) Piskunov, N., Ryabchikova, T. A., & Weiss, W. W. 2000, in Magnetic Fields of Chemically Peculiar and Related Stars, Proceedings of the International Meeting, held in Special Astrophysical Observatory of Russian AS, September 23 - 27, 1999, Eds.: Yu.V. Glagolevskij, I.I. Romanyuk, p.194-198, ed. Y. V. Glagolevskij & I. I. Romanyuk, 194–198
- Preston & Sneden (2001) Preston, G. W. & Sneden, C. 2001, AJ, 122, 1545
- Rossi et al. (2005) Rossi, S., Beers, T. C., Sneden, C., Sevastyanenko, T., Rhee, J., & Marsteller, B. 2005, AJ, 130, 2804
- Salpeter (1955) Salpeter, E. E. 1955, ApJ, 161
- Schlegel et al. (1998) Schlegel, D. J., Finkbeiner, D. P., & Davis, M. 1998, ApJ, 500, 525
- Seal & Gaydon (1966) Seal, K. E. & Gaydon, A. G. 1966, Proc. Phys. Soc., 89, 459
- Shavrina et al. (1996) Shavrina, A. V., Yakovina, L. A., & Bikmaev, I. F. 1996, Kinematics and Physics of Celestial Bodies, 12, 35
- Siess et al. (2002) Siess, L., Livio, M., & Lattanzio, J. 2002, ApJ, 570, 329
- Sivarani et al. (2004) Sivarani, T., Bonifacio, P., Molaro, P., Cayrel, R., Spite, M., Spite, F., Plez, B., Andersen, J., Barbuy, B., Beers, T. C., Depagne, E., Hill, V., François, P., Nordström, B., & Primas, F. 2004, A&A, 413, 1073
- Sivrani et al. (2006) Sivrani, T., Beers, T. C., Bonifacio, P., Molaro, P., Cayrel, R., Herwig, F., Spite, M., Spite, F., Plez, B., Andersen, J., Barbuy, B., Depagne, E., Hill, V., Francois, P., Nordstrom̈, B., & Primas, F. 2006, å, in press (astro-ph/0608112)
- Skrutskie et al. (2006) Skrutskie, M. F., Cutri, R. M., Stiening, R., Weinberg, M. D., Schneider, S., Carpenter, J. M., Beichman, C., Capps, R., Chester, T., Elias, J., Huchra, J., Liebert, J., Lonsdale, C., Monet, D. G., Price, S., Seitzer, P., Jarrett, T., Kirkpatrick, J. D., Gizis, J. E., Howard, E., Evans, T., Fowler, J., Fullmer, L., Hurt, R., Light, R., Kopan, E. L., Marsh, K. A., McCallon, H. L., Tam, R., Van Dyk, S., & Wheelock, S. 2006, AJ, 131, 1163
- Smith et al. (1995) Smith, V. V., Plez, B., Lambert, D. L., & Lubowich, D. A. 1995, ApJ, 441, 735
- Sneden et al. (2003) Sneden, C., Cowan, J. J., Lawler, J. E., Ivans, I. I., Burles, S., Beers, T. C., Primas, F., Hill, V., Truran, J. W., Fuller, G. M., Pfeiffer, B., & Kratz, K.-L. 2003, ApJ, 591, 936
- Sneden (1973) Sneden, C. A. 1973, Ph.D. Thesis
- Spite et al. (2005) Spite, M., Cayrel, R., Plez, B., Hill, V., Spite, F., Depagne, E., François, P., Bonifacio, P., Barbuy, B., Beers, T., Andersen, J., Molaro, P., Nordström, B., & Primas, F. 2005, A&A, 430, 655
- Tarroni et al. (1997) Tarroni, R., Palmieri, P., Mitrushenkov, A., Tosi, P., & Bassi, D. 1997, J. Chem. Phys., 106, 10265
- Tout & Hall (1991) Tout, C. A. & Hall, D. S. 1991, MNRAS, 253, 9
- Vanture (1992) Vanture, A. D. 1992, AJ, 104, 1986
- Ventura & D’Antona (2005) Ventura, P. & D’Antona, F. 2005, A&A, 431, 279
- Wasserburg et al. (1995) Wasserburg, G. J., Boothroyd, A. I., & Sackmann, I.-J. 1995, ApJ Lett., 447, L37
- Westin et al. (2000) Westin, J., Sneden, C., Gustafsson, B., & Cowan, J. J. 2000, ApJ, 530, 783
- Zachwieja (1995) Zachwieja, M. 1995, Journal of Molecular Spectroscopy, 170, 285
- Zachwieja (1997) —. 1997, Journal of Molecular Spectroscopy, 182, 18