Young stellar populations in early-type galaxies in the Sloan Digital Sky Survey
Abstract
We use a purely data-driven rectified factor analysis to identify early-type galaxies with recent star formation in Data Release 4 of the Sloan Digital Sky Survey Spectroscopic Catalogue. We compare the spectra and environment of these galaxies with those of ‘normal’ early-type galaxies, and a sample of independently selected EA galaxies. We calculate the projected local galaxy surface density from the nearest five and ten neighbours ( and ) for each galaxy in our sample, and find that the dependence on projected local density, of the properties of EA galaxies, is not significantly different from that of early-type galaxies with young stellar populations, dropping off rapidly towards denser environments, and flattening off at densities 0.10.3 Mpc-2. The dearth of EA galaxies in dense environments confirms that EA galaxies are most likely the products of galaxy-galaxy merging or interactions, rather than star-forming galaxies whose star formation has been quenched by processes unique to dense environments, such as ram-pressure stripping or galaxy harassment. We see a tentative peak in the number of EA galaxies at Mpc-2, which may represent the local galaxy density at which the rate of galaxy-galaxy merging or interaction rate peaks. Analysis of the spectra of our early-type galaxies with young stellar populations suggests that they have a stellar component dominated by F stars, 14 Gyr old, together with a mature, metal-rich population characteristic of ‘typical’ early-type galaxies. The young stars represent 10% of the stellar mass in these galaxies. This, together with the similarity of the environments in which this ‘EF’ population and the EA galaxy sample are found, suggests that E+F galaxies used to be EA galaxies, but have evolved by a further one to a few Gyr. Our rectified factor analysis is sensitive enough to identify this hidden population, which allows us to study the global and intrinsic properties of early-type galaxies created in major mergers or interactions, and compare them with those early-types which have had the bulk of their stars in place since a much earlier epoch.
keywords:
Galaxies: evolution; Galaxies: elliptical and lenticular; Galaxies: stellar content; Galaxies: starburst; Cosmology: observations.1 introduction
There is still much uncertainty about the relative epochs of mass assembly and star formation in early-type galaxies (e.g. de Lucia et al. 2006; Cimatti, Daddi & Renzini 2006). The most massive galaxies contain the oldest stellar populations, but hierarchical structure formation requires that their present-day mass was assembled at a recent epoch. On the other hand, galaxy ‘downsizing’ (e.g. Cowie et al. 1996; Treu et al. 2005) means that less massive galaxies have more recent star formation.
One would expect that different formation histories would give rise to different observed characteristics in early-type galaxies. Several studies (e.g. Faber et al. 1997; Emsellem et al. 2004; Khochfar & Burkert 2005) have in fact found that various sub-classes of early-type galaxy exist (e.g. ‘core’ and ‘cuspy’ galaxies, fast and slow rotators). We would like to know how these sub-classes are related to the various modes of formation of early-type galaxies, and to the effects of their immediate environments.
The stellar populations of early-type galaxies hold the key to understanding the difference between early-types created via different evolutionary routes. If we can identify those galaxies which have recently undergone a strong starburst, and we associate that recent starburst with a major galaxy-galaxy merger or interaction, then we can identify the products of recent merger or interaction, map their evolution with environment and redshift, and study their intrinsic properties in comparison with more massive ‘primordial’ early-types.
In this work, we are particularly interested in the relationship between EA galaxies and ‘typical’ early-types. EA galaxies are defined as having strong hydrogen Balmer absorption lines, but no corresponding [OII] or H emission lines. Their spectra, therefore, resemble the linear superposition of a characteristic early-type galaxy spectrum and that of an A star. This suggests that these galaxies have undergone a burst of star formation in the last Gyr or so, but that there is no on-going star formation. It is hypothesised that these galaxies will eventually settle down as ‘normal’ passively-evolving early-types.
EA galaxies may therefore represent an intermediate stage between gas-rich, disc-dominated, rotationally-supported, star-forming systems on the one hand, and bulge-dominated, pressure-supported, passive systems on the other. Hence, understanding the physical processes by which the star formation is triggered and subsequently truncated, is a vital stage in understanding the evolution of early-type galaxies.
There are three possible scenarios which could explain the existence of EA galaxies. The first is that they are in fact dust-obscured star-forming galaxies. This can be verified by observing at radio wavelengths, where star formation can be detected, but dust obscuration is not significant. Miller & Owen (2001) and Goto (2004) observed between them a total of 51 EA galaxies. Moderate star formation was detected in only two of these galaxies, so it is unlikely that the majority of EAs are dusty starbursts.
More plausibly, then, EA galaxies may be the product of disk-disk merging or interaction, at a stage when the starburst has burnt itself out, or they may be galaxies whose star formation has been initiated and then quenched by, for example, ram-pressure stripping or tidal stripping. The environment of these galaxies therefore holds the key to understanding them. Although, at intermediate redshift (0.33 z 0.83), Tran et al. (2003) find that EAs make up a non-negligible fraction (7–13%) of cluster members, suggesting a cluster-related mechanism for the truncation of star formation, such as ram-pressure or tidal stripping, at lower redshift (z 0.1), EAs appear to occur in lower-density environments, indicative of merging or interaction processes (Zabludoff et al. 1996; Blake et al. 2004). In addition, both Zabludoff et al. (1996) and Blake et al. (2004) found a significant number of their EA galaxies displayed tidal features and disturbed morphologies, typical of merger remnants. More recently, Goto (2005) found that EAs selected from the Sloan Digital Sky Survey (SDSS) Data Release 2 have an excess of local galaxy density only at scales of 100 kpc, and not at the scale of either clusters or larger-scale structures. This is also highly suggestive of a merger or interaction origin for EAs.
Conventional methods of identifying EA galaxies use measurements of the equivalent width of hydrogen Balmer absorption lines (typically H and H) and [OII] emission. However, this can suffer from dust obscuration of the emission lines, and emission-filling of H Balmer lines, and it requires a high signal-to-noise ( 10 per pixel). In addition, there has been some debate over the criteria for selecting EA galaxies, with some authors choosing H, H and [OII], with differing line strength criteria (e.g. Goto 2004, 2005), and some including H as well as H, H and [OII] (e.g. Zabludoff et al. 1996; Blake et al. 2004).
Here, we use a purely data-driven rectified factor analysis data model, developed in Nolan et al. (2006), on the spectra of early-type galaxies in the SDSS Data Release 4 (DR4). This was specifically designed to exploit large data sets in a model-independent way. It uses all the data present in the spectra, i.e. the spectral features and the overall shape of the continuum, to quantify the relative strength of recent star formation in early-type galaxies extracted from the database, in a rapid, objective and robust manner. Our method allows us to reconstruct even partial spectra, without the need to measure individual lines accurately. The advent of large surveys, such as the Sloan Digital Sky Survey allows us to study large samples of these rare objects ( 1 of the overall zero-redshift galaxy population, Zabludoff et al., 1996), in a way that has not been previously possible.
It has recently been shown that EA galaxies occur more frequently at high redshift (1 z 2) compared with the local universe, at least amongst the massive red galaxy population (Doherty et al. 2005, Le Borgne et al. 2006). They may, therefore, represent a critical phase in the evolution of early-type galaxies. However, it is difficult to constrain the properties of these objects at high redshift, due to the difficulty of measuring absorption lines accurately at that redshift, and in obtaining statistically significant spectroscopic samples. Studying large samples at low redshift is therefore vital for the understanding of these objects.
In this work, we use our data modelling to identify early-type galaxies (ETGs) which have a young stellar population, suggesting that they have undergone a recent burst of star formation. We compare these galaxies with EA galaxies, selected in a completely independent manner, and investigate the environment of our galaxy samples, in order to understand the physical mechanisms leading to the cessation of star formation.
In Section 2, we define the selection of the early-type sample, and the EA subsample for comparison. We discuss the factor analysis of the early-type spectra that is used to reveal young stellar populations in Section 3. In Section 4, we compare our results from the analysis of early-type galaxies with the sample of EA galaxies. In Section 5, we investigate the relationship between the galaxies in our various samples and their local environment. Our conclusions are discussed in Section 6.
We use kms-1Mpc-1, 0.3 and 0.7 throughout.
2 The sample
Our sample of early-type galaxy spectra was selected from the SDSS DR4 spectroscopic catalogue. We follow the criteria of Bernardi et al. (2003) to select early-type galaxies:
-
•
the likelihood that a de Vaucouleurs profile fits the radial surface brightness distribution is at least 1.03 times the likelihood that the radial profile is exponential;
-
•
the concentration index in the -band;
-
•
the -band Petrosian magnitude 17.5
-
•
the photometric signal-to-noise 4
-
•
the galaxy is not blended, de-blended or a child galaxy
-
•
a surface brightness profile has been fitted, and it is not saturated
-
•
redshift, and the confidence in the redshift, zConf.
We also select EA galaxies from the SDSS DR4. Here, we use the criteria of Goto (2005), so that we can compare the results of our factor analysis of the early-type galaxy sample with their sample of EAs. The criteria are:
-
•
H equivalent width (EW) 3.0 Å
-
•
H EW - 5.0 Å
-
•
[OII] EW 2.5 Å
-
•
S/N 10
-
•
z 0.01,
where emission lines have positive values. The sample is not restricted by any morphological criteria.
This gives us a sample of over 26,000 early-type galaxy spectra, and 765 Goto EAs, which we de-redshift and re-bin at the SDSS full-width half-maximum (FWHM) spectral resolution, with the observational errors supplied re-binned correspondingly in quadrature.
In this work, we consider only those galaxies in our samples which lie in the range 0.06 z 0.14. Around 50% of the galaxies in our ETG sample lie within this range, and restricting ourselves to a limited redshift range minimises any effects arising from the fixed size of the SDSS fibre diameters. At z 0.1, the central 5.5 kpc are covered, which represents 2040% of the total stellar light, which should be a good representation of the bulk stellar light. The emission lines used to select EA galaxy spectra are measured from the same spectra that we decompose using our data model, so we are of course comparing results extracted from exactly the same region of each galaxy.
The redshift cut means that, in this work, we do not explore the evolution of ETGs with young stellar populations with redshift. However, we also need not worry about -corrections to the magnitudes. The redshift range 0.06 z 0.14 is less than 1 Gyr of stellar evolution; -corrections would probably introduce uncertainties at least on this scale. Hence, we use a magnitude limit of 17.5 for all our samples, where is the Petrosian -band magnitude. The SDSS DR4 spectroscopic catalogue is complete to this limit.
3 Modelling the spectra
In order to analyse the spectra of our early-type galaxy sample, we model the data using the rectified factor analysis data model that we developed in Nolan et al. (2006). This model-independent technique is able to recover physically meaningful components of the observed spectra in a timely manner. Our approach and the underlying rationale for choosing the rectified factor model for modelling the data are described in detail in Nolan et al. (2006, §4.1), along with the details of an implementation employing variational Bayesian techniques (Nolan et al. 2006, §3.1). This modelling is an unsupervised technique, i.e. a data-driven exploratory analysis tool, designed to help us discover the underlying structure of the data and to derive features for either interpretation or subsequent quantitive analyses. Unsupervised techniques are machine learning approaches, which do not require a-priori specified targets for the training examples but instead, the data density is modelled. This model also includes latent variables that are then used to infer patterns in the data that are hoped to reveal useful relationships.
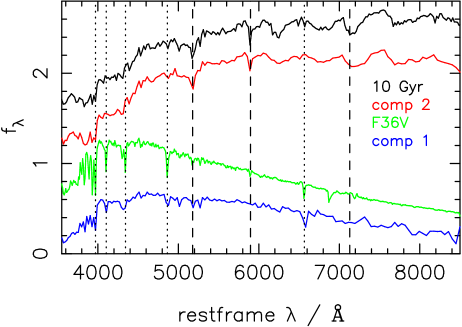
The model is first trained on half of the SDSS early-type galaxy spectra ( 13000 galaxies), and the recovered components are then used to reconstruct the remaining ETG spectra, and the spectra in the Goto EA sample (GEA). Following Nolan et al. (2006, see §4 and Fig. 4), we chose to have two spectral components, which was shown to be sufficent to represent the bulk of the stars in early-type galaxies. Fig. 1 shows the two component spectra recovered from the factor analysis, together with a 10 Gyr, 2.5 single stellar population model (Bruzual & Charlot 2003) and a typical super-solar F star spectrum (Santos et al. 1995) for comparison. Features typical of a mature, metal-rich stellar population, and a young stellar population are marked on the plot. It can be seen that the first component represents a contribution dominated by younger stars (1–4 Gyr for a typical F star at the main sequence turn-off point). It has strong hydrogen Balmer absorption lines and a corresponding lack of evolved metal absorption lines. The second component has the characteristic shape and spectral features of a mature, metal-rich stellar population, such as those that are expected to dominate in early-type galaxies. This component has a well-developed 4000Å break, typical of such populations. Clearly, the two components recovered represent young and old stellar contributions to the spectra of ETGs, although of course they cannot be exactly interpreted as single stellar populations. Although the second component is well-fit by the 10 Gyr stellar population, the first component is slightly redder than that of the F star. This probably reflects both a more complex star formation history than a simple two-component model, and that the ’real’ spectrum is that of the integrated young stellar population, rather than that of a single stellar type. Ferreras et al. (2006), using a principal components analysis on the 35007500Å spectra of 30 ellipticals in groups and the field, recover similar representations of old and young stellar populations in their first two components. Their results are also consistent with the representation of the bulk of stars in early-type galaxies by two components.
4 Comparison of the early-type galaxies and the EA sample
Within our chosen redshift range, we are left with 13,111 ETGs. Keeping only those galaxies in the GEA sample which have H, H and [OII] securely determined leaves us with 196 GEAs. Within the ETG sample, we define a sub-sample of ETGs with young stellar populations (YSPETs). These are galaxies for which a1, the contribution (or weight) of the ‘young’ data model component is greater than a2, the weight of the ‘old’ data model component. By comparison with stellar population models, we estimate a1 a2 is equivalent to an approximate lower limit to the young stellar population of 10% by stellar mass. YSPETs account for 17% of the ETGS (2245 galaxies).
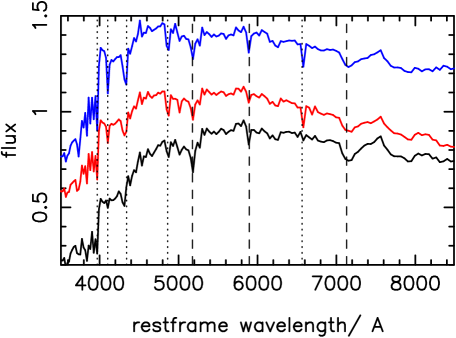
In Fig. 2 we plot the mean spectra for each of these three catagories, with the vertical normalisation adjusted for ease of comparison. The mean GEA and YSPET spectra are very similar longwards of H, and both have stronger hydrogen Balmer absorption lines and a steeper 50008000Å slope than the ETG spectrum. This is characteristic of the presence of contributions to the flux from young stars. The GEA mean spectrum shows contributions from the characteristic features of even younger stars than does the YSPET mean spectrum. It has stronger hydrogen Balmer absorption lines, enhanced flux just longwards of 4000Å, and the flux falls off more steeply towards the blue end of the spectrum shortwards of 4000Å (see Fig. 3).
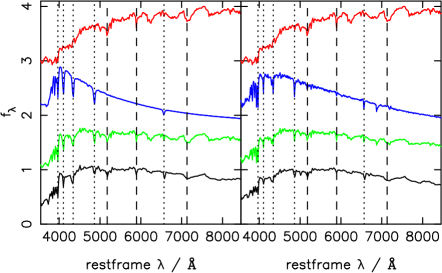
In Fig. 3 we show the likely stellar composition of the GEA and YSPET galaxies. The EA galaxies, as one would expect, resemble the linear combination of a mature, metal-rich stellar population (the ‘E’ component) together with a population dominated by young ( 0.7 Gyr) A stars. The mean YSPET spectrum is similar, but in this case, the younger stellar component is better-represented by F stars, which dominate the flux of a young stellar population at a later epoch than A stars ( 1 4 Gyr). Hence, our factor analysis has allowed us to define a sample of early-type galaxies with young-intermediate aged stars, which, as F stars dominate the integrated spectrum of a stellar population for longer than the short-lived A stars, presents us with a larger sample of galaxies which have undergone recent star-forming activity than EA samples are able to.
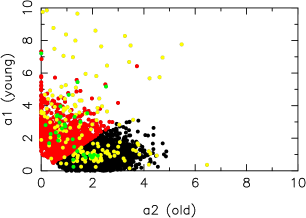
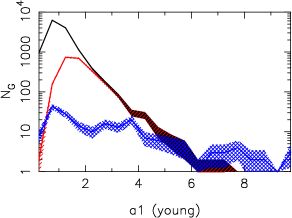
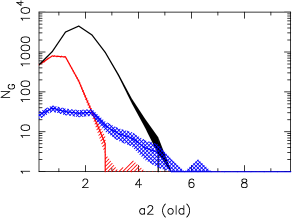
Furthermore, in Fig. 4, we plot the number densities of the weights of the data model components for our three classes of spectra. We have further divided the GEA galaxies into those that would be classified in our scheme as early-types, and those that would not. Only 17 % of the GEAs (34) are typical early-type galaxies, of which 2/3 are in the a1 a2 region. The distribution of the GEAs is less peaked in either a1 or a2 than the YSPETs, which broadly follow the same distribution as the ETGs.
That most of the GEA galaxies are not ETGs is consistent with the idea that they are the result of galaxy-galaxy mergers or interactions, and are at an earlier epoch in their post-merger evolution than the YSPETs. Their young stellar component is consistent with being less than 1 Gyr old. This is less than the typical time for the colours and surface brightness distributions of merger remnants to relax into those which are typical of ETGs, and which we use to identify ETGs in the SDSS catalogue. Of course, it should also be noted that if GEAs are quenched spirals, whose star formation has been recently halted by ram-pressure or tidal stripping, one would also expect them not be classified as ETGs under our scheme.
5 The environmental dependence
In order to investigate the mechanisms via which EAs are formed, we have quantified the environment of our sample galaxies. First, we find and , the projected distance between the galaxy and its 10th and 5th nearest neighbours in the SDSS spectroscopic catalogue. We use a Petrosian magnitude limit, 17.5, and do not -correct our magnitudes, due to the limited redshift range of our sample (see §2). The SDSS DR4 spectroscopic survey is 92 complete (Ani Thakar, private communication), so we are able to take advantage of the spectroscopic redshifts in determining environment.
We cut in peculiar velocity at 1000 kms-1 from each galaxy, to attempt to avoid background or foreground objects, but include cluster members if the target galaxy belongs to a cluster. We have not attempted here to determine cluster membership, and a more sophisticated analysis is reserved for a later paper. Here, we are only interested in the projected local galaxy density.
The projected distances are then transformed into an estimate of the local projected surface density, and . We have made a cut in to allow for the effects of the survey boundary, which could lead to an underestimate of local density for those galaxies in low-density regions. Following Clemens et al. (2006) and Miller et al. (2003) we cut at 7.2 Mpc.
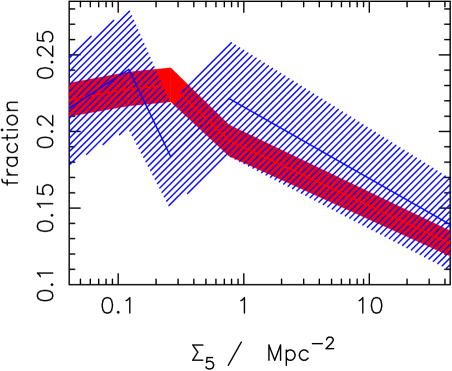
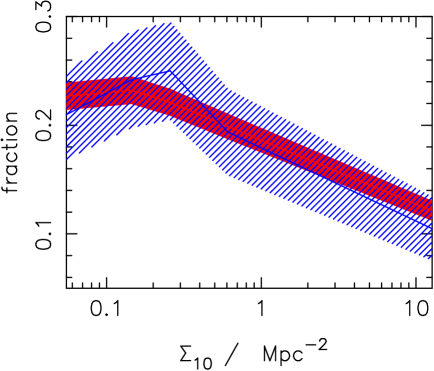
In Fig. 5, the normalised number distributions of local galaxy surface density, and , are shown for the YSPET and the GEA galaxy populations. The similarities between the samples can be clearly seen. The distribution of the GEAs follows that of the YSPETs in both cases. The fraction of GEAs perhaps peaks at around 0.1 0.3 Mpc-2, and both populations fall off strongly towards higher density environments. The fraction of YSPETs flattens off after this peak in , and in , the YSPET distribution is consistent with a flattening off at surface densities less than 0.20.3.
Performing a Kolmogorov-Smirnov test on the GEA and YSPET populations returns the probabilities, ( 4 10-4 () and 0.3 () that the two samples are taken from different distributions. Therefore, in both cases, despite our completely independent selection procedures, the distributions of the two populations are not significantly different, consistent with the hypothesis that our YSPETs are in fact evolved EA galaxies (‘E+F’ galaxies). The decreasing fraction of EAs and YSPETs towards increasing densities strongly argues for the hypothesis that the majority of GEAs or YSPETs are not the product of cluster-related processes (e.g. ram-pressure stripping). This confirms the result of Goto (2005) that EA galaxies are likely to be the product of galaxy-galaxy mergers and interactions in a group environment.
Studies of star-forming galaxies of all morphologies in the SDSS and the Two Degree Field Galaxy Redshift Survey (2dFGRS) (e.g. Lewis et al. 2002; Gomez et al. 2003; Balogh et al. 2004; Poggianti et al. 2006) find that the star formation rate falls off steeply with increasing density, but converges to the field galaxy distribution at a projected density of 1 Mpc-2. In addition, Balogh et al. (2004) find that the fraction of star-forming galaxies of all morphologies falls steeply with respect to 0.4 Mpc-2, flattening off at densities less than this, in good agreement with our results (see their Figs 5 and 6).
The peak in fraction at 0.1 0.3 Mpc-2 may indicate the optimum local galaxy surface density for galaxy-galaxy mergers and interactions, representing a trade-off between sufficient density for frequent galaxy-galaxy encounters, and slow enough relative velocities that those encounters lead to an interaction. Investigation of the results of N-body simulations would be able confirm or reject this. However, there is support for this argument in the recent results of Ferreras et al. (2006). They find a higher mass fraction of younger stars in some group galaxies than in the field galaxies, implying a more complex star formation history for galaxies in groups than in the field, in qualitative agreement with our tentative peak of recent starburst activity.
Further evidence for a peak in star-formation with respect to local galaxy density is found by Porter and Raychaudhury (2006, in preparation). Along filaments joining rich clusters, they find a peak in star formation at 34 Mpc from cluster centres. However, a careful assessment of group, cluster and filament membership is necessary, as the precise location of the peak depends upon whether a galaxy is a member of any these environmental classes.
Many authors have found that the star-formation rate begins to fall at densities 1 Mpc-2 (e.g. Lewis et al. 2002; Gomez et al. 2004; Balogh et al. 2004; Poggianti et al. 2006; Porter and Raychaudhury 2006, in preparation). However we find, as do Balogh et al. (2004), that the fraction of star-forming galaxies starts to fall off at lower densities (0.10.4 Mpc-2), with the caveat that peaks and breaks with respect to density depend on a measurement of environment more complex than simple projected local galaxy density, as mentioned above. This is suggestive that actively star-forming disk galaxies have their (moderate compared with disc-disc merging starbursts) star-formation quenched in group environments, decreasing the active-to-passive galaxy ratio. At the same time, more disc-disc merging or interaction occurs in the group environment, with associated massive star formation, keeping the star-formation rate high at higher densities, whilst contributing to the fall in the number of disc galaxies. Hence, both morphological and spectroscopic data are required in order to study these different processes effectively.
6 Conclusions
We have successfully used our data-driven rectified factor analysis to identify early-type galaxies with young stellar populations, without having to apply the far more computationally expensive method of fitting detailed stellar population synthesis models to a sample of 13,000 ETGs in the redshift range 0.06 z 0.14. We have used the sample generated as a result to map the relationship between early-type galaxies, EA galaxies and early-type galaxies with young stellar populations. Our analysis recovers two components from the set of early-type galaxy spectra, one of which represents the contribution to the flux from mature, metal-rich stars, and the other which represents the contribution from F stars, 1–4 Gyr old. Our method allows us to reconstruct spectra even when the observed spectra are incomplete. We do not need high signal-to-noise measurements of individual lines. We identify those early-types which have undergone recent (1–4 Gyr) star formation, with the young stars accounting for at least 10% of their stellar mass (YSPETs). At redshifts 0.06 z 0.14, 17% of ETGs are classified as YSPETs. We propose that these YSPETs are ‘EF’ galaxies, whose spectra are a linear combination of a typical early-type galaxy spectrum and that of an F star, analogous to EA spectra.
We also select a sample of EA galaxies in a completely independent way, without using the morphological criteria we used to identify early-type galaxies, but instead relying on the emission and absorption-line criteria of Goto (2005). The characteristic ‘EA’ spectra of the Goto-selected sample, and the fact that many of these EAs do not fulfil the colour and concentration criteria for typical early-type galaxies, suggests that these galaxies are in an early ( Gyr) post galaxy-galaxy merger or interaction phase. Goto (2005) notes that most of the EAs in his sample have concentrations as high as typical ellipticals (), so it is likely that many of these galaxies are not included in our early-type sample because they are too blue, indicating that massive (A star and earlier) stars are still burning. If EAs are recently quenched star-forming galaxies, we would expect them to be located preferentially in dense cluster regions, whereas we see the majority residing in field or group environments, and the number falls off towards denser environments, in agreement with Goto’s result. Their high concentrations and preferentially low-density environments argue strongly that these are the products of galaxy-galaxy mergers or interactions, which will eventually settle down to become typical early-type galaxies.
We note that there is in fact a slight peak in the local galaxy surface density distribution of EA galaxies at 0.1–0.3 Mpc-2. This may represent the optimum local galaxy surface density for galaxy-galaxy mergers and interactions. Realistic cosmological simulations should be able to confirm or reject this hypothesis.
Given that the distribution of local galaxy surface density of the GEA galaxies and that of the independently determined YSPET populations are not significantly different, one might expect a similar history for both sets of galaxies. We hypothesise that the YSPETs, with typical ETG colours and concentrations, and ‘EF’ spectra, represent an intermediate evolutionary stage between EAs and early-types. As this is a longer-lived stage than EA galaxies (F stars persist on the main sequence for longer than A stars, and dominate the integrated flux at ages 5 Gyr), we are able to identify a larger sample of these galaxies than is possible with the very rare EAs. We therefore have identified a powerful tool for studying in detail, both globally and individually, the evolution of early-type galaxies.
Our future work will compare the dependence on local density of EA and EF galaxies that we have recovered here, with those recovered from simulations. We intend to perform the same analysis on 2dFGRS galaxies and a sample of high-redshift galaxies for comparison. We also intend to investigate the relationship between EA and EF galaxies by studying their kinematics in detail using integral field spectroscopy.
7 Acknowledgements
Thanks to Ani Thakar at the SDSS helpdesk for valuable assistance with the SDSS archive. Funding for the SDSS and SDSS-II has been provided by the Alfred P. Sloan Foundation, the Participating Institutions, the National Science Foundation, the U.S. Department of Energy, the National Aeronautics and Space Administration, the Japanese Monbukagakusho, the Max Planck Society, and the Higher Education Funding Council for England. The SDSS Web Site is http://www.sdss.org/.
References
- Balogh et al. [2004] Balogh, M., et al. 2004, MNRAS, 348, 1355
- Bernardi et al. [2003] Bernardi, M., et al. 2003, AJ, 125, 1817
- Blake et al. [2004] Blake, C., et al. 2004, MNRAS, 355, 713
- Bruzual & Charlot [2003] Bruzual, G., & Charlot, S. 2003, MNRAS, 344, 1000
- Cimatti et al. [2006] Cimatti, A., Daddi, E., & Renzini, A. 2006, A&A, 453, L29
- Clemens et al. [2006] Clemens, M. S., Bressan, A., Nikolic, B., Alexander, P., Annibali, F., & Rampazzo, R. 2006, MNRAS, 370, 702
- Cowie et al. [1996] Cowie, L. L., Songaila, A., Hu, E. M., & Cohen, J. G. 1996, AJ, 112, 839
- De Lucia et al. [2006] De Lucia, G., Springel, V., White, S. D. M., Croton, D., & Kauffmann, G. 2006, MNRAS, 366, 499
- Doherty et al. [2005] Doherty M., Bunker A. J., Ellis R. S., McCarthy P. J., 2005, MNRAS, 361, 525
- Emsellem et al. [2004] Emsellem, E., et al. 2004, MNRAS, 352, 721
- Faber et al. [1997] Faber, S.M., Tremaine, S., Ajhar, E.A., Byun, Y-I., Dressler, A., Gebhardt, K., Grillmair, C., Kormendy, J., Lauer, T.R. & Richstone, D. 1997, AJ, 114, 1771
- Ferreras et al. [2006] Ferreras, I., Pasquali, A., de Carvalho, R. R., de la Rosa, I. G., & Lahav, O. 2006, MNRAS, 370, 828
- Gómez et al. [2003] Gómez, P. L., et al. 2003, ApJ, 584, 210
- Goto [2004] Goto, T. 2004, A&A, 427, 125
- Goto [2005] Goto, T. 2005, MNRAS, 357, 937
- Khochfar & Burkert [2005] Khochfar, S., & Burkert, A. 2005, MNRAS, 359, 1379
- Kurucz [1993] Kurucz, R. L. 1993, VizieR Online Data Catalog, 6039, 0
- Le Borgne et al. [2006] Le Borgne D., et al., 2006, ApJ, 642, 48
- Lewis et al. [2002] Lewis, I., et al. 2002, MNRAS, 334, 673
- Miller et al. [2003] Miller, C. J., Nichol, R. C., Gómez, P. L., Hopkins, A. M., & Bernardi, M. 2003, ApJ, 597, 142
- Miller & Owen [2001] Miller, N. A., & Owen, F. N. 2001, ApJL, 554, L25
- Nolan et al. [2006] Nolan, L. A., Harva, M. O., Kabán, A., & Raychaudhury, S. 2006, MNRAS, 366, 321
- Poggianti et al. [2006] Poggianti, B. M., et al. 2006, ApJ, 642, 188
- Porter & Raychaudhury [2006] Porter, S. C. and Raychaudhury, S. 2006, MNRAS, submitted
- Santos et al. [1995] Santos, J. F. C., Jr., Bica, E., Dottori, H., Ortolani, S., & Barbuy, B. 1995, A&A, 303, 753
- Tran et al. [2003] Tran, K.-V. H., Franx, M., Illingworth, G., Kelson, D. D., & van Dokkum, P. 2003, ApJ, 599, 865 T
- Treu et al. [2005] Treu, T., Ellis, R. S., Liao, T. X., & van Dokkum, P. G. 2005, ApJL, 622, L5
- Zabludoff et al. [1996] Zabludoff, A. I., Zaritsky, D., Lin, H., Tucker, D., Hashimoto, Y., Shectman, S. A., Oemler, A., & Kirshner, R. P. 1996, ApJ, 466, 104