Ellipsoidal Variability and Long Secondary Periods in MACHO Red Giant Stars
Abstract
We present a period-luminosity-amplitude analysis of 5899 red giant and binary stars in the Large Magellanic Cloud, using publicly available observations of the MACHO project. For each star, we determined new periods, which were double-checked in order to exclude aliases and false periods. The period-luminosity relations confirm the existence of a short-period, small-amplitude P–L sequence at periods shortward of Seq. A. We point out that the widely accepted sequence of eclipsing binaries between Seqs. C and D, known as Seq. E, does not exist. The correct position for Seq. E is at periods a factor of two greater, and the few stars genuinely lying between Seq. C and D are under-luminous Mira variables, presumably enshrouded in dust. The true Seq. E overlaps with the sequence of Long Secondary Periods (Seq. D) and their P–L relation is well described by a simple model assuming Roche geometry. The amplitudes of LSPs have properties that are different from both the pulsations and the ellipsoidal variations, but they are more similar to the former than the latter, arguing for pulsation rather than binarity as the origin of the LSP phenomenon.
Subject headings:
binaries: eclipsing — galaxies: individual (Large Magellanic Cloud) — stars: AGB and post-AGB — stars: oscillations — stars: statistics — stars: variables: other1. Introduction
The multiplicity of red giant period-luminosity (P–L) relations has been a major discovery on the road to interpreting complex light variations of these stars. Following the two seminal papers by Wood et al. (1999) and Wood (2000), a picture has emerged that can be summarized as follows: large-amplitude Mira stars pulsate in the fundamental mode, whereas smaller-amplitude semiregulars are often multimode pulsators, in which various overtone modes can be excited (see also Bedding & Zijlstra, 1998). Besides the pulsating P–L sequences (Seq. A, B and C, as labeled by Wood et al. (1999)), two other sequences were suggested: Seq. E with red giants in eclipsing binaries and Seq. D with stars that have long secondary periods (LSPs). The latter pose a great mystery and the nature of their slow variations is still not understood, with several different mechanisms proposed (Olivier & Wood, 2003; Wood et al., 2004).
The basic picture of multiple P–L relations has been confirmed by many independent studies, mostly based on -band magnitudes. It has emerged that the original five sequences have further details, including a break at the tip of the Red Giant Branch (RGB), which is due to the existence of distinct RGB pulsators that are mixed with the more evolved AGB variables (e.g. Ita et al., 2002; Kiss & Bedding, 2003, 2004; Ita et al., 2004a, b; Soszyński et al., 2004a; Fraser et al., 2005). Almost all authors have accepted the existence of the distinct sequences of red giant binaries (Seq. E) and LSP stars (Seq. D). The only exception was Soszyński et al. (2004b), who showed that Seqs. E and D seem to merge at a specific luminosity (as measured by the Wesenheit index) and suggested that this may imply the binary origin of LSPs.
Here we report on a combined analysis of MACHO observations of eclipsing binaries and red giants in the Large Magellanic Cloud, which shed new light on these stars and on the LSP phenomenon.
2. Data analysis and results
Our results are based on two sets of publicly available almost eight-year long MACHO light curves. A detailed description of the MACHO project can be found in Cook (1995). Some of the data are offered for download through the MACHO website (http://wwwmacho.mcmaster.ca), where one can choose specific samples based on an automated classification of variability type. Using the Web interface, we individually downloaded all light curves classified as eclipsing binaries (6833 stars) and as red giant variables (classified as Wood A, B, C and D classes; 2868 stars).
In the case of the eclipsing binaries, it became obvious very quickly that the classification was not perfect, and a large fraction of stars turned out to be Cepheids, RR Lyrae stars or long-period variables. We also found that the catalogued periods were incorrect for a significant number of stars. We therefore reclassified all 6833 stars and re-determined their periods, using the following procedure (more details will be given elsewhere).
Periods were first estimated using the Phase Dispersion Minimization method (Stellingwerf, 1978). We then checked all the folded light curves by eye and refined the periods with the String–Length method (Lafler & Kinman, 1965; Clarke, 2002), which is more reliable than PDM when the light curve contains long flat sections and very narrow minima, as is the case for many eclipsing binaries. Also, in many cases PDM gave harmonics or subharmonics of the true period, which was only recognized through the visual inspection of every phase diagram. We also examined the color variations to identify and exclude pulsating stars with sinusoidal light curves. After this analysis, 3031 stars remained as genuine eclipsing or ellipsoidal variables.
Next, we classified the binary sample using Fourier decomposition of their phase diagrams. Rucinski (1993) showed that light curves of W UMa systems (contact binaries) can be quantitatively described using only two coefficients, and , of the cosine decomposition . Pojmański (2002) tested the behavior of semi-detached and detached systems in the plane by decomposing theoretical light curves into Fourier coefficients. We found that only stars with “W UMa-like” light curve shape composed the sequence (which is plotted in Fig. 1), while detached and semi-detached systems are spread everywhere in the P–L plane.
Our second set of light curves were those of the 2868 publicly available MACHO red giant variables. Since they often show multiply periodic light variations, we determined periods with iterative sine wave fitting. As a measure of significance, we also estimated the ratio of the peaks in the Fourier spectra. Since the noise in the Fourier spectrum increased toward lower frequencies, different values of the were used when determining whether a peak was real for different period-luminosity relations ( cutoff was set to 3 for Seq. A′, 4 for Seq. A, 6 for Seqs. B, C and 10 for Seq. D). We omitted periods close to 1 yr, because many light curves show variations with this period that are not real. As a result, a total of 4315 significant frequencies were identified for the 2868 stars.
We studied these two samples in the P–L plane. In order to reduce the effects of interstellar extinction and allow a direct comparison with previous results in the literature, we plotted the period– magnitude relation. We obtained near infrared magnitudes by cross-correlation with the 2MASS All-Sky Point Source Catalog (http://irsa.ipac.caltech.edu), with a search radius of 3′′. The resulting P–L diagram is shown in the left panel of Fig. 1.
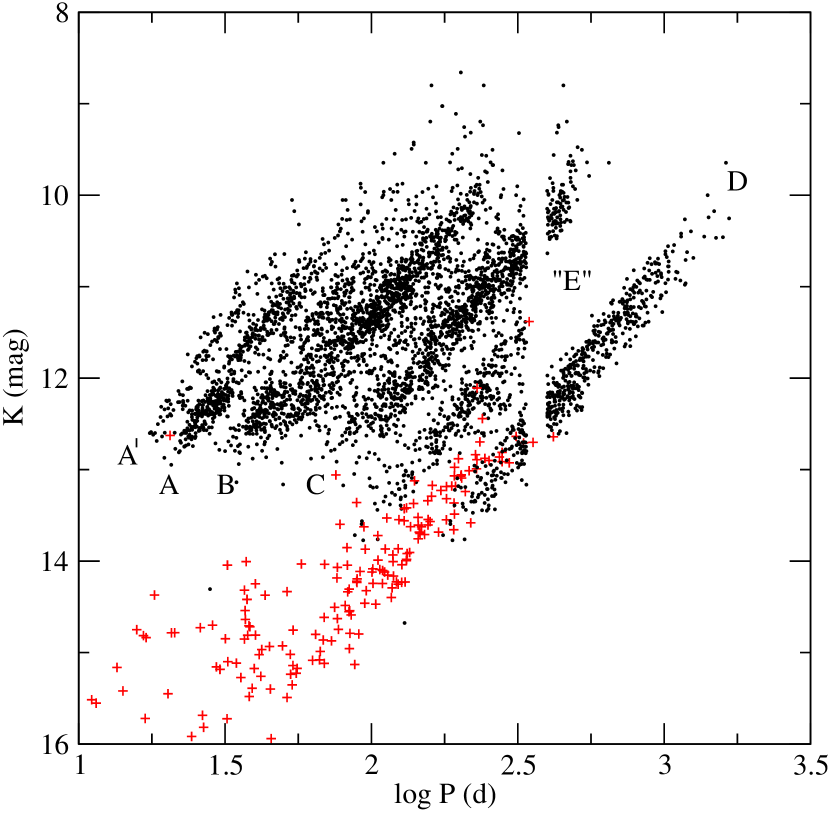
To our surprise, the P–L relation of the binary sample did not follow Seq. E, as we had expected. Instead, they overlapped with Seq. D, which at first sight appears to give strong evidence for the binary origin of Seq. D and prompted us to investigate the issue in more detail.
3. Discussion
The combined P–L plot in Fig. 1 shows the well-known complex structure of distinct sequences. Besides sequences A, B, C, D and E, we also detect the existence of the faintly visible new short-period P–L sequence (Seq. A′) on the left-hand side boundary of the diagram (labeled as a4 and b4 in Soszyński et al. (2004a) and in Kiss & Lah (2006)). The eclipsing stars (pluses) seem to merge with Seq. D rather than forming Seq. E as adopted in the literature (Wood et al., 1999; Wood, 2000; Kiss & Bedding, 2003, 2004; Ita et al., 2004a, b; Noda et al., 2004; Fraser et al., 2005).
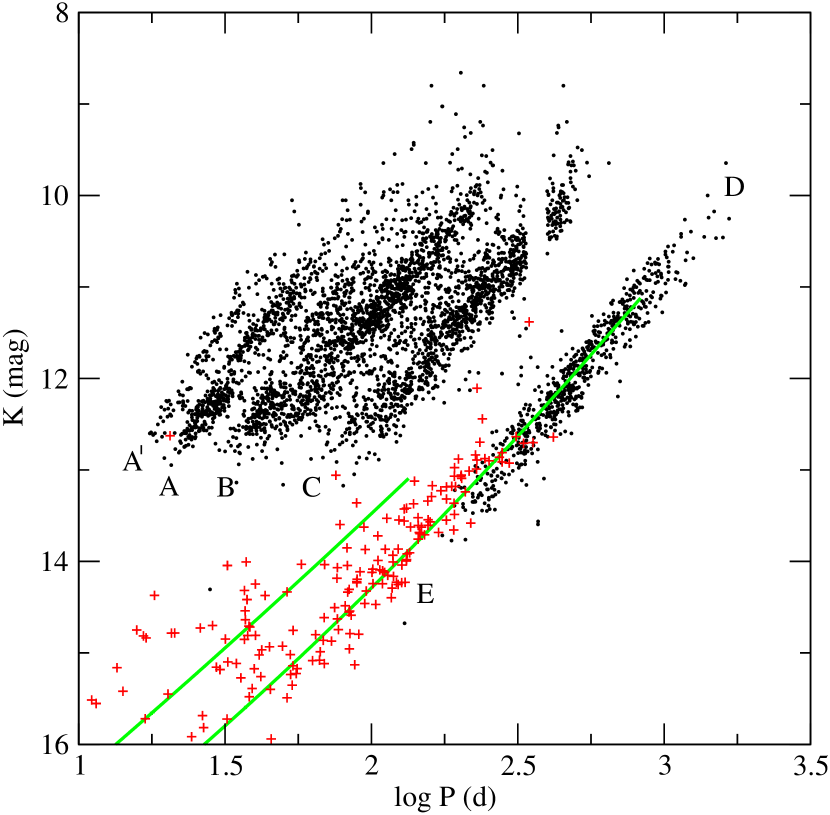
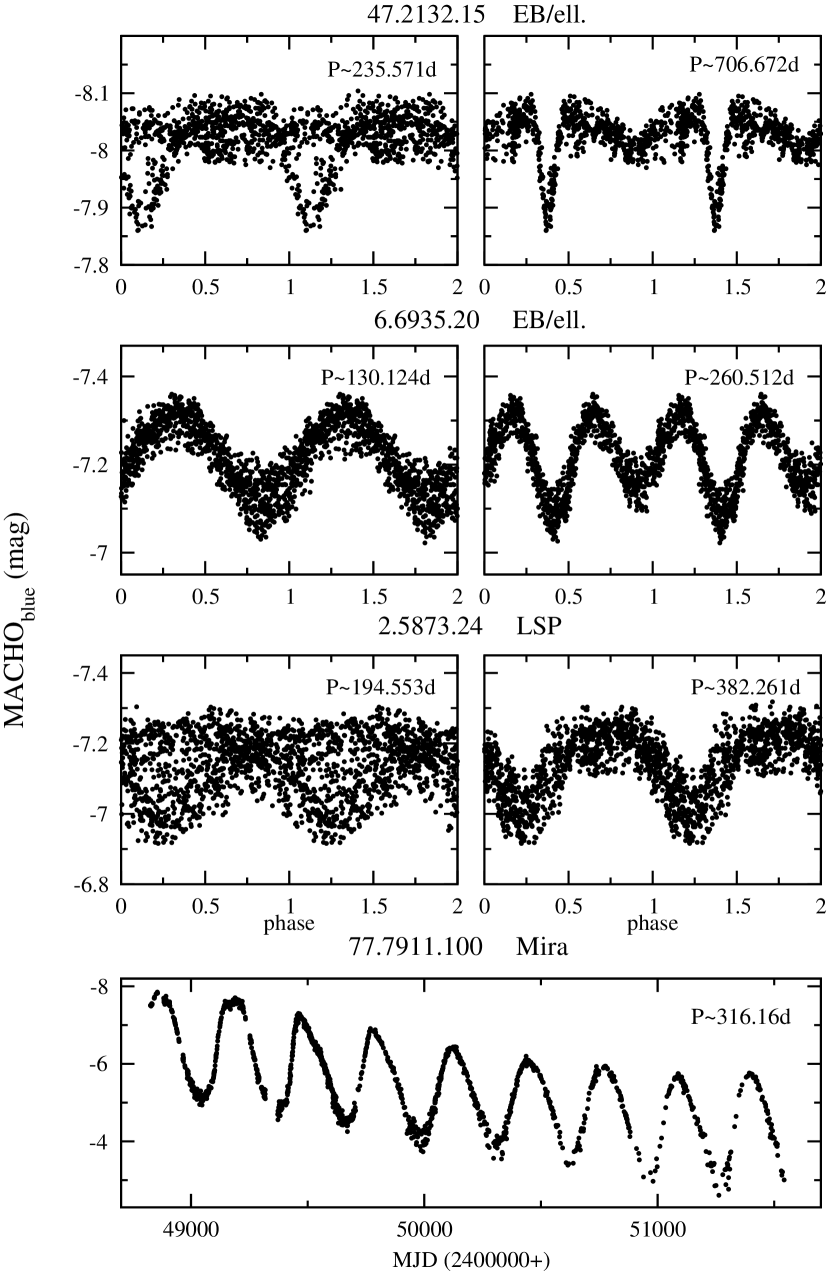
To clarify this issue, we re-checked periods for: (i) stars on Seq. E in Fig. 1 of Wood (2000), for which the identifiers and basic data were kindly provided by Peter Wood; (ii) stars on Seq. E in our Fig. 1 (black dots). In both cases, it turned out that for most of the objects, the given periods were half of the true ones, as one might expect from a Fourier analysis of eclipsing binary light curves. We have carefully double-checked all individual light curves on Seq. E and D and corrected the periods (see Fig. 2). The final P–L plot is shown in the right panel of Fig. 1.
As a result of the period correction, the sequence between C and D, which is known as Seq. E in the literature, has completely disappeared. A few stars remain in the gap but practically none of them are eclipsing binaries. The majority turn out to be Mira stars that are very red ( mag) and are presumably carbon-rich Miras that are dimmed by circumstellar dust clouds (bottom panel of Fig. 2). We propose to retain the label E for the sequence of ellipsoidal variables in its corrected position (right panel of Fig. 1).
In the literature, only Soszyński et al. (2004b) plotted the eclipsing binary sequence at the correct (doubled) period. However, they did not discuss this issue and one can still find more recent studies where Seq. E was shown at the wrong period. Soszyński et al. (2004b) have, however, shown that Roche geometry gives a good fit to the OGLE ellipsoidal variables. We have also checked this on the MACHO sample. We calculated the theoretical orbital periods of systems at mass ratios of 1, where the components fill their Roche lobes. For this, we used evolutionary models of Castellani et al. (2003) and applied equations of Section 4 in Soszyński et al. (2004b). (Note, however, that the definition of in their Eq. 1 actually gave as the filling factor.) For the calculations we took the evolutionary tracks of the 0.85 and 2.5 models, since theses masses represent the mass limits of stars that evolve through the RGB and AGB. The magnitudes of the models were determined from vs. calibrations, combined from Houdashelt et al. (2000) and Kučinskas et al. (2006).
In the right panel of Fig. 1 we show these two limits (the shorter period line belongs to the higher mass). For any other mass ratios, the orbital periods shift towards smaller values. This simple approach with Roche geometry describes remarkably well the observed period-luminosity relation of ellipsoidal variables in the MACHO sample, in agreement with the study of Soszyński et al. (2004b). However, the OGLE sample contains a larger fraction of ellipsoidals and most of them have longer periods than are predicted by the models. Those stars do not entirely fill the Roche lobe (Soszyński et al., 2004b). It is also worth mentioning that the low fraction of ellipsoidal/eclipsing RGB stars in the MACHO data (1.5%) was used by Wood et al. (2004) as an argument against the binary origin of LSPs. However, the OGLE statistics clearly showed that there are at least 10 times more such RGB stars, and so that argument is no longer valid.
Since the lower mass model fits Seq. D quite well, the question arises: how similar are the ellipsoidal and LSP variables? To assess this, we examined the amplitudes of these stars. Soszyński et al. (2004b) mentioned that amplitudes of LSPs are positively correlated with the brightness of the star. Compared to OGLE data, the MACHO observations have the advantage of giving information on the color variations. We examined the amplitudes in the MACHO blue and red bands of the binary and LSP stars, and also included Seq. C stars, which allow a comparison with stars that we know to be pulsating.
The amplitudes were measured by fitting smooth spline functions to the phased light curves. The resulting blue peak-to-peak amplitudes are shown as a function of magnitude in Fig. 3, where several features are apparent. Firstly, the amplitudes of ellipsoidal variables (circles in the upper panel) do not show any correlation with luminosity, as expected for variation caused by the geometry of a binary system. Secondly, the amplitudes of LSP variables (crosses in the upper panel) increase with luminosity, with their distribution forming a striking triangular envelope (the correlation coefficient is ). It is also very interesting that the points below the well-defined upper envelope seem to show a flat distribution. Whatever the cause of the LSP phenomenon, there appears to be a maximum possible amplitude at each luminosity, with an apparently uniform distribution of amplitudes beneath this maximum value.
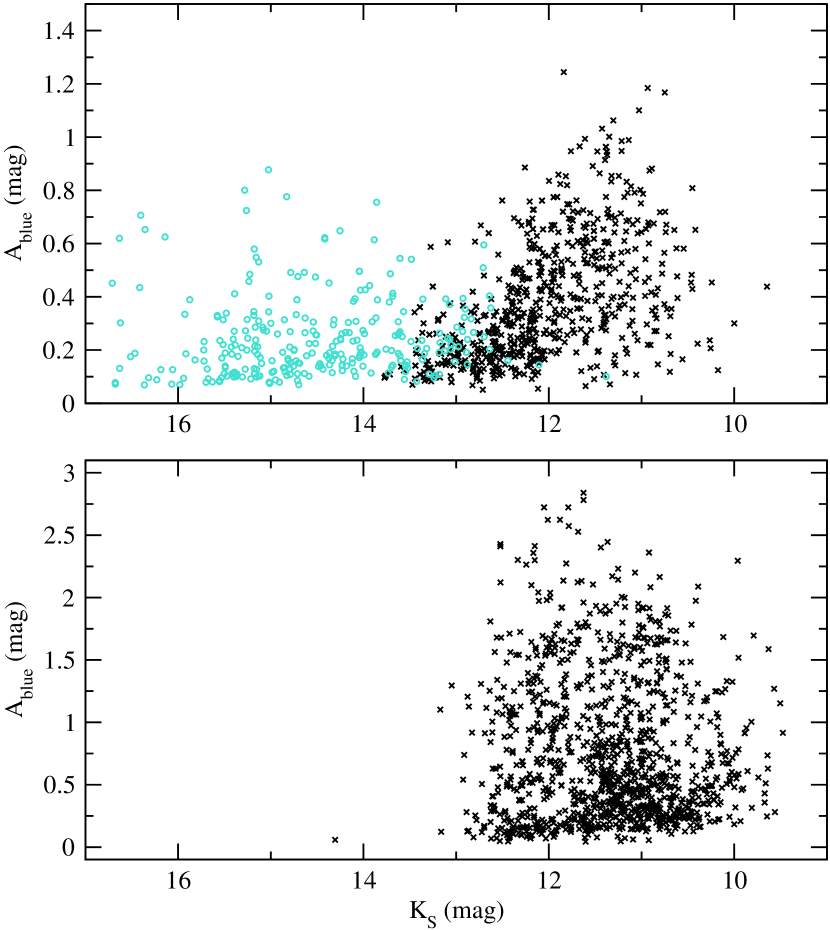
In comparison, stars on the pulsating P–L sequence C (lower panel in Fig. 3), show a very different distribution. To quantify the difference between the amplitude-luminosity distribution of Seqs. C and D, we performed the multivariate -test of Székely & Rizzo (2004), applied for two dimensions. In this test we measure the effects of random permutations of the initial distributions via changes in the “information energy” of the two distributions. In our case, 1000 random permutations showed that the difference between the C and D samples is highly significant. Therefore, we conclude that the physical mechanism causing the LSP phenomenon must be different from both the ellipsoidal variations of Seq. E and the radial fundamental-mode pulsations of Seq. C. Note, however, that for Seqs. A and B, there is a similar positive correlation between amplitude and luminosity (see the upper three panels in figs. 4 in Kiss & Bedding (2003) and Kiss & Bedding (2004)) than for Seq. D.
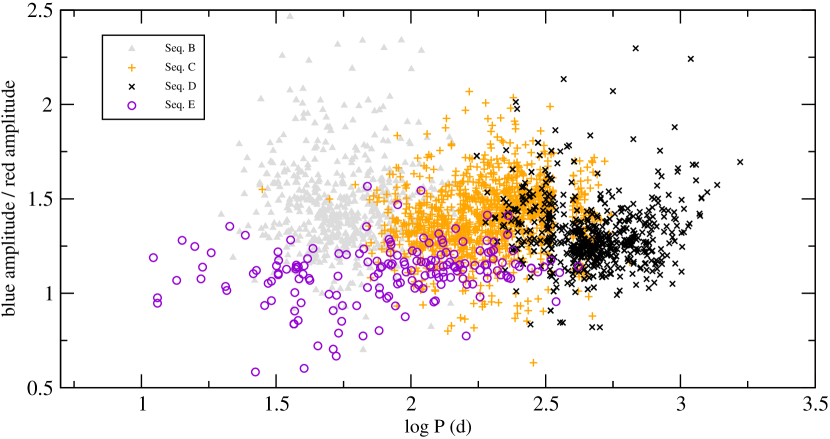
At the same time, comparing blue and red amplitudes for individual stars revealed further interesting information. In Fig. 4 we plot the blue-to-red amplitude ratios as function of period for Seqs. B, C, D and E stars. For the pulsating objects the median of the ratio is 1.40, indicating strong color, thus temperature, changes during the pulsations. For ellipsoidal/eclipsing binaries, the median ratio is 1.13, while the LSPs have a median ratio of 1.29, being more similar to the pulsating stars (see also Huber et al., 2003). This behavior agrees with the findings of Wood et al. (2004) who, based on color-amplitude variations of single objects, argued for the pulsational origin of LSPs. The overall statistics of more than 700 LSP variables favors this argument over the binary hypothesis, also agreeing with Hinkle et al. (2002), who concluded that the long-period velocity changes in their observed stars probably result from some kind of pulsation.
4. Summary
The main results of this paper can be summarized as follows:
-
the period-luminosity relations of 6000 stars based on MACHO data confirm the existence of the short-period, small-amplitude P–L sequence at shortward of Seq. A, which belongs to a higher-overtone pulsation mode. We label this Seq. A′.
-
the widely accepted sequence of eclipsing binaries between C and D, known as Seq. E, does not exist. The correct position for Seq. E, which comprises contact binaries and ellipsoidal variables, is at periods a factor of two greater. The true Seq. E overlaps with the LSPs (Seq. D), which appears to suggest a binary origin for the LSP phenomenon (but see the last point).
-
of the few stars that genuinely lie between Seq. C and D, most are under-luminous Mira variables, presumably enshrouded in dust.
-
we confirmed that ellipsoidal variables have a similar P–L relation to LSP stars. Their P–L relation is well described by a simple model assuming Roche geometry.
-
the amplitudes of LSPs have properties that are different from both the pulsations and the ellipsoidal variations, but they are more similar to the former than the latter, arguing for pulsation rather than binarity as the origin of the LSP phenomenon.
References
- Bedding & Zijlstra (1998) Bedding, T. R., Zijlstra, A. A., 1998, ApJ, 506, 47
- Castellani et al. (2003) Castellani, V., Degl’Innocenti, S., Marconi, M., Prada Moroni, P. G., & Sestito, P., 2003, A&A, 404, 645
- Clarke (2002) Clarke, D., 2002, A&A, 386, 763
- Cook (1995) Cook, K. H., Alcock, C., Allsman, H. A., et al. 1995, ASP Conf. Ser., 83, 221
- Fraser et al. (2005) Fraser, O. J., Hawley, S. L., Cook, K. H., & Keller, S. C., 2005, AJ, 129, 768
- Hinkle et al. (2002) Hinkle, K. H., Lebzelter, T., Joyce, R. R., & Fekel, F. C., 2002, AJ, 123, 1002
- Houdashelt et al. (2000) Houdashelt, M. L., Bell, R. A., Sweigart, A. V., & Wing, R. F., 2000, AJ, 119, 1424
- Huber et al. (2003) Huber, J. P., Bedding, T. R., O’Toole, S. J., 2003, aahd.conf., 421
- Ita et al. (2002) Ita, Y., et al., 2002, MNRAS, 337, L31
- Ita et al. (2004a) Ita, Y., et al., 2004a, MNRAS, 347, 720
- Ita et al. (2004b) Ita, Y., et al., 2004b, MNRAS, 353, 705
- Kiss & Bedding (2003) Kiss, L. L., & Bedding, T. R., 2003, MNRAS, 343, L79
- Kiss & Bedding (2004) Kiss, L. L., & Bedding, T. R., 2004, MNRAS, 347, L83
- Kiss & Lah (2006) Kiss, L. L., & Lah, P., 2006, Mem. S. A. It., 77, 303
- Kučinskas et al. (2006) Kučinskas, A., et al., 2006, A&A, 452, 1021
- Lafler & Kinman (1965) Lafler, J., & Kinman, T. D., 1965, ApJS, 11, 216
- Noda et al. (2004) Noda, S., et al., 2004, MNRAS, 348, 1120
- Olivier & Wood (2003) Olivier, E. A., & Wood, P. R., 2003, ApJ, 584, 1035
- Pojmański (2002) Pojmański, G., 2002, Acta Astron., 52, 397
- Rucinski (1993) Rucinski, S. M., 1993, PASP, 105, 1433
- Soszyński et al. (2004a) Soszyński, I., et al., 2004a, Acta Astron., 54, 129
- Soszyński et al. (2004b) Soszyński, I., et al., 2004b, Acta Astron., 54, 347
- Stellingwerf (1978) Stellingwerf, R. F., 1978, ApJ, 224, 953
- Székely & Rizzo (2004) Székely G.J., & Rizzo M.L., 2004, InterStat, 2004 November, 5
- Wood et al. (1999) Wood, P. R., et al., 1999, IAUS, 191, 151
- Wood (2000) Wood, P. R., 2000, PASA, 17, 18
- Wood et al. (2004) Wood, P. R., Olivier, E. A., & Kawaler, S. D., 2004, ApJ, 604, 800