Empirical Models for Dark Matter Halos. III. The Kormendy relation and the – relation
Abstract
We have recently shown that the 3-parameter density-profile model from Prugniel & Simien provides a better fit to simulated, galaxy- and cluster-sized, dark matter halos than an NFW-like model with arbitrary inner profile slope (Paper I). By construction, the parameters of the Prugniel-Simien model equate to those of the Sérsic function fitted to the projected distribution. Using the Prugniel-Simien model, we are therefore able to show that the location of simulated () galaxy-sized dark matter halos in the – diagram coincides with that of brightest cluster galaxies, i.e., the dark matter halos appear consistent with the Kormendy relation defined by luminous elliptical galaxies. These objects are also seen to define the new, and equally important, relation , in which is the internal density at . Simulated () cluster-sized dark matter halos and the gas component of real galaxy clusters follow the relation . Given the shapes of the various density profiles, we are able to conclude that while dwarf elliptical galaxies and galaxy clusters can have dark matter halos with effective radii of comparable size to the effective radii of their baryonic component, luminous elliptical galaxies can not. For increasingly large elliptical galaxies, with increasingly large profile shapes , to be dark matter dominated at large radii requires dark matter halos with increasingly large effective radii compared to the effective radii of their stellar component.
1 Introduction
Although Jaffe (1983), Hernquist (1990), and Dehnen (1993) introduced their highly useful density-profile models to match the deprojected form of de Vaucouleurs’ (1948) model, these models do not immediately yield the types of structural quantities measured nightly by observers. For example, observers typically refer to a galaxy’s (projected) half-light radius and surface density at this radius. On the other hand, modelers frequently use the Navarro, Frenk, & White (1995, hereafter NFW) model — a modified version of Hernquist’s model — and report scale radii111Due to the divergence of the mass of the NFW model, a half-light radii cannot be defined. and scale densities ( and ) where the slope of the (internal) density profile equals . Or, typically, they might report on the ‘concentration’, related to the ratio of with the average background density of the universe, or the ratio of with the halo’s virial radius.
Recently, alternatives to both the NFW model, and it’s generalization with arbitrary inner profile slope , have been shown to provide better fits to the density profiles of simulated dark matter halos (e.g., Merritt et al. 2006, hereafter Paper I, and references therein). Considering fits to galaxy- and cluster-sized dark matter halos built from hierarchical CDM simulations, and fits to dark matter halos constructed from cold spherical collapses, two density models stand out (Paper I).
The first is Einasto’s (1965) model; see Tenjes, Haud, & Einasto (1994) for a more recent application. This model has the same functional form as Sérsic’s (1963, 1968) model but is applied to internal (3D) density profiles rather than projected surface density profiles. Although we will not be using Einasto’s model in this paper, having studied it in Paper I and Graham et al. (2006, hereafter Paper II), we note that it has recently been applied to halos by Navarro et al. (2004), Diemand, Moore, & Stadel (2004b), and Merritt et al. (2005).
The second density model, by Prugniel & Simien (1997), which is used here, is of particular interest because it is defined using two of the three parameters contained in Sérsic’s (light-profile) model. Indeed, the Prugniel-Simien model was developed to match the deprojected form of Sérsic’s model. Specifically, the (projected) effective radius and the (projected) profile shape are common to both. The third parameter in Prugniel & Simien’s model, , an internal density term at , can readily be used to obtain the associated surface density, , at the projected radius . This model therefore allows one to directly compare the structural properties of simulated dark matter halos with the structure of real galaxies and clusters, and to do so using a better fitting function than the generalized NFW model. In addition, Terzić & Graham (2005) have already shown that the Prugniel-Simien model describes the deprojected light-profiles of real elliptical galaxies better than the Jaffe, Hernquist and Dehnen models.
For both real spheroidal stellar systems and simulated dark matter halos alike, we have been able to plot their location on diagrams of mass versus: profile shape, effective radius, effective surface density, and effective internal (3D) density. In the latter three figures, the galaxy-sized dark matter halos are observed to be consistent with the high-mass extension of ordinary elliptical galaxies. Moreover, the cluster-sized dark matter halos are seen to coincide with the location of real galaxy clusters in all four diagrams, and possibly define a trend in the and diagrams. This is suggestive that the same (mass-dependent) physical processes are in operation in the real and simulated systems.
While it remains unclear as to why the simulated galaxy-sized halos do not follow the mass versus profile shape () relation defined by real elliptical galaxies (although see Nipoti & Ciotti 2006), we have been able to use this observation to constrain the galaxy-to-halo size ratio. In order for (dwarf and giant) elliptical galaxies to be dark matter dominated at large radii, we show that this ratio must increase with galaxy mass.
Due to the use of the Prugniel-Simien density-profile model, we have also been able to show, for the first time, the location of simulated dark matter halos in the Kormendy (1977) diagram. Within this plane of effective surface density versus effective radius, luminous elliptical galaxies are observed to follow the relation (e.g., Hamabe & Kormendy 1987; Graham 1996; La Barbera et al. 2004). Intriguingly, the galaxy-sized dark matter halos also appear consistent with this relation. Furthermore, we present a new diagram, and relation, using the internal (3D) effective density. Not only do the galaxy-sized dark matter halos follow the same linear trend defined by luminous elliptical galaxies, but the real galaxy clusters and cluster-sized dark matter halos follow their own linear relation which is offset in density by two orders of magnitude. Such scaling laws refelct important regulatory mechanisms that dictate the formation and growth of galaxies and their dark matter halos, and as such these relations provide both inisght into these processes and useful constraints for galaxy modelling.
In the following Section we present the mathematical form of the Prugniel-Simien model. In Section 3 we introduce the simulated and real data sets which are subsequently compared with each other in Section 4. Section 4.1 shows trends with mass while Section 4.2 presents the – and the – diagrams. A brief summary is given in Section 5.
2 The Prugniel-Simien model: A deprojected Sérsic model
The density model presented in Prugniel & Simien (1997, their equation B6) was designed to match the deprojected form of Sérsic’s (1963) function used for describing the projected distribution of light in elliptical galaxies. Sérsic’s model can be written in terms of the projected intensity profile, such that
| (1) |
where is the surface flux density, i.e. the intensity, at the (projected) effective radius . The third parameter describes the curvature, or shape, of the light profile. The remaining term is not a parameter but a function of chosen so that encloses half of the (projected) total galaxy light. It can be obtained by solving the expression (e.g., Ciotti 1991, his Equation 1), where the quantity is the gamma function and is the incomplete gamma function given by
| (2) |
Although we use the exact solution for , a good approximation is given in Prugniel & Simien (1997) as
| (3) |
A more detailed review of the Sérsic function can be found in Graham & Driver (2005).
Prugniel & Simien’s (internal) density profile model can be expressed as
| (4) |
The shape and radial scale parameters and will be recognizable from equation 1, as will the quantity . The third parameter, , is the internal density at the radius . The final quantity is not a parameter but a function of chosen to maximize the agreement between the Prugniel-Simien model and a deprojected Sérsic model having the same parameters and . Over the radial interval , a good match is obtained when
| (5) |
(Lima Neto et al. 1999; see also Paper I, their Figure 13).
The value of is also responsible for determining the inner logarithmic slope of the density profile (see Paper II). Setting , the Prugniel-Simien model has the same functional form as Sérsic’s model. When this function (with ) is applied to density profiles, we refer to it as Einasto’s (1965) model.
As noted in Lima Neto et al. (1999) and Márquez et al. (2001), the associated mass profile of equation 4 is given by the equation
| (6) |
where . The total mass is obtained by replacing with . Expressions for the associated gravitational potential, force, and velocity dispersion can be found in Terzić & Graham (2005).
Equating the volume-integrated mass from equation 4 (i.e., the total mass from equation 6) with the area-integrated mass from equation 1 (), the projected density, , at the projected radius is given by
| (7) |
The inverse mass-to-light ratio converts the mass density into a flux density, . New comparisons of dark matter halos (fitted with the Prugniel-Simien model) with real galaxies (fitted with Sérsic’s model) can now readily be made.
3 The Data
3.1 Simulated dark matter halos
We use a sample of six cluster-sized halos (models: A09, B09, C09, D12, E09, and F09) resolved with 5 to 25 million particles within the virial radius, and four galaxy-sized halos (models: G00, G01, G02, and G03) resolved with 2 to 4 million particles. Specific details about these relaxed, dark matter halos formed from a hierarchical CDM simulation are reported in Diemand, Moore, & Stadel (2004a,b).
We have taken the profile shapes and the effective radii from the best-fitting Prugniel-Simien models applied in Paper I. These quantities are equivalent to the values of and obtained when fitting Sérsic’s model to their projected distribution. To obtain the halo’s (projected) surface density, , at the projected radius , we solved for in equation 7 to obtain . Another quantity frequently used by observers is the average (projected) surface density within the radius . It is denoted by and given by the expression
| (8) |
(e.g. Graham & Colless 1997, their Appendix A).
Lastly, we have used the virial masses reported in Diemand et al. (2004a). Although a standard quantity, we do note in passing that the virial radii associated with these masses do not actually denote the outer boundary of each halo. For example, Prada et al. (2006) report on measurements out to several virial radii. For our sample of ten halos, the virial radii are 1.5 times larger than the (projected) effective radii. If we were to instead use the total mass from equation 9 below, it would be up to 2 times larger. The consequences of this would only influence the position of the halo masses plotted in Figure 1.
3.2 Real galaxies and galaxy clusters
We have used the nearby () elliptical galaxy compilation presented in Graham & Guzmán (2003). It consists of 250 dwarf and giant elliptical galaxies spanning a range in absolute magnitude from to -mag. The bulk of these objects have had their light-profiles fitted with Sérsic’s model. Before comparing the dark matter halo parameters with those from the stellar distribution in real galaxies, we first had to convert the galaxy absolute magnitudes () into masses, and convert their surface densities from mag arcsec-2 to solar density per square parsec.
We used the following simple approach to convert the -band fluxes into masses. Each galaxy’s stellar mass is simply given by
| (9) |
where the -band stellar (not total) mass-to-light ratio (Worthey 1994, for a 12 Gyr old SSP) and the absolute magnitude of the Sun is taken to be -mag (Cox 2000).
The surface density at , denoted by , was transformed such that
| (10) | |||||
where is the distance modulus, equal to (Distance [Mpc]), to each galaxy and (Distance [Mpc]) is the number of parsec corresponding to 1 arcsecond at the distance of each galaxy. This equation subsequently reduces to
| (11) | |||||
The internal density at , denoted by , was derived using equation 7.
The galaxy cluster data used in this paper has come from Demarco et al. (2003) who fit Sérsic’s model to the projected X-ray gas distribution observed by ROSAT in two dozen clusters. We have used the Sérsic scale radii222We converted their scale radii, , into effective radii using . and profile shapes333Note: Demarco et al. (2003) used . from their Table 2, along with the central surface densities and gas masses listed in their Table 3.
4 Parameter correlations
In this section we directly compare the structural parameters of the (-body) dark matter halos, modeled in Paper I, with the parameters of real elliptical galaxies and real galaxy clusters.
4.1 Trends with mass
Figure 1 shows the virial masses of ten -body halos, together with the stellar masses from the Graham & Guzmán (2003) sample of elliptical galaxies, and the tabulated gas masses for 24 galaxy clusters studied in Demarco et al. (2003). These masses are plotted against the shape of the density distributions (), the effective radii (), the effective surface densities (), and the internal densities, , at .
The existence of a deviations, and a luminosity-dependent trend, in the shape of the light-profiles of elliptical galaxies has been known for two decades (e.g., Michard 1985; Schombert 1986; Caldwell & Bothun 1987; Capaccioli 1987; Kormendy & Djorgovski 1989, their Section 7.1). In Figure 1a we explore how this trend compares with the structure of simulated dark matter halos. The galaxy-sized dark matter halos are seen to have smaller profile shapes, , than elliptical galaxies of comparable mass. A further mismatch in this diagram arises from the fact that stars in elliptical galaxies are known to have a range of distributions, i.e. profile shapes (10; e.g. Phillipps et al. 1998; Caon, Capaccioli, & D’Onofrio 1993), whereas -body dark matter halos have shape parameters (this discrepancy was previously noted by Łokas & Mamon 2001 for NFW halos). Transforming the -band absolute magnitude– relation in Graham & Guzmán (2003, their Figure 10) into a mass relation using equation 9 gives
| (12) |
At odds with the slope of the relation for the elliptical galaxies is the slope of the line connecting the simulated cluster-sized halos with the simulated galaxy-sized halos — which has the opposite sign (as noted by Lokas & Mamon 2001, and also seen in Figure 4 of Merritt et al. 2005). Here, for the first time, we have included (real) galaxy clusters in this diagram; they appear well connected with the simulated cluster-sized halos, strengthening support for the cluster simulations. It would be interesting to know where the intermediate-mass population (: galaxy groups) reside in this diagram.
In Figure 1b, the scale sizes, , of the galaxy-sized halos appear consistent with the (extrapolated) high-mass end of the elliptical galaxy distribution in this diagram. The curved line shown in this panel has been derived from the – relation in Graham & Guzmán (2003, the dotted curved in their Figure 12) and the relation , where is the average (projected) intensity within . This relation simply states that the total luminosity equals twice the projected luminosity inside of the effective half-light radius.
The galaxy-sized halos are also consistent with the extrapolated relation between mass and for elliptical galaxies, shown in Figure 1c. As discussed in Graham & Guzmán (2003), the – relation is curved, as is its mapping into the Mass– plane shown here. The Kormendy relation, which applies to high-mass elliptical galaxies, has a slope of 1/4 in this diagram, and the change in slope below is well understood (Graham & Guzmán 2003, their section 4).
The high-mass arm of the elliptical galaxy distribution in Figure 1d reaches out to encompass the location of the galaxy-sized halos. The curved line shown there has been derived from the lines in Figures 1a-c together with equation 7. Aside from the shape of the density distribution (Figure 1a), the ‘effective’ parameters of galaxy-sized dark matter halos are seen to follow the relations defined by elliptical galaxies. That is, their (projected)444We note that the internal radius which defines a volume enclosing half of the mass is not equal to . half-mass radii and the density at these radii obey the trends defined by the stellar mass component of elliptical galaxies.
The structural properties of the cluster-sized halos appear largely consistent with, or rather, for an extension to the distribution of galaxy clusters in every panel.

4.2 The Kormendy relation and the – plane
Figure 2a shows the effective radius, , versus the average (projected) surface density inside of , . We have been able to augment this diagram with the brightest cluster galaxy (BCG) sample from Graham et al. (1996, their Table 1) that were fitted with Sérsic’s model. This required converting their -band surface brightness data to the -band using the average color (Fukugita, Shimasaku, & Ichikawa 1995), applying equation 11 to obtain the surface density at in units of solar masses per square parsec, and then deriving from using equation 8. (No reliable stellar masses exist for these galaxies.) We note that the effective radii of the BCGs with large Sérsic indices are, in some instances, greater than the observed radial extent of the BCG. As such, these scale radii are reflective of the Sérsic model which matches the observed portion of the galaxy. Subject to how the outer profiles truncate, these radii may or may not represent the actual half-light radii. The solid line in Figure 2a has a slope of 1/3, typical of the Kormendy relation for luminous elliptical galaxies. The departure of the lower-luminosity elliptical galaxies from this relation is explained in Graham & Guzmán (2003, their Section 4, see also Capaccioli & Caon 1991 and La Barbera et al. 2002).
The apparent agreement between the galaxy-sized dark matter halos and the BCGs implies that, within their respective effective radii, the average projected mass density in stars (in the case of the BCGs) and in dark matter (in the case of the halos) is equal. It will be of interest to see if less massive (dwarf-galaxy-sized) halos follow the Kormendy relation to higher densities (to the right in this figure) or depart from this relation555We remind readers that surface density is given by (column density per unit area), and thus more negative numbers reflect an increased density..

Figure 2b shows , the internal density at , versus . The obvious relation for the luminous elliptical galaxies and the galaxy-sized dark matter halos is such that
| (13) |
where is in kpc and is in units of solar masses per cubic parsec. It is noted that this only describes the pan-handle of a more complex distribution seen in this figure, but is, we feek, nonetheless of interest.
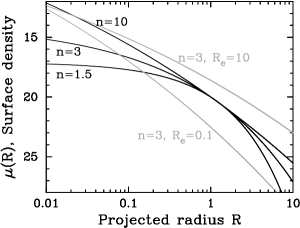
Of course, the above relation would only imply an equal stellar-to-dark matter density ratio at in galaxies if the stellar and dark matter components had the same value of . This situation, however, can not exist if large elliptical galaxies (with large values of ) are to have dark matter halos (with 3) that dominate the mass at large radii, as suggested by, for example, the analysis of X-ray halo gas by Humphrey et al. (2006) and Sansom et al. (2006). This predicament is illustrated in Figure 3. The obvious, but previously unstated, answer is that dark matter halos in large elliptical galaxies must have larger effective radii than the stellar distribution’s effective radii. On the other hand, given that the profile shapes of dwarf elliptical galaxies typically have Sérsic indices less than 2 (Figure 1a), a dwarf galaxy can have a dark matter halo (with 3) that has the same effective radius as the stellar component, and still be dark-matter dominated at all radii. The above situation can be visualized in Figure 3.
The simulated dark matter cluster-sized halos and the gas component of real galaxy clusters also appear to have similar structural properties in Figure 2. Specifically, in Figure 2b, the two populations reside in a similar part of the diagram and possibly define their own relation offset by a factor of 6 in , or 100 in density from that defined by the galaxies and galaxy-sized halos. Their distribution is traced by the relation
| (14) |
Similarly with dwarf elliptical galaxies, the low- profile shapes (see Figure 1a) of galaxy clusters means that their stellar-to-dark matter effective radii can be comparable with the dark matter still dominating at all radii, expect, of course, inside a cluster’s centrally-located BCG.
The tabulated dynamical masses in Demarco et al. (2003) are roughly five times greater than the tabulated gas masses that we have used. Similarly, using their equation 5 to obtain the (internal) dark matter-to-gas density ratio at , one also obtains an average value around five. We do not, however, know the effective radii of these cluster’s dark matter components and so we can not show where they reside in Figure 2.
5 Summary
Simulated galaxy-sized dark matter halos appear largely consistent with the location of brightest cluster galaxies in the – plane. Indeed, the halos appear congruent with the Kormendy relation. Interestingly, the galaxy-sized halos also appear to follow the same relation as luminous elliptical galaxies in the – plane, defining a new relation . Using this information, coupled with knowledge of the stellar and density profile shapes, we are able to make statements about the relative effective radii of stellar-to-dark matter distributions in galaxies and clusters. Specifically, while large elliptical galaxies require a small ratio of their stellar-to-dark matter effective radii, dwarf galaxies and galaxy clusters could have a size ratio of unity or larger and still be dark matter dominated. The galaxy clusters and simulated cluster-sized dark matter halos appear to define a new relation given by .
References
- (1) Binggeli, B., & Jerjen, H. 1998, A&A, 333, 17
- (2) Caon, N., Capaccioli, M., & D’Onofrio, M. 1993, MNRAS, 265, 1013
- (3) Capaccioli, M. 1987, in Structure and Dynamics of Elliptical Galaxies, IAU Symp. 127, Reidel, Dordrecht, p.47
- (4) Capaccioli, M., & Caon, N. 1991, MNRAS, 248, 523
- (5) Ciotti, L. 1991, A&A, 249, 99
- (6) Cox, D.P. 2000, Allen’s Astrophysical quantities, New York: AIP Press; Springer
- (7) Dehnen, W. 1993, MNRAS, 265, 250
- (8) Demarco, R., Magnard, F., Durret, F., & Márquez, I. 2003, A&A, 407, 437
- (9) de Vaucouleurs, G. 1948, Ann. d’astrophys., 11, 247
- (10) Diemand, J., Moore, B., & Stadel, J. 2004a, MNRAS, 352, 535
- (11) Diemand, J., Moore, B., & Stadel, J. 2004b, MNRAS, 353, 624
- (12) D’Onofrio, M., Capaccioli, M., & Caon, N. 1994, MNRAS, 271, 523
- (13) Einasto, J. 1965, Trudy Inst. Astrofiz. Alma-Ata, 5, 87
- (14) Faber, S.M., et al. 1997, AJ, 114, 1771
- (15) Fukugita, M., Shimasaku, K., & Ichikawa, T. 1995, PASP, 107, 945
- (16) Graham, A.W. 1996, ApJ, 459, 27
- (17) Graham, A.W., & Colless, M.M. 1997, MNRAS, 287, 221
- (18) Graham, A.W., Driver, S., Petrosian, V., Conselice, C.J., Bershady, M.A., Crawford, S.M., & Goto, T. 2005, AJ, 130, 1535
- (19) Graham, A.W., & Guzmán, R. 2003, AJ, 125, 2936
- (20) Graham, A.W., Lauer, T., Colless, M.M., & Postman, M. 1996, ApJ, 465, 534
- (21) Graham, A.W., Merritt, D., Moore, B., Diemand, J., & Terzić, B. 2006, AJ, submitted (Paper II)
- (22) Hamabe, M., & Kormendy, J. 1987, IAU Symp. 127: Structure and Dynamics of Elliptical Galaxies, 127, 379
- (23) Hernquist, L. 1990, ApJ, 356, 359
- (24) Humphrey, P.J., Buote, D.A., Gastaldello, F., Zappacosta, L., Bullock, J.S., Brighenti, F., & Mathews, W.G. 2006, ApJ, 646, 899
- (25) Jaffe, W. 1983, MNRAS, 202, 995
- (26) Kormendy, J. 1977, ApJ, 218, 333
- (27) Kormendy, J., & Djorgovski, S. 1989, ARA&A, 27, 235
- (28) La Barbera, F., Busarello, G., Merluzzi, P., Massarotti, M., & Capaccioli, M. 2002, ApJ, 595, 127
- (29) La Barbera, F., Merluzzi, P., Busarello, G., Massarotti, M., & Mercurio, A. 2004, A&A, 425, 797
- (30) Lima Neto, G.B., Gerbal, D., & Márquez, I. 1999, MNRAS, 309, 481
- (31) Łokas, E.L., & Mamon, G.A. 2001, MNRAS, 321, 155
- (32) Márquez, I., Lima Neto, G.B., Capelato, H., Durret, F., Lanzoni, B., & Gerbal, D. 2001, A&A, 379, 767
- (33) Merritt, D., Graham, A.W., Moore, B., Diemand, J., & Terzić, B. 2006, AJ, submitted (Paper I)
- (34) Merritt, D., Navarro, J.F., Ludlow, A., & Jenkins, A. 2005, ApJL, 624, L85
- (35) Michard, R. 1985, A&AS, 59, 205
- (36) Navarro, J.F., Frenk, C.S., & White, S.D.M. 1995, MNRAS, 275, 720
- (37) Navarro, J.F., et al. 2004, MNRAS, 349, 1039
- (38) Nipoti, C, Londrillo, P., & Ciotti, L. 2006, MNRAS, 370, 681
- (39) Phillips, A.C., Illingworth, G.D., MacKenty, J.W., & Franx, M. 1996, AJ, 111, 1566
- (40) Prada, F., Klypin, A.A., Simonneau, E., & Betancort Rijo, J., Santiago, P., Gottlöber, S/ & Sanchez-Conde, M.A. 2006, ApJ, 645, 1001
- (41) Prugniel, Ph., & Simien, F. 1997, A&A, 321, 111
- (42) Sansom, A.E., Sullivan, E.O., Forbes, D.A., Proctor, R.N., & Davis, D.S. 2006, MNRAS, 370, 1541
- (43) Schombert, J.M. 1986, ApJS, 60, 603
- (44) Sérsic, J.-L. 1963, Boletin de la Asociacion Argentina de Astronomia, vol.6, p.41
- (45) Sérsic, J.L. 1968, Atlas de galaxias australes
- (46) Stiavelli, M., Miller, B.W., Ferguson, H.C., Mack, J., Whitmore, B.C., & Lotz, J.M. 2001, AJ, 121, 1385
- (47) Tenjes, P., Haud, U., & Einasto, J. 1994, A&A, 286, 753
- (48) Terzić, B., & Graham, A.W. 2005, MNRAS, 362, 197
- (49) Trujillo, I., Erwin, P., Asensio Ramos, A., & Graham A.W. 2004, AJ, 127, 1917
- (50) Worthey, G. 1994, ApJS, 95, 107