Debris Disk Evolution around A Stars
Abstract
We report 24 and/or 70 measurements of 160 A-type main-sequence stars using the Multiband Imaging Photometer for Spitzer (MIPS). Their ages range from 5 to 850 Myr based on estimates from the literature (cluster or moving group associations) or from the H-R diagram and isochrones. The thermal infrared excess is identified by comparing the deviation (3% and 15% at the 1- level at 24 and 70 , respectively) between the measurements and the synthetic Kurucz photospheric predictions. Stars showing excess infrared emission due to strong emission lines or extended nebulosity seen at 24 are excluded from our sample; therefore, the remaining infrared excesses are likely to arise from circumstellar debris disks. At the 3- confidence level, the excess rate at 24 and 70 is 32% and 33% (with an uncertainty of 5%), considerably higher than has been found for old solar analogs and M dwarfs. Our measurements place constraints on the fractional dust luminosities and temperatures in the disks. We find that older stars tend to have lower fractional dust luminosity than younger ones. While the fractional luminosity from the excess infrared emission follows a general 1/ relationship, the values at a given stellar age vary by at least two orders of magnitude. We also find that (1) older stars possess a narrow range of temperature distribution peaking at colder temperatures, and (2) the disk emission at 70 persists longer than that at 24 . Both results suggest that the debris-disk clearing process is more effective in the inner regions.
Subject headings:
circumstellar matter – infrared: stars – planetary systems: formation1. Introduction
From various lines of evidence (e.g., theoretical modeling, the cratering record on the Moon, returned Lunar samples, and isotopic data) it is believed that embryo terrestrial planets in the Solar System formed in 10-30 Myr, evolved through a period of potentially immense collisions, and then underwent a reduced, but still significant collisional period that ended with another violent episode – the Late Heavy Bombardment – at about 700 Myr (Kleine et al., 2002; Chambers, 2004; Gomes et al., 2005; Strom et al., 2005). Thereafter, the system was in a relatively settled state, setting the stage for life to emerge on Earth. We are unsure whether this sequence was typical or exceptional. We are not even sure of the details of the steps because much of the evidence has been obliterated over time. Hard evidence must often be supplemented with relatively poorly tested theory to assemble a complete picture. The obvious solution would be to observe these processes as they are occurring in other planetary systems. However, observing terrestrial planets around nearby stars passing through parallel stages of evolution is virtually impossible. The planets are too dim for detection against the glare of the central stars; they are not sufficiently massive to be detected through gravitational recoil; and relatively few young stars lie close to the Sun.
However, there is a promising alternative approach, to study planetary debris disks. Debris disks arise from collisions of asteroidal (or planetesimal) bodies that lead to cascades of collisions among the resulting debris. Eventually, significant amounts of this material are ground down to dust grains. Because the surface area per unit mass is large for dusty material, when these grains are heated by the central star they can produce a readily detectable level of excess emission in the mid- and far-infrared. The behavior of these infrared excesses can trace the different zones within a planetary system. For grains around an A-type star and large enough to be in pseudo-stable orbits, the mid-IR band (Spitzer 24 , IRAS and ISO 25 passbands) is sensitive to material largely between 5 and 50 AU, while the far-IR band (IRAS and ISO 60 and Spitzer 70 passbands) is sensitive to material between 50 and 200 AU. Detailed studies of the behavior with age of debris disks in these two bands can indicate how the stages deduced for the early evolution of the Solar System are playing out in hundreds of other planetary systems.
Pioneering studies with IRAS and ISO suggest a systematic drop in infrared excess with stellar age (e.g., Habing et al. 2001; Spangler et al. 2001), qualitatively similar to the drop that would be deduced from the settling down of the Solar System. However, because of limitations in the sensitivity and the accuracy of measurements with these two missions, they were unable to show unambiguously how debris disks evolve. Spitzer brings significant advances in both sensitivity and photometric accuracy, increasing our ability to detect low levels of infrared excesses around hundreds of stars. A-type stars provide an ideal laboratory to study the early stages in planetary system evolution, particularly in the zones relevant for evolution of terrestrial planets (Earth-like temperatures occur at about 5 AU from such stars). Their main sequence lifetimes are long enough (800 Myr) to encompass the entire period of interest, they are of high enough luminosity to light up their debris well, they are sufficiently abundant and bright that many can be observed readily, and they are cool enough that they are unlikely to create infrared excesses in the form of ionized gas. Rieke et al. (2005) have already conducted a study of the 24/25 excesses in such stars, based on a combination of IRAS and Multiband Imaging Photometer for Spitzer (MIPS) measurements of stars in the field and MIPS measurements of stars in clusters. At that time, relatively few field stars had been measured well with Spitzer at 70 . In this paper, we report MIPS photometry at 24 and 70 of 160 main-sequence early type stars, enough to give a much better understanding of the evolution of debris systems.
2. Observations and Data Reduction
2.1. Sample Selection
The majority (128) of the stars in this study are from the Spitzer Guaranteed Time Observation (GTO) programs (Astar, Fab4, and Dirty12), where most of them were selected to have known ages based on cluster membership or association with moving groups. An additional 32 stars are included from the Spitzer calibration observations. In total, our sample includes 160 stars ranging in spectral type from B6 to A7, but mostly (85%) from B9 to A7. We have also developed a tool to determine ages from the Hertzsprung-Russell diagram (HRD) (Rieke et al., 2005) for consistency checking and estimating ages for the stars that are not in clusters or moving group associations. Two stars in the calibration programs are too bright to be observed at 24 , while only 9 stars are bright enough at 70 to be observed as calibrators. Hence, a total of 158 MIPS 24 measurements and 137 MIPS 70 measurements are reported here. The AOR keys, stellar properties and estimated ages are listed in Table 1.
Most of the stars in our sample are single stars (according to the literature and/or SIMBAD database); there are only 10 binary/multiple systems. These are either spectroscopic binaries (unresolved in ground-based optical photometry) or wide binaries with separations larger than the MIPS 24 beam (resolved at 24 ). In addition, we also double checked the stars with infrared excesses (identified by the method discussed below) in the 2MASS catalog, and found no nearby objects on the sky that could confuse the MIPS 24 and 70 measurements. Therefore, the false detection of infrared excesses due to binary components or positional coincidence is unlikely.
2.2. Data Reduction and Source Extraction
All data were processed using the MIPS instrument team Data Analysis Tool (Gordon et al., 2005) for basic reduction (dark subtraction, flat fielding/illumination correction). The known transient behaviors associated with the Ge detectors were removed by time filtering the data in the 70 default-scale mode, and by subtracting the off-source chopped background observations for data in the 70 fine-scale mode. The processed data were then combined using the World Coordinate System (WCS) information to produce final mosaics with pixels half the size of the physical pixel scale.
The photometry for each target was extracted using aperture photometry with multiple aperture settings as well as point-spread-function (PSF) fitting at both bands. By averaging the photometry using different methods (including multiple apertures), the estimated error provides a better estimate of the effects of image quality, background noise, and nearby contaminating sources. For aperture photometry at 24 , we first determined the centroid of each target by fitting a 2-D Gaussian core, then computed the averaged integrated flux within a large aperture (a radius of 1494 with sky annulus between 2988 and 4233), and a small aperture (a radius of 623 with sky annulus between 1992 and 2988). Because the PSF at 70 is not well-sampled and the Spitzer pointing is good to within 1″, for aperture photometry at 70 default scale we used the WCS information to place the aperture center and measured total flux for two different aperture settings: a large aperture (a radius of 2955 with sky annulus between 3940 and 6895) and a small aperture (a radius of 1596 with sky annulus between 1803 and 3901). At 70 fine-scale mode, we determined the centroid the same way as for the 24 data, but only used a single aperture (a radius of 16″with sky annulus between 19″and 39″) due to the limited field of view. We determined the aperture correction based on the theoretical STinyTim PSFs (Krist, 2002) that were smoothed to match the observed PSFs. An aperture correction of 1.143 (1.298) for the large aperture and 1.699 (1.972) for the small aperture was applied to the aperture photometry at 24 (70 default-scale), respectively. A value of 1.933 for the 70 fine-scale mode was used for the aperture correction.
We used, StarFinder (Diolaiti et al., 2000) to extract point-source photometry via PSF fitting. The PSF used at 24 was constructed based on isolated calibration stars while at 70 we used the smoothed STinyTim PSFs. For bright targets without other nearby contaminating sources, the results from aperture photometry and PSF fitting agree within 1% at 24 and 2-5% at 70 . Some stars in our sample are located in high cirrus regions; however, the background variation at 70 is generally less than 10% across the whole field (5′ by 2.5′). For the targets that have higher cirrus variations, we made sure that the extracted source position agrees within 1″(a general Spitzer pointing error) between 24 and 70 . The final measured flux and uncertainty were determined by averaging the different photometry methods. Conversion factors of 1.05, 16.5, 61.6 mJy/arcsec2 were used to transfer measured instrumental units to physical units (mJy) for 24 , 70 default-, and fine-scale modes, respectively. The absolute flux calibration errors are less than 5% at 24 and 10% at 70 (Engelbracht et al. 2006, in preparation; Gordon et al. 2006, in preparation). The errors presented here are the intrinsic noise from images, and do not include the calibration errors.
At 24 , the majority of the stars in the sample have high (20) signal-to-noise detections, except those that have contamination from nearby back/foreground sources or nebulosity. For our 70 observations, all stars observed in the GTO Astar program used the default-scale photometry AOT. The integration times for these observations were planned to provide at least 1- detection of the photosphere (including detector and background noises), but due to various circumstances of observations and general overestimations of the Spitzer sensitivity, many of these sources were not detected at 70 . Observations from the other GTO programs (Fab4 and Dirty12) targeted known IRAS debris disk candidates; therefore, the integration time was designed for high signal-to-noise detections. Finally, observations from the calibration program were aimed to detect the predicted photospheres at least at the 3- level.
In all cases, a threshold of 3- was set for source detection. If the signal-to-noise ratio is less than 3, we use the 3- flux as an upper limit. We show in Table 1 the final measurements ( and for 24 and 70 , respectively), uncertainties ( and ) and signal-to-noise ratios (SN24 and SN70) for the entire sample.
2.3. Supplemental IRAS Sample
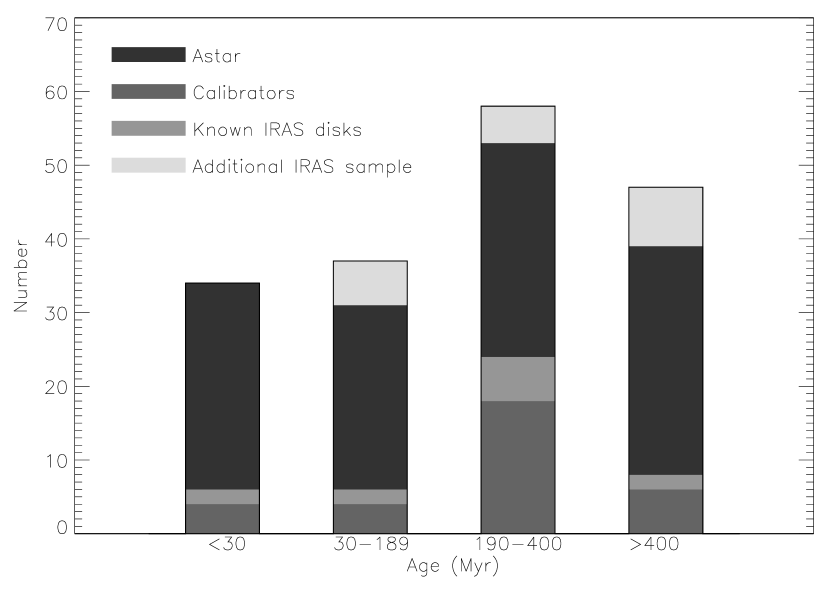
The stars observed with Spitzer were selected on the bases of (1) observability (background brightness and stellar magnitude) and (2) availability of accurate age estimates (membership in cluster or moving groups, etc.). There are a number of stars (47) that are logical members of our sample that have not been observed with Spitzer primarily because of the lack of accurate age estimates. Generally, the Spitzer programs emphasized young stars with ages from membership in moving groups or clusters, while these unobserved stars tend to be relatively old according to ages estimated from their placement on the HRD (Rieke et al., 2005). We added them to this study using IRAS data to avoid any age bias. To do so, we proceeded as follows.
Given the large IRAS beams, we were concerned that noise associated with the background might produce false excesses. The background (IR cirrus) can be estimated either directly from models of the infrared sky (e.g., from the Spitzer Science Center SPOT user tool) or from the atomic hydrogen column, nH (e.g., Chandra Colden: Galactic Neutral Hydrogen Density Calculator111http://cxc.harvard.edu/toolkit/colden.jsp). We used both methods to guard against stars in high cirrus regions; in general they gave consistent results. To determine a threshold for false excesses, we examined the colors of the full sample of stars as a function of the two background estimators. We concluded that stars with n 10 cm-2 and IR background less than 1.3 MJy/sr at 60 are unlikely to suffer from cirrus confusion, and we trimmed the sample of 47 stars to 30 that meet both criteria. We next determined which of these stars have useful IRAS measurements at 60 . We used the Faint Source Catalog (FSC) to obtain a 60 flux density measurement and an error in the measurement for each star. Most of the stars are not detected, but the errors allow setting upper limits to their fluxes. We trimmed the sample to the 19 stars where there are either detected excesses, or we could set 2- upper limits to the excesses at less than 5 times the photospheric flux density (Adopting 2- limits allows meaningful limits in the same range as the Spitzer measurements, with a chance of one or two excesses slightly exceeding the actual limits for those 19 stars). Because the two cuts are based on sky properties, and then on IRAS signal to noise, the remaining stars should be representative of the original sample of twice as many. The properties of these 19 stars are listed in Table 2. The age distribution of the complete sample is shown in Figure 1.
3. Photospheric Prediction and Excess Determination
3.1. Excess Identifications and Statistics
To determine the excess emission from the debris, the stellar contribution has to be subtracted from the measurements. We determined the stellar contribution at each band using the best-fit synthetic Kurucz model (Castelli & Kurucz, 2003) by fitting all available optical to near infrared photometry (Johnson photometry, Strömgen photometry, Hipparcos Tyco photometry, 2MASS photometry) based on a goodness of fit test. For stars within 50 pc of the Sun, no correction for interstellar extinction was applied. For stars with distances larger than 50 pc, we estimated the extinction () based on the color and spectral type, and then applied a reddening correction using the extinction curve from Cardelli et al. (1989). The predicted flux was then computed using the best-fit Kurucz model spectrum at the 24 and 70 weighted average wavelengths (23.68 and 71.42 , respectively).
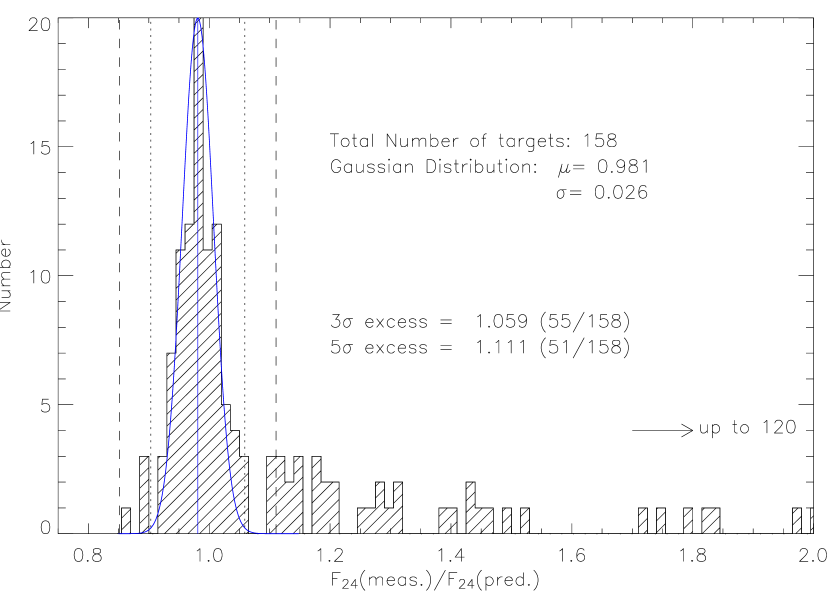
To determine whether a star possesses a significant infrared excess, we first need to evaluate how good our photospheric predictions and measured photometry are. Figure 2 shows a histogram of the 24 fluxes ratioed to the expected photospheric values. A Gaussian distribution with a dispersion of 0.026 is shown for comparison, indicating our predicted photospheres and measured photometry are as good as 2.6% at the 1- level. A few outliers of low flux ratio values are probably due to the effects of latent images (Engelbracht et al. 2006, in preparation). Note that the center of the Gaussian is at 0.981, suggesting a systematic offset of 2%. Based on this we define a 3- excess as a ratio greater than 1.06 or a 5- excess as a ratio greater than 1.11. There are four stars (HD 2266, HD 27045, HD 106591, and HD 74956) that have ratios between 3- and 5-, and three of them have confirmed 70 excesses (see below). Therefore, we adopt the ratio of 1.06 (3- excess) as our threshold to identify infrared excesses at 24 .
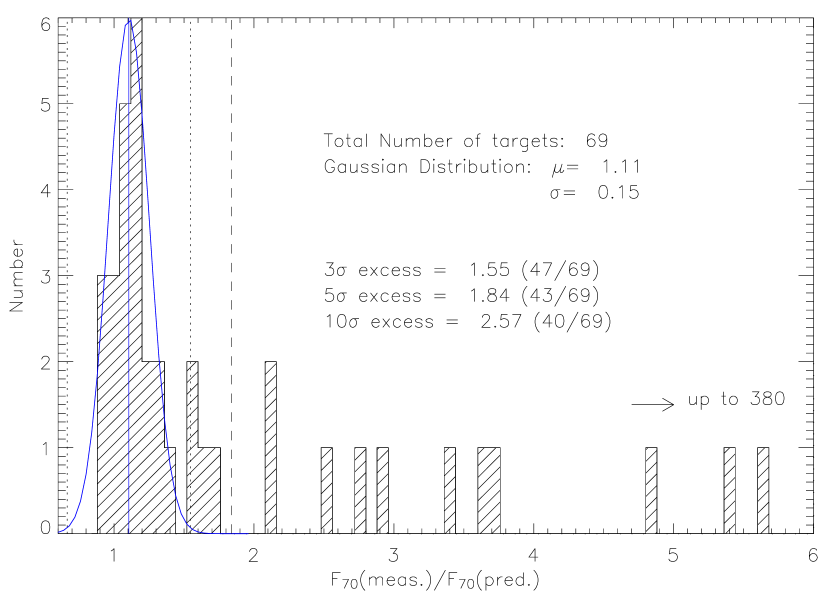
A total of 137 stars have MIPS 70 observations, but only 69 stars have positive detections (signal-to-noise larger than 3). Figure 3 shows a histogram of the 70 fluxes relative to the expected photospheric values. A Gaussian distribution with a dispersion of 0.15 and centered at 1.11 is shown for comparison. The majority of the stars (40 out of 69) show large excesses (10-). We define a 3- excess as a ratio between measured and predicted fluxes greater than 1.55, and a 5- excess as a ratio greater than 1.84 at 70 . Four stars have ratios that fall between 3- and 5- excesses; and three of them (HD 19356, HD 106591, HD 115892) have 24 excess above 3- (the exception is HD 4150). The 3- threshold at 70 is a consistent cutoff with the 3- threshold at 24 because none of the stars (a total of 22) that have ratios less than our 3- threshold at 70 has a 24 excess (more than 3-).
Using these criteria (3- excess as a flux ratio higher than 1.06 at 24 and 1.55 at 70 ), each of the stars is then classified as “YES”, “NO” or “UPL” in Table 1 corresponding to having an infrared excess, being detected but with no excess above the 3- confidence level, or only an upper limit. In addition, we also used the significance () of a detected excess, defined as (measuredpredicted)/uncertainty, for an internal check. At 70 , the excess stars identified by our flux ratio criterion all have 3. At 24 , two stars (HD 93738 and HD 137919) have the excess significance less than 3 while the rest all have 3. Unfortunately, the 70 measurements of these two stars are both upper limits, and cannot verify the infrared excess nature of these two stars. We, therefore, disregard HD 93738 and HD 137919 as having 24 excesses. At the 3- confidence level, the 24 excess rate is 325% out of 155 stars (three stars are not debris disks in nature, see Sec 4.1). If we assumed that all the non-detected stars do not have 70 excesses, then the 70 excess rate is 335% (out of 134). This is a lower limit since in some cases the measured noise is much higher than the predicted photospheric flux. Therefore the excess rate at 70 could be as high as 6710% (out of 66). Among the 44 stars that have excesses at 70 above the 3- confidence level, eight of them show no (less than 3) 24 excess. These eight only-70 excesses are unlikely to be false detections because the significance of the detected excesses are all greater than 4 at 70 (See Table 3, group II).
The fact that the excess rate at 24 and the lower-bound excess rate at 70 are similar indicates that MIPS 24 photometry is a very powerful and reliable tool to study infrared excesses around early-type stars. Combining both 24 and 70 results, the infrared excess detection rate is at least 37% (58 out of 157) around A-type stars. Even using the same criteria (R and R) for identifying excesses for the field (old) FGK stars (124%, Bryden et al. 2006) and M-type stars (0%, Gautier et al. 2006), the excess detection rate around A-type stars (30%, using the same thresholds) is considerably higher.
3.2. Decay Times
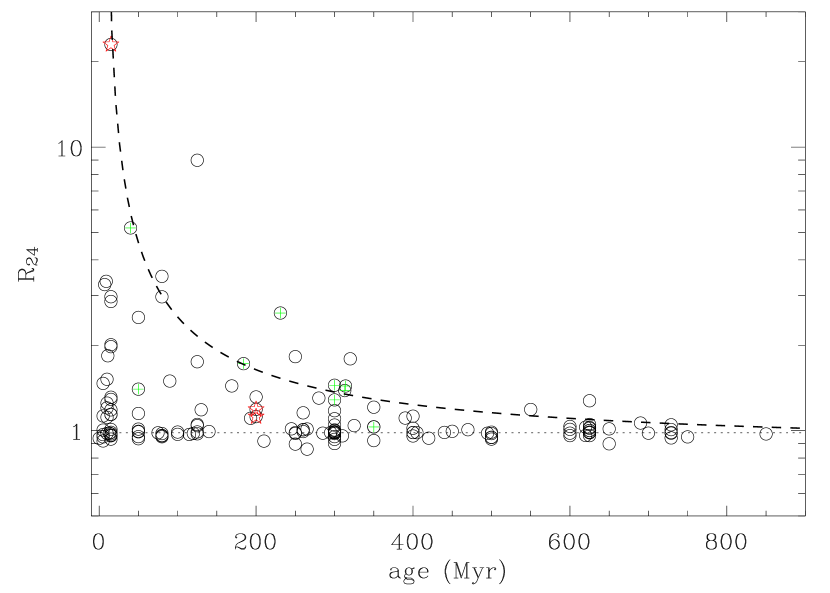
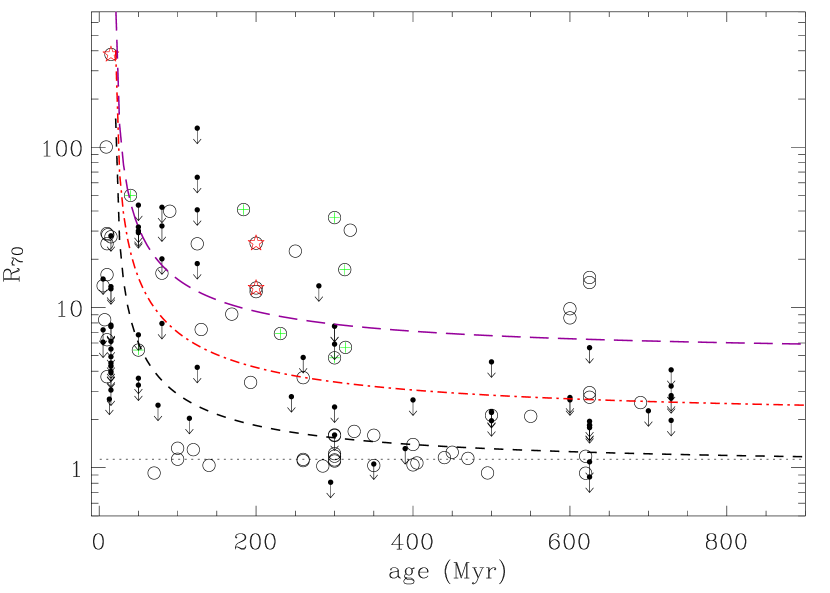
The distributions of 24 and 70 excesses with stellar age are illustrated in Figures 4 and 5. Twelve nearby debris disk stars discovered by IRAS are indicated by star-shaped symbols (for Pic, Vega and Fomalhaut) and plus signs (for HD 14055, HD 18978, HD 38678, HD 74956, HD 95418, HD 102647, HD 139006, HD 161868, HD 181296). As has been found in Rieke et al. (2005), the amount of excess emission at 24 shows a rapid decline with stellar age ( and 150 Myr), and a large variety of excess amounts at any given age. The trend at 70 also shows a large variety at any given age in Figure 5. However, compared to the trend at 24 , the 70 excess trend has a much longer decay time with 400 Myr.
We have carried out a simple analysis to show that the trends for different decay times at 24 and 70 evident in Figures 4 and 5 are statistically significant. We divided the sample into two parts, based on the 24 decay time scale of 150 Myr (Rieke et al., 2005). Given the age uncertainties, we put the division at 400 Myr. For the stars with ages less than this value, we determined that the proportion of stars with excess ratios 1.3 at 24 and 5 at 70 were virtually identical (that is, 28 out of 109 and 26 out of 95, respectively). However, for the stars 400 Myr old or older, there were 0 stars out of 45 with excess ratios 1.3 at 24 , but 4 stars out of 38 with excess ratios 5 at 70 . We used the binomial theorem to show that the probability of these two results coming from the same parent distribution is only about 1%. That is, the 24 excesses decay more rapidly than those at 70 at the 99% confidence level.
4. Dust properties around A Star Debris disks
4.1. Circumstellar Gas Disks
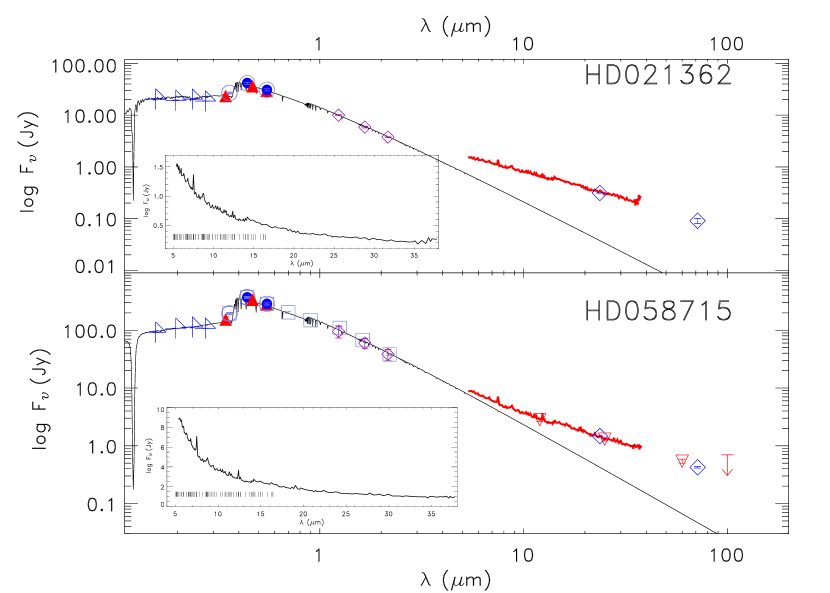
Two stars in our sample, HD 21362 and HD58715, are associated with the Be phenomenon, i.e., where the strong stellar wind from a fast rotating B-type star forms a circumstellar gas disk, showing hydrogen emission lines in the optical and excess radiation relative to the expected photospheric flux in the infrared. The infrared excess emission is due to the free-free radiation from the ionized stellar wind. The nature of these gas disks can be recognized by several hydrogen lines seen in the IRS low resolution spectra (Figure 6). The spectra were observed as part of the GTO follow-up debris disk programs. Details of the observations and data reduction will be discussed in an upcoming paper (Su et al. 2006, in preparation).
These two stars as well as HD 58467 (a Herbig Ae/Be star) are not debris disks in nature, and are disregarded in the following discussion as well as the proceeding discussion on the infrared excess rates.
4.2. [24][70] Color temperature
In the following sections, we discuss the dust properties in terms of the observed [24][70] color temperature and fractional dust luminosity with stellar age. There are 36 stars that have both 24 and 70 excesses, above 3- confidence; hereafter we refer to them as group I. The stars that only show 70 excess (a total of 8), we refer to as group II. Stars that have detections with S/N3 at both 24 and 70 but have no excess above the 3 levels, we refer to as group III (a total of 20). The infrared excess fluxes ( and for 24 and 70 , respectively), significance of the excess fluxes ( and ), and the dust properties for stars from group I to III are listed in Table 3. Stars that have no significant 24 excesses and for which the 70 measurements are upper limits, we refer to as group IV (a total of 55). Group V (a total of 13) are the stars that have significant 24 excesses (above 3- confidence levels) but their 70 measurements are upper limits.

One simple way to characterize the disk properties based on the 24 and 70 excess emission is a blackbody fit to determine the color temperature (T[24]-[70]) of the disk. It is straightforward to determine the color temperature for group I stars by ratioing the flux density at the two bands. Including the uncertainty in the excess fluxes, the color temperature generally has an uncertainty of 5 K for the group I stars. For the stars in group II (excess at 70 but not at 24 ), a color temperature is computed by assuming that the excess flux at 24 is three times the measured uncertainty, which serves as a maximum temperature that the dust can have, consistent with our photometric accuracy. Figure 7 shows the color temperature histogram for the group I and group II stars.
The majority of the debris disks have T90 K, i.e., they are at a distance of 100 AU from the star if we assume that the dust particles in these systems are blackbody-like. The Kuiper belt in these A stars is expected to extend about 1.6 times farther than the Sun’s (45-55 AU) following a simple mass scaling (Su et al., 2005). Hence, most of the debris around these A stars is Kuiper-Belt-like if it consists of large (radius 50 ) blackbody radiators. However, based on the study of the Vega debris disk (Su et al., 2005), non-blackbody-like small grains (radius 10 ) can dominate the disk radiometric properties; therefore, the disk size can extend a few times larger if the dust grains in the system are small.
There are five stars that have [24][70] color temperatures larger than 200 K: HD 19356, HD 23862, HD 38678, HD 75416, and HD 115892. Since both HD 21362 and HD 58715 (gas disks) also have [24][70] color temperatures larger than 200 K, it is possible that these 5 stars are gas disks as well. However, no gas lines were seen in the mid-infrared spectra of HD 19356, HD 38678, and HD 115892 (Chen et al. 2006; Su et al. 2006, in preparation), which leaves only HD 23862 and HD 75416 as possible gas disks.
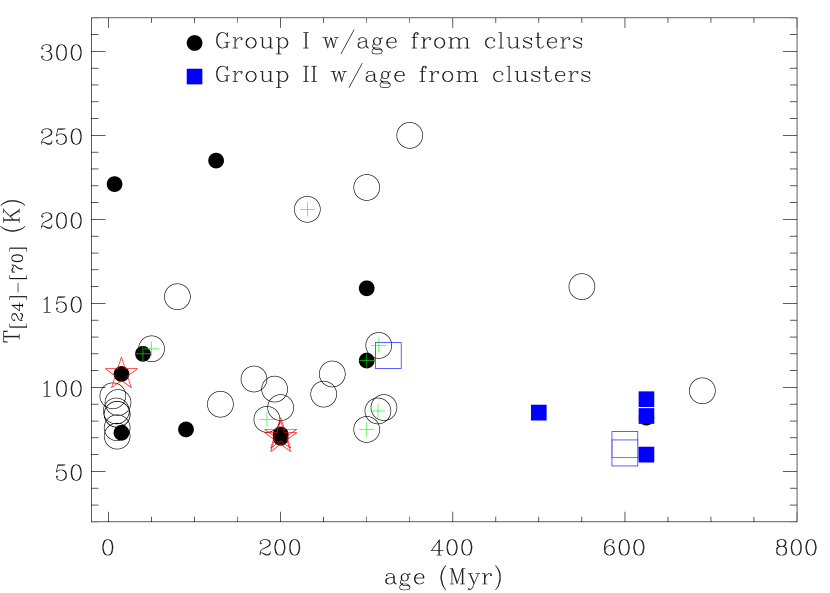
Figure 8 shows the distribution of the observed [24][70] color temperature with stellar age. Slightly smaller, but filled symbols represent the stars with ages determined from cluster associations. The ages determined from clusters or moving group association generally have errors less than 50%, but the ages determined from the HRD could have errors up to a factor of two. It appears that the color temperature of the disks has a slightly broader distribution when stars are younger. For stars older than 400 Myr, most of the color temperatures of the disks appear in a narrow range between 50-150 K. Assuming the dust we see is blackbody-like (i.e., the location of the dust is directly related to dust temperature and stellar properties), the decrease of the [24][70] color suggests that the debris is located further away from the stars in the older systems, consistent with the significant difference in decay time scales between 24 and 70 , found in Sec 3.2.
4.3. Trends in Amounts of Excess Emission
Since the amounts of excess at both 24 and 70 decrease with stellar age (shown in Sec 3.2), it is important to have a large number of stars especially in the old age bin to ensure good statistics. As stated in Sec 2.3, an additional 19 A-type stars with IRAS observations at 25 and 60 were included to avoid an age bias. There are two candidates among these stars to show possible excesses at 25 : HD 56537, with a flux ratio of 1.32, and HD 79469 with a flux ratio of 1.30. Both are in the “marginal” category, since the deviations from unity flux ratio (no excess) are less than 3-. There is only one star with a well-detected excess at 60 , HD 39014 (see, e.g., Jura et al. 2004). HD 142105 has a possible excess at 60 (3.9 ). For all the remaining stars, there are only upper limits at 60 . To analyze all the stars in this sample and in our Spitzer sample, in the following we will discuss 2- upper limits for IRAS measurements at a uniform level of 1.25 at 25 and 5 at 60 .
These values correspond to a color temperature of 90 K, which is typical of most of the debris systems (see Figure 7). We divide stars from the Spitzer sample into those with measured excesses above these limits, or excess or upper limits below them (i.e., R1.25 and R even with the 2- upper limits). Combining the IRAS and Spitzer samples, a total of 174 stars were used at 24/25 , and 153 stars for 60/70 to study the trends in amounts of excess emission.
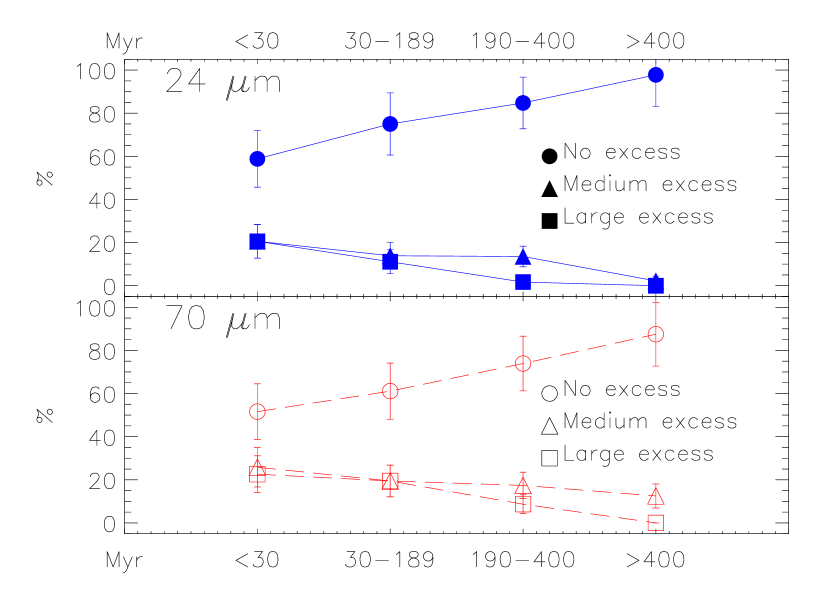
We further group the observations into bins in ages and amount of excess for three subgroups: “no” means no excess; “large” means a flux ratio greater than 2 for 24 and 20 for 70 ; “medium” means the flux ratio is intermediate. The age bins were set so that the total number of stars in each age bin is roughly equal. The results are shown in Table 4 and Figure 9. The 24 excess trend is consistent with the results of Rieke et al. (2005) that 50-60% of the stars that are younger than 30 Myr have no 24 excess, rising to 85-95% for the stars that are older than 190 Myr. The trend of no excess at 70 is similar to 24 within the errors, but with a systematically lower fraction.
The trends of infrared excess (either medium or large) are, again, similar, but the fractions at 70 are systematically higher than at 24 , suggesting that the rate of 70 excesses is higher than at 24 and the persistence time of the 70 excess is longer; i.e., the debris primarily emitting at 70 remains in the system longer.
| Myr | tot# | No | Medium | Large |
|---|---|---|---|---|
| for 24/25 | ||||
| 30 | 34 | 20(58%) | 7(21%) | 7(21%) |
| 30 189 | 36 | 27(75%) | 5(13%) | 4(11%) |
| 190 400 | 59 | 50(85%) | 8(14%) | 1( 2%) |
| 400 | 45 | 44(98%) | 1( 2%) | 0( 0%) |
| for 60/70 | ||||
| 30 | 31 | 16(52%) | 8(25%) | 7(23%) |
| 30 189 | 36 | 22(62%) | 7(19%) | 7(19%) |
| 190 400 | 46 | 34(74%) | 8(17%) | 4( 9%) |
| 400 | 40 | 35(88%) | 5(12%) | 0( 0%) |
References. — Definitions of “No”, “Medium Excess” and “Large Excess” for flux ratio at 24 (R24/25) and 70 (R60/70) are: no – R 1.25; large – R2; median – 1.25R2; no – R 5; large – R20; median – 5R20.
4.4. Fractional Dust Luminosity
The most frequently used quantity to measure the amount of dust in these systems is the fractional luminosity, : the ratio of the total emission by dust to the stellar luminosity (). It measures the fraction of the sky seen from the star that is covered by dust, and therefore the fraction of the stellar radiation that will be absorbed and re-emitted in the infrared (Dominik & Decin, 2003). The fractional luminosity can be determined based on the observed [24][70] color temperature and an assumption of blackbody emission for the dust. However, the fractional luminosity estimated in this way is somewhat over-estimated since the dust grains in the system probably have a emissivity dependence where 1-2, and emit less efficiently at longer wavelengths than blackbody emission. The overestimate could be large, depending on details of the emissivity law. We discuss HD 225200 as an example in Sec 4.5; the fractional luminosity is 8% over-estimated between a blackbody and modified blackbody emission.
Large errors will result if these disks have substantial emission from cold (30 K) dust. In most cases, there are no observations to constrain this possibility very well. However, examining the three best-studied nearby A-type debris disks, Vega, Fomalhaut and Pic, we find the flux ratio between 70 and 850 is 140, 92, and 125, respectively. Given the distinctly different properties of these three disks (age, fractional luminosity, and disk extent), an average flux ratio of 120 between 70 and 850 should be representative for early-type debris disks. This average flux ratio gives a dust temperature of 64 K assuming a =1 emissivity law, and the resultant fractional luminosity is roughly equal to or less than the one computed using the maximum color temperature. Applying similar logic, an upper-limit fractional luminosity is also estimated for each of the stars in group III using a computed color temperature by assuming that the excess flux at each band is three times the measured uncertainty.
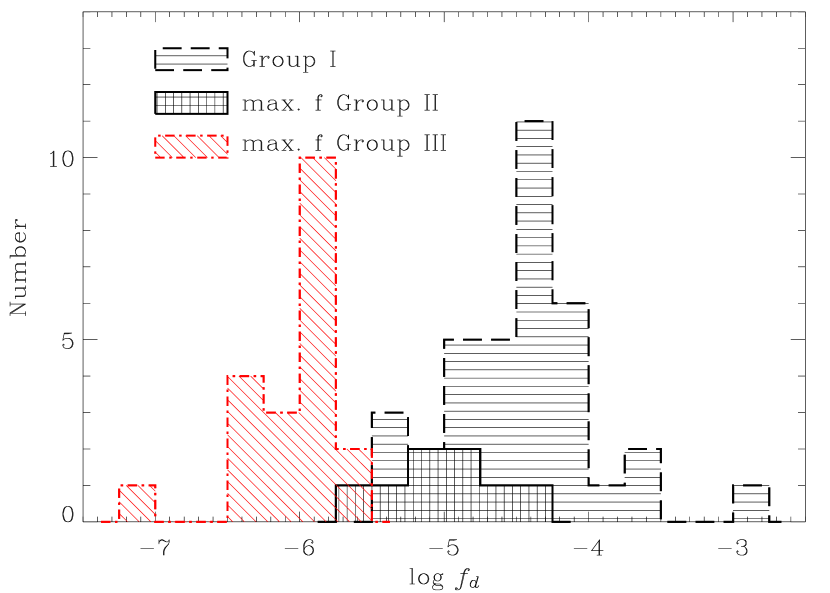
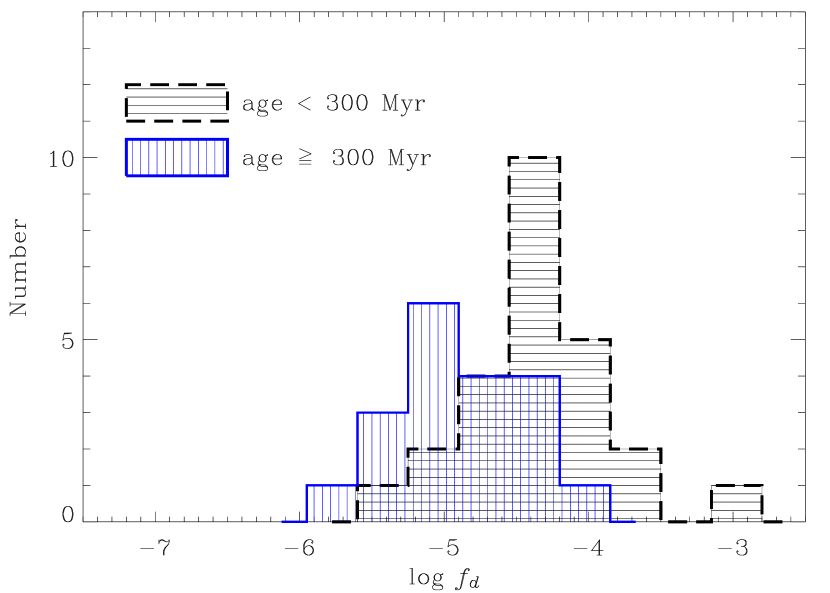
A histogram of fractional luminosity is shown in Figure 10. The majority of the stars have a fractional infrared luminosity . Stars that only show 70 excess (group II) generally have lower fractional infrared luminosity. The maximum fractional luminosities for group III stars are much lower than the group I and II stars, consistent with their non-detectable infrared excess. To see the general trend of the fractional luminosity with age, we divide the group I and II stars into two age bins: older or younger than 300 Myr. This division is roughly at half the main sequence lifetime of an A0 V star (the histogram is not sensitive to this age; it is similar if we make the cut at an age of 400 Myr). The fractional luminosity distribution for these two age groups is shown in Figure 11; older stars tend to have lower fractional luminosity than younger ones, which confirms the results from Sec 3.2 and Figure 9.
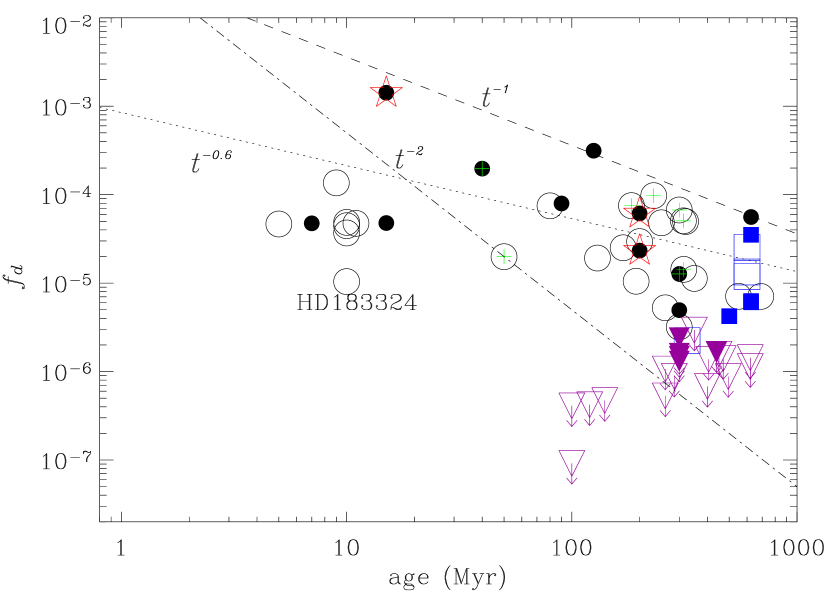
The distribution of the fractional luminosity with stellar age is shown in Figure 12. Several characteristics are found in this vs. age diagram:
-
1.
The data are consistent with a general 1/ relation in the vs. age diagram but with at least two orders of magnitude variation in the amounts of .
-
2.
An upper envelope of 1/ is seen in Figure 12. We do not detect any stars that are older than 100 Myr and have values greater than 10-3 in this early-type sample.
-
3.
All the only-70 excess stars (group II, squares in Figure 12) are old. No stars that are younger than 100 Myr have only-70 excess. This trend could result from sample selection bias, because most of the young stars are at larger distances, and only 70 upper limits were obtained. Among the 53 group IV stars (no 24 excess and 70 is an upper limit), 6 are younger than 100 Myr, have 3- upper limit ratios larger than 5, and most importantly their backgrounds are clean based on the 24 images. These 6 stars are potential only-70 excess young stars. Future deeper 70 observations can help to better identify their natures.
-
4.
Stars that have no detectable excess (group III, upside down triangles with downward arrows in Figure 12) have as low as 10-7 (similar to the value in our Solar System).
A constant upper envelope of 10-3 is suggested by Decin et al. (2003) based on a re-analysis of the data obtained with ISOPHOT and revised age estimates. This upper constant cutoff is not seen in these new Spitzer observations (item 2). Although Decin et al. combine all the available spectral types on the same plot, it is possible that the maximum fractional luminosity is different for different spectral types.
Dominik & Decin (2003) suggest that the total disk mass in a system and the location and sizes of the parent bodies are the three major parameters in determining the place in the vs. age diagram. They conclude that a 1/ relation indicates the dust removal process is dominated by collisions, and that Pointing-Robertson (P-R) drag would yield a 1/ relation. Collisions which result in small grains that are blown out of the system via radiation pressure are the dominant mechanism in removing dust in the bright debris disk systems observed by IRAS and ISO. This is true for these early-type stars since blowout occurs for grains 10 ; however, radiation pressure from lower luminosity stars (late K and M dwarfs) may not be adequate to remove grains at all, and stellar wind drag is the dominant mechanism to remove grains in the young late K to M dwarfs (Plavchan et al., 2005) . Hence, for the A - G systems, P-R drag only plays an important role when the density of the debris is as low as in our solar system (Dominik & Decin, 2003; Wyatt, 2005). Therefore, most (if not all) of the stars in the vs. age diagram should follow a 1/ trend. This is consistent with what we see in these new Spitzer data.
Assuming that the group IV stars have no 70 excess as well, the true lower envelope in the vs. age diagram is then very low. The total surface area occupied by dust may be greatly enhanced by collisions, and then follow a 1/ steady state collisional cascade. If the only-70 excesses are, indeed, only found associated with older stars, it means that the clearing process (collisions) is an inside-out process. The collision frequency is higher closer to the stars because of larger relative velocities; therefore, the dust will be ground down to finer debris (subject to radiation blowout) faster. This is consistent with what Wyatt (2005) has suggested.
Alternatively, the “clearing” of the inner region could also arise from the decline of inward grain transport, rather than the removal of the initial inner disk grain population. A secular decline in the collision rate in the outer disk might account for a drop in inward grain transport, and thus a drop in 24 emission with time. A crucial question for this model is whether the particles generated at the 70 emission zone (50-200 AU for A stars) have enough time to drift inward before they get destroyed by collisions. Assuming an A-type star of 2.5 M☉ and 60 L☉ with a debris disk of , the P-R lifetime ( yr) is roughly 100 times the collisional lifetime ( yr) for grains with radii 100 and density of 2.5 g/cm3 at distances of 50-200 AU from the star. Therefore, the population of the particles that drift inward from the 70 zone to the 24 emission zone is likely to be small. Furthermore, we do not expect the color temperature to evolve with time if the 24 emission comes from material that is spiraling in from the colder, outer disk via P-R drag. The amount of the dust we see in these systems suggests the dominant particle removal mechanism is through collisions. P-R drag may only be important for older systems because it does not explain the dust temperature trend seen in the systems from 5 to 850 Myr of age.
4.5. Debris disk Model: Vega-like grains or KBO-like grains
As has been thoroughly discussed in the literature, debris disk modeling based on the broadband SED alone is degenerate, and hence not conclusive in constraining the debris distribution or dust properties. Based on the resolved disk surface brightness profiles (100-800 AU), Su et al. (2005) have shown that the majority of the dust particles in the disk are small grains in the proto-type Vega debris disk. In comparison, the Vega SED has been modeled using large 30-200 grains in a ring-like (80-120 AU) disk (Dent et al., 2000). Resolving the disk extent is important. Unfortunately most of the debris disks we discuss here are not resolved with Spitzer’s beams. Without further constraints, there are many degeneracies using two data points (24 and 70 ) to constrain a (at least) 6-parameter disk model (surface density power-law index , grain size power-law index , grain size limits ( to ), disk extent ( to )).
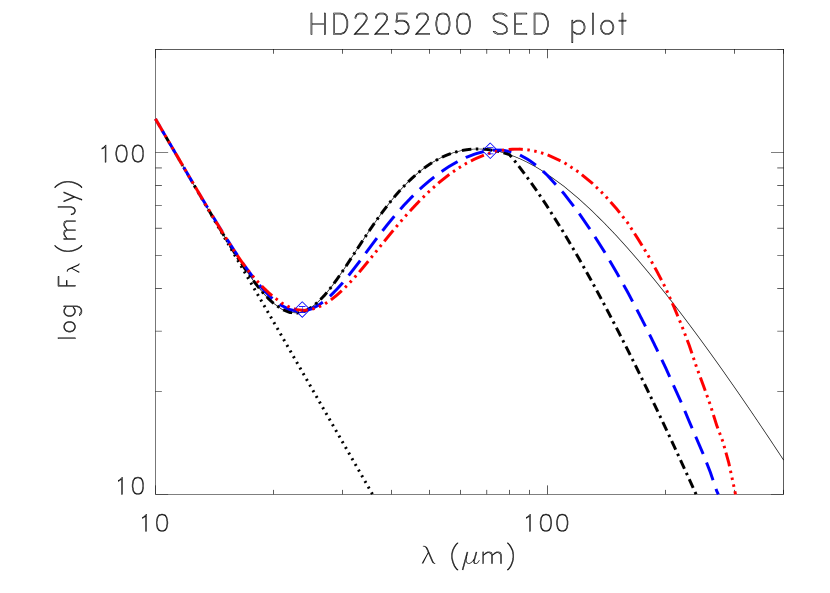
As an illustration, we fit the observed SED of HD 225200 with two different pre-determined models: Vega-like or KBO-like, using astronomical silicate grains. In the Vega-like model, we restrict the grains to be “small” (i.e., , 50 , ), and to be driven outward by radiation pressure, therefore, . In the KBO-like model, we restrict the grains to be “large” (i.e., , 100 , ), and to spiral inward due to the P-R drag, therefore, . The remaining two parameters to fit are and .
We searched large regions of parameter space, computing a statistic at each point. At 90% confidence, we find that AU, AU with dust mass of for the KBO-like model, and AU, AU with dust mass of for the Vega-like model. Figure 13 shows the resultant SEDs. The outer radius in the Vega-like model (900 AU, 7″ given a distance of 129 pc) is theoretically resolvable with MIPS at 24 . The fact that our shallow 24 observation indicates HD 225200 to be an unresolved point source indicates either that deeper imaging might be required to detect the disk outer boundary, or that Vega-like grains are not likely present in the system. Furthermore, the two models yield different amounts of emission at wavelengths greater than 100 . Without resolved images, data points at far-infrared and sub-millimeter wavelegnths can provide further constraints on the disk outer boundary. Follow-up IRS observations of these A-type debris disks can also put additional constraints on the disk model (inner radius and grain sizes), and will be addressed in another paper.
5. Summary and Conclusion
About 160 A-type main-sequence stars with ages ranging from 5 to 850 Myr were measured at 24 and/or 70 using the Multiband Imaging Photometer for Spitzer. With Spitzer’s unprecedented sensitivity, we are able to identify infrared excesses of 6% at 24 and 55% at 70 above the photospheres at the 3- levels. At this 3- confidence level, the infrared excess rate is 325% and 335% for 24 and 70 , respectively. The excess detection rate around these early-type stars is significantly higher than the one found in the old FGK (Bryden et al., 2006) and M-type stars (Gautier et al., 2006). However, recent studies by Gorlova et al. (2006) and Siegler et al. (2006) show that the excess rate for young FGK stars is also higher than for old FGK stars; most importantly, the evolution in the trend of excess rate vs. age looks similar between A stars and FGK stars (only the absolute fraction is different) in their studies. It is difficult to determine whether there is an intrinsic difference in the infrared excess rates between A-type and FGK stars because equivalent levels of fractional luminosity become increasingly hard to detect as the star becomes cooler. The incidence of debris disks is actually the convolution of how many stars actually possess debris disks with given properties, and how detectable the disks are with Spitzer, and this convolution is a strong function of spectral type. Thus debris-disk excess emission is not a steep function of stellar type. Since the detectability of a given level of fractional excess decreases with decreasing stellar temperature, the incidence of excesses is consistent with a similar debris disk driven fractional excesses between A and K stars. Nevertheless, it appears that age is the most important factor in determining the detectability of infrared excess among A- to K-type main-sequence stars, not stellar mass.
The amount of excess emission decreases with stellar age and follows a simple relationship in general with 150 Myr for excesses at 24 but 400 Myr at 70 ; that is, 24 excesses decay more rapidly than those at 70 . In addition, at any given age there exists a large variety in the amount of 24 and 70 excess emission. The observed [24][70] color temperatures for a total of 44 debris disks with 24 and/or 70 excesses range from 60 to 250 K, but the majority of the disks have a typical temperature of 90 K. Furthermore, older stars (age 300 Myr) tend to have colder observed [24][70] color temperatures than young ones. Assuming the dust we detect is blackbody-like, the decline of the [24][70] color implies the debris is located further away from the stars in the older systems.
The fractional luminosity for these 44 early-type debris disks ranges from 10-3 to 10-6. The trend between the fractional luminosity and stellar age follows a general 1/ relationship; older stars tend to have lower fractional luminosity than younger ones. An upper envelope of 1/ is seen in the fractional luminosity vs. age diagram, suggesting that collisions followed by radiation pressure blowing out small grains are the dominant process to remove grains in these systems. The decreases of observed [24][70] color temperatures and the fractional luminosity suggest that the debris disk clearing is an inside-out process.
References
- Barrado y Navascues (1998) Barrado y Navascues, D. 1998, A&A, 339, 831
- Bonatto et al. (2004) Bonatto, C., Bica, E., & Girardi, L. 2004, A&A, 415, 571
- Bryden et al. (2006) Bryden, G., et al. 2006, ApJ, 636, 1098
- Cardelli et al. (1989) Cardelli, J. A., Clayton, G. C., & Mathis, J. S. 1989, ApJ, 345, 245
- Castelli & Kurucz (2003) Castelli, F., & Kurucz, R. L. 2003, IAU Symposium, 210, 20P
- Chambers (2004) Chambers, J. E. 2004, Earth and Planetary Science Letters, 223, 241
- Chen et al. (2006) Chen, C. H., et al. 2006, ArXiv Astrophysics e-prints, arXiv:astro-ph/0605277 (ApJS, in press.)
- Corbally (1984) Corbally, C. J. 1984, ApJ, 285, 195
- Corbally & Gray (1996) Corbally, C. J., & Gray, R. O. 1996, AJ, 112, 2286
- Decin et al. (2003) Decin, G., Dominik, C., Waters, L. B. F. M., & Waelkens, C. 2003, ApJ, 598, 636
- Dent et al. (2000) Dent, W. R. F., Walker, H. J., Holland, W. S., & Greaves, J. S. 2000, MNRAS, 314, 702
- de Zeeuw et al. (1999) de Zeeuw, P. T., Hoogerwerf, R., de Bruijne, J. H. J., Brown, A. G. A., & Blaauw, A. 1999, AJ, 117, 354
- Diolaiti et al. (2000) Diolaiti, E., Bendinelli, O., Bonaccini, D., Close, L., Currie, D., & Parmeggiani, G. 2000, A&AS, 147, 335
- Dominik & Decin (2003) Dominik, C., & Decin, G. 2003, ApJ, 598, 626
- Eggen (1983) Eggen, O. J. 1983, AJ, 88, 642
- Gautier et al. (2006) Gautier, T. N. III, Rieke, G. H. Stansberry, J. A., Bryden, G. C., Stapelfeldt, K. R., Werner, M. W., Beichman, C. A., Chen, C. H., Su, K. Y. L., Trilling, D., Patten, B., & Roellig, T. 2006, submitted.
- Gerbaldi et al. (1999) Gerbaldi, M., Faraggiana, R., Burnage, R., Delmas, F., Gómez, A. E., & Grenier, S. 1999, A&AS, 137, 273
- Gomes et al. (2005) Gomes, R., Levison, H. F., Tsiganis, K., & Morbidelli, A. 2005, Nature, 435, 466
- Gordon et al. (2005) Gordon, K. D., et al. 2005, PASP, 117, 503
- Gorlova et al. (2006) Gorlova, N., et al. 2006, ApJ, in press.
- Habing et al. (2001) Habing, H. J., et al. 2001, A&A, 365, 545
- Iliev & Barzova (1995) Iliev, I. K., & Barzova, I. S. 1995, A&A, 302, 735
- Jura et al. (2004) Jura, M., et al. 2004, ApJS, 154, 453
- King et al. (2003) King, J. R., Villarreal, A. R., Soderblom, D. R., Gulliver, A. F., & Adelman, S. J. 2003, AJ, 125, 1980
- Kleine et al. (2002) Kleine, T., Münker, C., Mezger, K., & Palme, H. 2002, Nature, 418, 952
- Krist (2002) Krist, J. 2002, TinyTim/SIRTF User’s Guide, version 1.3.
- Lynga & Wramdemark (1984) Lynga, G., & Wramdemark, S. 1984, A&A, 132, 58
- Mamajek et al. (2000) Mamajek, E. E., Lawson, W. A., & Feigelson, E. D. 2000, ApJ, 544, 356
- Odenkirchen et al. (1998) Odenkirchen, M., Soubiran, C., & Colin, J. 1998, New Astronomy, 3, 583
- Panagi & O’dell (1997) Panagi, P. M., & O’dell, M. A. 1997, A&AS, 121, 213
- Paunzen (1997) Paunzen, E. 1997, A&A, 326, L29
- Perryman et al. (1998) Perryman, M. A. C., et al. 1998, A&A, 331, 81
- Plavchan et al. (2005) Plavchan, P., Jura, M., & Lipscy, S. J. 2005, ApJ, 631, 1161
- Randich et al. (2001) Randich, S., Pallavicini, R., Meola, G., Stauffer, J. R., & Balachandran, S. C. 2001, A&A, 372, 862
- Rieke et al. (2004) Rieke, G. H., et al. 2004, ApJS, 154, 25
- Rieke et al. (2005) Rieke, G. H., et al. 2005, ApJ, 620, 1010
- Siegler et al. (2006) Siegeler, N., Muzerolle, J., Young, E. T., Rieke, G. H., Mamajek, E. E., Trilling, D. E., Gorlova, N., & Su, K. Y. L., 2006, submitted.
- Song et al. (2000) Song, I., Caillault, J.-P., Barrado y Navascués, D., Stauffer, J. R., & Randich, S. 2000, ApJ, 533, L41
- Song et al. (2001) Song, I., Caillault, J.-P., Barrado y Navascués, D., & Stauffer, J. R. 2001, ApJ, 546, 352
- Spangler et al. (2001) Spangler, C., Sargent, A. I., Silverstone, M. D., Becklin, E. E., & Zuckerman, B. 2001, ApJ, 555, 932
- Strom et al. (2005) Strom, R. G., Malhotra, R., Ito, T., Yoshida, F., & Kring, D. A. 2005, Science, 309, 1847
- Su et al. (2005) Su, K. Y. L., et al. 2005, ApJ, 628, 487
- Westin (1985) Westin, T. N. G. 1985, A&AS, 60, 99
- Wyatt (2005) Wyatt, M. C. 2005, A&A, 433, 1007
- Zuckerman et al. (2001) Zuckerman, B., Song, I., & Webb, R. A. 2001, ApJ, 559, 388
- Zuckerman & Song (2004) Zuckerman, B., & Song, I. 2004, ARA&A, 42, 685
| Name | AOR Key | SpType | distance | Cluster/ | Age | Age ref. | Fm,24 | SN24 | R24 | IRE24 | Fm,70 | SN70 | R70 | IRE70 | ||
|---|---|---|---|---|---|---|---|---|---|---|---|---|---|---|---|---|
| pc | Moving Group | Myr | mJy | mJy | mJy | mJy | ||||||||||
| HD000319 | 3972864 | A1V | 80.3 | 600 | 3 | 43.69 | 0.78 | 56.01 | 0.979 | NO | 13.6 | 4.53 | 3 | 2.742 | UPL | |
| HD001160 | 10090496 | A0V | 136.6 | 0♭ | 22 | 10.56 | 0.2 | 52.8 | 0.939 | NO | ||||||
| HD002262 | 3692544 | A7V | 23.5 | 690 | 22 | 304.61 | 4.05 | 75.21 | 1.063 | YES | 78.7 | 3.74 | 21.04 | 2.548 | YES | |
| 6036736 | ||||||||||||||||
| 3692544 | ||||||||||||||||
| 6036736 | ||||||||||||||||
| HD002811 | 9940224 | A3V | 205.8 | 750 | 22 | 10.56 | 0.07 | 150.86 | 0.95 | NO | ||||||
| HD004150 | 3973120 | A0IV | 73.7 | 325 | 4 | 139.99 | 2.5 | 56 | 1.041 | NO | 24.73 | 2.23 | 11.09 | 1.685 | YES | |
| HD011413 | 3973376 | A1V | 74.8 | 600 | 3 | 50.73 | 0.91 | 55.75 | 1.034 | NO | 52.32 | 2.15 | 24.33 | 9.817 | YES | |
| HD011636 | 4228096 | A5V | 18.3 | 620 | 5 | 811.52 | 3.28 | 247.41 | 0.961 | NO | 85.76 | 9.38 | 9.14 | 0.924 | NO | |
| HD014055 | 8796416 | A1Vnn | 36.1 | 300 | 6 | 282.66 | 6.63 | 42.63 | 1.445 | YES | 787.83 | 157.57 | 5 | 36.377 | YES | |
| 8796160 | ||||||||||||||||
| HD014228 | 9021952 | B8IV/V | 47.5 | 115 | 5 | 185.6 | 1.66 | 111.81 | 0.969 | NO | 41.23 | 13.74 | 3 | 2.033 | UPL | |
| HD014943 | 9940480 | A5V | 61.3 | 850 | 22 | 47.35 | 0.47 | 100.74 | 0.973 | NO | ||||||
| HD015004 | 3973632 | A0III | 198.0 | 280 | 4 | 31.33 | 0.31 | 101.06 | 1.302 | YES | 35.88 | 11.96 | 3 | 13.64 | UPL | |
| HD015008 | 7345408 | A1.5V | 41.5 | 405 | 5 | 178.77 | 1.44 | 124.15 | 0.983 | NO | 21.13 | 0.44 | 48.02 | 1.07 | NO | |
| HD015646 | 3973888 | A0V | 118.1 | 260 | 4 | 19.59 | 0.2 | 97.95 | 1.008 | NO | 10.25 | 3.42 | 3 | 4.875 | UPL | |
| HD016970 | 3974144 | A3V | 25.1 | Ursa Major | 300 | 7 | 353.27 | 3.06 | 115.45 | 1.046 | NO | 45.29 | 4.75 | 9.53 | 1.223 | NO |
| HD017254 | 11783424 | A2V | 124.1 | 650 | 22 | 29.24 | 0.45 | 64.98 | 0.898 | NO | ||||||
| HD018978 | 8794368 | A4V | 26.4 | 350 | 5 | 240.39 | 2.63 | 91.4 | 1.03 | NO | 26.56 | 8.86 | 3 | 1.054 | UPL | |
| 8794112 | ||||||||||||||||
| HD019356 | 3974656 | B8V | 28.5 | 300 | 8,5 | 1404.88 | 6.84 | 205.39 | 1.175 | YES | 206.23 | 11.79 | 17.49 | 1.586 | YES | |
| HD020315 | 3975168 | B8V | 197.6 | Per | 80 | 8 | 37.46 | 10.66 | 3.51 | 0.951 | NO | 135.93 | 45.31 | 3 | 32.257 | UPL |
| HD020888 | 11783680 | A3V | 58.0 | 300 | 22 | 36.06 | 0.73 | 49.4 | 0.9 | NO | ||||||
| HD021362‡ | 3976192 | B6Vn | 169.8 | Per | 80 | 8 | 313.31 | 3.66 | 85.6 | 8.201 | YES | 90.93 | 5.74 | 15.84 | 22.25 | YES |
| HD021551 | 3976448 | B8V | 266.7 | Per | 80 | 8 | 27.61 | 1.04 | 26.55 | 0.958 | NO | 61.37 | 20.46 | 3 | 20.103 | UPL |
| HD021981 | 8812544 | A1V | 113.5 | 265 | 5 | 39.15 | 0.8 | 48.94 | 0.86 | NO | ||||||
| HD023267 | 3976960 | A0V | 136.4 | Per | 80 | 8 | 35.55 | 0.42 | 84.64 | 2.964 | YES | 55.72 | 18.57 | 3 | 42.209 | UPL |
| HD023642 | 3977984 | A0V | 110.4 | Pleiades | 125 | 8 | 17.3 | 1.68 | 10.3 | 1.041 | NO | 237.24 | 79.08 | 3 | 131.549 | UPL |
| HD023753 | 3978240 | B8V | 103.7 | Pleiades | 125 | 8 | 39.88 | 2.53 | 15.75 | 0.989 | NO | 83.47 | 27.82 | 3 | 18.786 | UPL |
| HD023763 | 3978496 | A1V | 144.9 | Pleiades | 125 | 8 | 18.75 | 1.91 | 9.82 | 1.051 | NO | 128.04 | 42.68 | 3 | 64.946 | UPL |
| HD023862 | 3978752 | B8IVevar | 118.8 | Pleiades | 125 | 8 | 662.14 | 6.4 | 103.46 | 8.986 | YES | 202.43 | 23.37 | 8.66 | 24.965 | YES |
| HD023923 | 3979264 | B8V | 116.6 | Pleiades | 125 | 8 | 46.21 | 0.89 | 51.92 | 1.749 | YES | 118.80 | 39.6 | 3 | 40.679 | UPL |
| HD023964 | 3975936 | A0V | 158.7 | Pleiades | 125 | 8 | 17.15 | 0.25 | 68.6 | 0.974 | NO | 8.00 | 2.67 | 3 | 4.23 | UPL |
| HD025860 | 15421440 | A4.5IV | 132.8 | 400 | 22 | 26.26 | 0.1 | 262.6 | 0.984 | NO | ||||||
| HD026321 | 3979520 | A0V | 175.1 | Per | 80 | 8 | 13.48 | 0.11 | 122.55 | 0.976 | NO | 12.2 | 4.07 | 3 | 7.945 | UPL |
| HD027045 | 3979776 | A3m | 28.7 | 193 | 8,5 | 133.49 | 0.87 | 153.44 | 1.105 | YES | 45.73 | 7.03 | 6.5 | 3.406 | YES | |
| HD027628 | 3980032 | A3m | 45.7 | Hyades | 625 | 9 | 71.59 | 0.61 | 117.36 | 1.001 | NO | 14.60 | 4.87 | 3 | 1.832 | UPL |
| HD027749 | 3980288 | A1m | 47.2 | Hyades | 625 | 9 | 71.68 | 0.58 | 123.59 | 0.982 | NO | 14.39 | 4.8 | 3 | 1.778 | UPL |
| HD027962 | 3980544 | A2IV | 45.4 | Hyades | 625 | 9,5 | 149.06 | 2.75 | 54.2 | 0.96 | NO | 96.41 | 32.14 | 3 | 5.61 | UPL |
| HD028226 | 3980800 | Am | 48.0 | Hyades | 625 | 9 | 72.96 | 1.02 | 71.53 | 1.051 | NO | 107.55 | 10.11 | 10.64 | 14.311 | YES |
| HD028355 | 3981056 | A7V | 49.2 | Hyades | 625 | 9,5 | 137.19 | 1.1 | 124.72 | 1.274 | YES | 178.78 | 5.45 | 32.8 | 15.389 | YES |
| HD028527 | 3981312 | A6IV | 44.4 | Hyades | 625 | 9,5 | 120.07 | 1.52 | 78.99 | 1.019 | NO | 37.36 | 5.94 | 3.83 | 2.94 | YES |
| HD028546 | 3981568 | Am | 44.3 | Hyades | 625 | 9 | 75.31 | 0.46 | 163.72 | 1.026 | NO | 15.38 | 5.13 | 3 | 1.947 | UPL |
| HD029388 | 3981824 | A6V | 45.9 | Hyades | 625 | 9,5 | 183.72 | 1.28 | 143.53 | 0.985 | NO | 21.88 | 7.29 | 3 | 1.087 | UPL |
| HD029488 | 3982080 | A5Vn | 48.8 | Hyades | 625 | 9 | 139.51 | 0.51 | 273.55 | 0.987 | NO | 13.36 | 4.45 | 3 | 0.875 | UPL |
| HD030210 | 3982336 | Am | 81.7 | Hyades | 625 | 9 | 70.33 | 0.73 | 96.34 | 0.986 | NO | 14.19 | 4.72 | 3.01 | 1.85 | UPL |
| HD030422 | 3982592 | A3IV | 57.5 | 10 | 3,5 | 44.67 | 0.64 | 69.8 | 1.202 | YES | 64.52 | 1.01 | 63.88 | 16.024 | YES |
| Name | AOR Key | SpType | distance | Cluster/ | Age | Age ref. | Fm,24 | SN24 | R24 | IRE24 | Fm,70 | SN70 | R70 | IRE70 | ||
|---|---|---|---|---|---|---|---|---|---|---|---|---|---|---|---|---|
| pc | Moving Group | Myr | mJy | mJy | mJy | mJy | ||||||||||
| HD031295 | 3982848 | A0V | 37.0 | 10 | 3,5 | 167.25 | 1.94 | 86.21 | 1.25 | YES | 418.72 | 4.64 | 90.24 | 28.952 | YES | |
| HD033254 | 3983104 | A2m | 53.9 | Hyades | 625 | 9 | 72.62 | 1.39 | 52.24 | 1 | NO | 21.46 | 2.17 | 9.89 | 2.752 | YES |
| HD034868 | 3983360 | A0V | 136.8 | 300 | 4 | 25.9 | 0.3 | 86.33 | 0.983 | NO | 21.68 | 7.23 | 3 | 7.658 | UPL | |
| HD038056 | 3983616 | A0V | 132.5 | 250 | 4,5 | 36.48 | 0.37 | 98.59 | 1.823 | YES | 49.67 | 1.06 | 46.86 | 22.466 | YES | |
| HD038206 | 3983872 | A0V | 69.2 | 9 | 4 | 106.92 | 1.58 | 67.67 | 3.361 | YES | 342.27 | 12.87 | 26.59 | 100.367 | YES | |
| HD038545 | 3984128 | A3Vn | 129.5 | 13 | 4 | 45.89 | 0.72 | 63.74 | 0.979 | NO | 13.6 | 4.53 | 3 | 2.678 | UPL | |
| HD038678 | 8792832 | A2Vann | 21.5 | 231 | 8,5 | 860.2 | 17.2 | 50.01 | 2.598 | YES | 246.62 | 24.66 | 10 | 6.872 | YES | |
| 9798208 | ||||||||||||||||
| HD039060 | 8970240 | A5V | 19.3 | Pic | 12 | 23,1,2 | 7276 | 728 | 9.99 | 23.015 | YES | 12990.4 | 1825.4 | 7.12 | 379.678 | YES |
| 12613632 | ||||||||||||||||
| HD040335 | 9192192 | A0 | 112.7 | 5 | 5 | 18.11 | 0.48 | 37.73 | 0.919 | NO | ||||||
| HD042525 | 13588224 | A0V | 101.8 | 300 | 22 | 33.39 | 0.32 | 104.34 | 0.976 | NO | ||||||
| HD043107 | 13476608 | B8V | 84.9 | 80 | 5 | 56.18 | 1.1 | 51.07 | 0.961 | NO | ||||||
| HD045557 | 3984640 | A0V | 88.0 | 75 | 4 | 35.82 | 0.31 | 115.55 | 0.982 | NO | 9.54 | 3.18 | 3 | 2.454 | UPL | |
| HD046190 | 9662976 | A0V | 79.0 | 5 | 5 | 23.86 | 0.05 | 477.2 | 1.126 | YES | ||||||
| HD047332 | 11892224 | A1IV | 343.6 | 400 | 22 | 16.41 | 0.28 | 58.61 | 1.019 | NO | ||||||
| HD048915 | 9458432 | A0V | 2.6 | 70 | 8,5 | 2535.26 | 17.81 | 142.35 | 0.926 | NO | ||||||
| HD057336 | 13588736 | A0IV | 384.6 | 400 | 10 | 10.05 | 0.18 | 55.83 | 0.957 | NO | ||||||
| HD058142 | 7145472 | A1V | 76.3 | 250 | 22 | 97.27 | 0.76 | 127.99 | 0.896 | NO | ||||||
| HD058647† | 3985152 | B9IV | 277.0 | 1 | Ae/Be | 2163.32 | 10.55 | 205.05 | 118.166 | YES | 267.78 | 3.03 | 88.38 | 131.912 | YES | |
| HD058715‡ | 3985408 | B8Ve | 52.2 | 100 | 22,6 | 1469.42 | 7.75 | 189.6 | 3.413 | YES | 423.04 | 51.02 | 8.29 | 8.91 | YES | |
| HD065517 | 13589248 | A2.5IV | 105.9 | 350 | 22 | 14.76 | 0.22 | 67.09 | 1.031 | NO | ||||||
| HD069863 | 13589504 | A2V | 74.2 | 650 | 5,11 | 81.78 | 3.6 | 22.72 | 1.014 | NO | ||||||
| HD071043 | 3985664 | A0V | 73.1 | 11 | 4 | 58.21 | 1.44 | 40.42 | 1.836 | YES | 97.22 | 29.12 | 3.34 | 28.442 | YES | |
| HD071155 | 3985920 | A0V | 38.3 | 169 | 8,5 | 302.39 | 4.13 | 73.22 | 1.437 | YES | 211.74 | 2.76 | 76.72 | 9.087 | YES | |
| HD073210 | 3986432 | A5V | 196.1 | Praesepe | 729 | 12 | 24.7 | 0.2 | 123.5 | 1.048 | NO | 10.66 | 3.55 | 3 | 4.078 | UPL |
| HD073666 | 3986688 | A1V | 174.8 | Praesepe | 729 | 12 | 16.6 | 0.83 | 20 | 0.979 | NO | 5.26 | 1.75 | 3.01 | 2.818 | UPL |
| HD073731 | 3986944 | A5m | 168.1 | Praesepe | 729 | 12 | 30.05 | 0.51 | 58.92 | 0.942 | NO | 6.78 | 2.26 | 3 | 1.973 | UPL |
| HD073819 | 3987200 | A6Vn | 183.2 | Praesepe | 729 | 12 | 21.03 | 0.19 | 110.68 | 1.008 | NO | 6.13 | 2.04 | 3 | 2.732 | UPL |
| HD073871 | 3987456 | A0III | 160.5 | Praesepe | 729 | 12 | 19.26 | 0.09 | 214 | 0.984 | NO | 6.76 | 2.25 | 3 | 3.231 | UPL |
| HD074956 | 8794880 | A1V | 24.4 | 390 | 8,5 | 1396.18 | 25.37 | 55.03 | 1.107 | YES | 180.08 | 60.03 | 3 | 1.315 | UPL | |
| 8794624 | ||||||||||||||||
| HD075416 | 3987712 | B8V | 96.9 | Cha | 8 | 23,13,14 | 122.44 | 1.29 | 94.91 | 3.273 | YES | 34.5 | 0.93 | 37.1 | 8.381 | YES |
| HD076644 | 4239360 | A7V | 14.6 | 620 | 5 | 629.55 | 4.1 | 153.55 | 1.028 | NO | 78.54 | 2.28 | 34.45 | 1.178 | NO | |
| HD079108 | 3987968 | A0V | 115.2 | 320 | 4 | 44.98 | 1.16 | 38.78 | 1.791 | YES | 84.35 | 2.52 | 33.47 | 30.357 | YES | |
| HD080007 | 10091008 | A2IV | 34.1 | 260 | 5 | 1768.9 | 4.54 | 389.63 | 1.006 | NO | 212.86 | 0.97 | 219.44 | 1.126 | NO | |
| HD080950 | 3988224 | A0V | 80.8 | 80 | 4 | 114.67 | 1.53 | 74.95 | 3.5 | YES | 59.31 | 0.96 | 61.78 | 16.361 | YES | |
| HD082621 | 12398336 | A2V | 81.9 | 285 | 5 | 127.75 | 0.85 | 150.29 | 0.979 | NO | 14.51 | 0.71 | 20.44 | 1.024 | NO | |
| HD083808 | 4231680 | A5V | 41.5 | 400 | 5 | 816.76 | 1.28 | 638.09 | 0.984 | NO | 94.79 | 1.49 | 63.62 | 1.041 | NO | |
| HD087887 | 3988480 | A0III | 88.1 | 295 | 4 | 108.94 | 0.27 | 403.48 | 0.983 | NO | 9.81 | 3.27 | 3 | 0.811 | UPL | |
| HD087901 | 9661440 | B7V | 23.8 | 140 | 5 | 1591.5 | 6.57 | 242.24 | 0.992 | NO | 179.25 | 35.85 | 5 | 1.034 | NO | |
| HD091375 | 9663232 | A1V | 79.4 | 265 | 5 | 102.48 | 2.1 | 48.8 | 1.013 | NO | ||||||
| HD092467 | 3988992 | B9.5V | 141.2 | IC2602 | 50 | 15 | 13.32 | 1.4 | 9.51 | 0.994 | NO | 46.44 | 15.48 | 3 | 31.787 | UPL |
| HD092536 | 3989248 | B8V | 147.1 | IC2602 | 50 | 15 | 46.19 | 0.55 | 83.98 | 2.507 | YES | 60.76 | 20.25 | 3 | 30.078 | UPL |
| Name | AOR Key | SpType | distance | Cluster/ | Age | Age ref. | Fm,24 | SN24 | R24 | IRE24 | Fm,70 | SN70 | R70 | IRE70 | ||
|---|---|---|---|---|---|---|---|---|---|---|---|---|---|---|---|---|
| pc | Moving Group | Myr | mJy | mJy | mJy | mJy | ||||||||||
| HD092715 | 3989504 | B9.5V | 130.7 | IC2602 | 50 | 15 | 12.76 | 0.45 | 28.36 | 1.012 | NO | 40.78 | 13.59 | 3 | 29.305 | UPL |
| HD092783 | 3989760 | B9V | 138.7 | IC2602 | 50 | 15 | 13.39 | 0.37 | 36.19 | 0.99 | NO | 64.45 | 21.48 | 3 | 43.523 | UPL |
| HD092845 | 3990016 | A0V | 185.5 | 300 | 4 | 40.64 | 0.84 | 48.38 | 0.952 | NO | 11.05 | 3.68 | 3 | 2.392 | UPL | |
| HD093540 | 3990272 | B6V | 143.1 | IC2602 | 50 | 15 | 40.04 | 0.6 | 66.73 | 0.952 | NO | 16.35 | 5.45 | 3 | 3.615 | UPL |
| HD093549 | 3990528 | B7IV | 131.6 | IC2602 | 50 | 15 | 44.95 | 1.12 | 40.13 | 0.936 | NO | 17.2 | 5.73 | 3 | 3.277 | UPL |
| HD093738 | 3990784 | B9.5V | 143.9 | IC2602 | 50 | 15 | 23.87 | 1.38 | 17.3 | 1.149 | NO♯ | 15.51 | 5.17 | 3 | 6.748 | UPL |
| HD095418 | 7596800 | A1V | 24.3 | Ursa Major | 300 | 7,8,5 | 1026.6 | 14.14 | 72.6 | 1.283 | YES | 421.13 | 84.23 | 5 | 4.849 | YES |
| 7596288 | ||||||||||||||||
| HD097585 | 3991040 | A0V | 146.2 | 300 | 4 | 50.65 | 2.98 | 17 | 0.931 | NO | 35.55 | 11.85 | 3 | 5.904 | UPL | |
| HD097633 | 3991296 | A2V | 54.5 | 550 | 5 | 395.1 | 2.48 | 159.31 | 1.187 | YES | 75.17 | 1.88 | 39.98 | 2.092 | YES | |
| HD101452 | 15247104 | A2 | 128.2 | 250 | 22 | 13.05 | 0.12 | 108.75 | 0.977 | NO | ||||||
| HD102647 | 4314112 | A3V | 11.1 | 50 | 8,5 | 1599.68 | 14.68 | 108.97 | 1.4 | YES | 676.47 | 45.54 | 14.85 | 5.421 | YES | |
| 4313856 | ||||||||||||||||
| HD103287 | 3991552 | A0V | 25.6 | Ursa Major | 300 | 7,8,5 | 788.49 | 7.37 | 106.99 | 0.987 | NO | 96.06 | 1.73 | 55.53 | 1.118 | NO |
| HD105805 | 3991808 | A4Vn | 94.3 | Coma | 500 | 16 | 38.09 | 0.46 | 82.8 | 0.947 | NO | 8.69 | 2.9 | 3 | 1.963 | UPL |
| HD106591 | 3992064 | A3V | 25.0 | Ursa Major | 300 | 7,5 | 419.18 | 4.13 | 101.5 | 1.101 | YES | 65.45 | 3.79 | 17.27 | 1.601 | YES |
| HD108382 | 3992320 | A4V | 86.5 | Coma | 500 | 16 | 113.99 | 0.99 | 115.14 | 0.987 | NO | 26.87 | 1.23 | 21.85 | 2.122 | YES |
| HD108767 | 3992576 | B9.5V | 26.9 | 260 | 5 | 412.69 | 2.44 | 169.14 | 0.992 | NO | 49.26 | 1.9 | 25.93 | 1.107 | NO | |
| HD108945 | 3992832 | A2pvar | 95.3 | Coma | 500 | 16 | 55.18 | 0.92 | 59.98 | 0.976 | NO | 27.78 | 9.26 | 3 | 4.574 | UPL |
| HD109307 | 3993088 | A4Vm | 106.3 | Coma | 500 | 16 | 26.69 | 0.51 | 52.33 | 0.933 | NO | 6.98 | 2.33 | 3 | 2.235 | UPL |
| HD110304 | 8811008 | A1IV | 40.0 | 400 | 5,11 | 144.58 | 8.6 | 16.81 | 1.396 | NO | ||||||
| HD110411 | 3993344 | A0V | 36.9 | 10 | 3 | 139.88 | 1.21 | 115.6 | 1.517 | YES | 247.95 | 2.22 | 111.69 | 25.002 | YES | |
| HD111786 | 3993600 | A0III | 60.2 | 200 | 3 | 66.01 | 1.1 | 60.01 | 1.314 | YES | 69.86 | 3.65 | 19.14 | 12.55 | YES | |
| HD112185 | 3993856 | A0p | 24.8 | Ursa Major | 300 | 7,5 | 1457.98 | 13.41 | 108.72 | 0.99 | NO | 178.35 | 4.2 | 42.46 | 1.1 | NO |
| HD112413 | 3994112 | A0spe | 33.8 | 350 | 5 | 337.05 | 7.84 | 42.99 | 0.922 | NO | 40.27 | 1.75 | 23.01 | 1.032 | NO | |
| HD115892 | 3994368 | A2V | 18.0 | 350 | 5 | 683.66 | 2.41 | 283.68 | 1.209 | YES | 96.62 | 6.47 | 14.93 | 1.593 | YES | |
| HD116706 | 3994624 | A3IV | 78.0 | Coma | 500 | 16 | 40.88 | 0.65 | 62.89 | 0.945 | NO | 10.25 | 3.42 | 3 | 2.211 | UPL |
| HD116842 | 3714304 | A6Vn | 24.9 | Ursa Major | 300 | 7 | 258.68 | 1.47 | 175.97 | 0.985 | NO | 33.42 | 3.68 | 9.08 | 1.156 | NO |
| HD118878 | 3994880 | A0V | 121.2 | Upper Cen | 15 | 14 | 20.19 | 0.33 | 61.18 | 0.96 | NO | 7.01 | 2.34 | 3 | 3.051 | UPL |
| HD123445 | 3995136 | B9V | 218.8 | UCen | 15 | 14 | 18.96 | 0.54 | 35.11 | 0.963 | NO | 12.91 | 4 | 3.23 | 6.14 | UPL |
| HD125162 | 3995392 | A0p | 29.8 | 313 | 8,5 | 270.8 | 2.32 | 116.72 | 1.384 | YES | 364.67 | 3.88 | 93.99 | 17.225 | YES | |
| HD126135 | 3995648 | B8V | 155.5 | Upper Cen | 15 | 14 | 22.49 | 1.7 | 13.23 | 2.008 | YES | 34.54 | 11.51 | 3 | 27.998 | UPL |
| HD126997 | 3995904 | A0.5V | 144.5 | Upper Cen | 15 | 14 | 19.67 | 0.2 | 98.35 | 0.986 | NO | 8.56 | 2.85 | 3 | 3.988 | UPL |
| HD128207 | 3996160 | B8V | 128.5 | Upper Cen | 15 | 14 | 30.99 | 0.67 | 46.25 | 1.139 | YES | 11.65 | 3.88 | 3 | 3.908 | UPL |
| HD128998 | 15247360 | A1V | 131.4 | 250 | 22 | 32.05 | 0.28 | 114.46 | 0.983 | NO | ||||||
| HD129655 | 15421696 | A2 | 128.5 | 300 | 22 | 16.53 | 0.12 | 137.75 | 0.999 | NO | ||||||
| HD130697 | 3996416 | A2V | 128.2 | Upper Cen | 15 | 14 | 17.49 | 0.44 | 39.75 | 0.933 | NO | 9.09 | 3.03 | 3 | 4.499 | UPL |
| HD130841 | 6037760 | A3IV | 23.7 | 495 | 5 | 785.59 | 3.59 | 218.83 | 0.979 | NO | 81.9 | 3.08 | 26.59 | 0.927 | NO | |
| HD132238 | 3996672 | B8V | 191.9 | Upper Cen | 15 | 14 | 30.6 | 0.91 | 33.63 | 1.977 | YES | 12.81 | 4.27 | 3 | 7.601 | UPL |
| HD133880 | 3996928 | B8IV… | 126.6 | Upper Cen | 15 | 14 | 27.26 | 0.41 | 66.49 | 0.973 | NO | 12.81 | 4.27 | 3 | 4.293 | UPL |
| HD133937 | 3997184 | B7V | 136.2 | Upper Cen | 15 | 14 | 23.09 | 0.23 | 100.39 | 0.959 | NO | 11.25 | 3.75 | 3 | 4.332 | UPL |
| HD135454 | 3997440 | B9V | 137.2 | Upper Cen | 15 | 14 | 17.71 | 0.15 | 118.07 | 1.311 | YES | 8.00 | 2.67 | 3 | 5.502 | UPL |
| HD135742 | 3997696 | B8V | 49.1 | 100 | 8,5 | 501.99 | 1.68 | 298.8 | 0.988 | NO | 71.5 | 8.37 | 8.54 | 1.322 | NO | |
| HD136246 | 3997952 | A1V | 143.5 | Upper Cen | 15 | 14 | 14.93 | 0.22 | 67.86 | 1.288 | YES | 34.35 | 1.41 | 24.36 | 27.614 | YES |
| HD136347 | 3998208 | A0sp | 123.5 | Upper Cen | 15 | 14 | 15.91 | 2.67 | 5.96 | 1.009 | NO | 8.35 | 2.78 | 3 | 4.925 | UPL |
| Name | AOR Key | SpType | distance | Cluster/ | Age | Age ref. | Fm,24 | SN24 | R24 | IRE24 | Fm,70 | SN70 | R70 | IRE70 | ||
|---|---|---|---|---|---|---|---|---|---|---|---|---|---|---|---|---|
| pc | Moving Group | Myr | mJy | mJy | mJy | mJy | ||||||||||
| HD136482 | 3998464 | B8.5V | 124.5 | Upper Cen | 15 | 14 | 42.11 | 0.3 | 140.37 | 2.966 | YES | 20.91 | 6.97 | 3 | 13.485 | UPL |
| HD137015 | 3998720 | A2V | 146.6 | Upper Cen | 15 | 14 | 15.18 | 0.26 | 58.38 | 1.183 | YES | 18.01 | 6 | 3 | 13.068 | UPL |
| HD137919 | 3998976 | B9V | 154.3 | Upper Cen | 15 | 14 | 21.04 | 6.1 | 3.45 | 1.141 | NO♯ | 15.31 | 5.1 | 3 | 7.76 | UPL |
| HD138923 | 3999232 | B8V | 112.5 | Upper Cen | 15 | 14 | 58.05 | 0.37 | 156.89 | 2.854 | YES | 17.21 | 5.74 | 3 | 7.675 | UPL |
| HD139006 | 8793600 | A0V | 22.9 | 314 | 8,5 | 1261.63 | 15.46 | 81.61 | 1.436 | YES | 542.03 | 80.7 | 6.72 | 5.633 | YES | |
| 8793344 | ||||||||||||||||
| HD139160 | 3999488 | B9IV | 184.2 | Upper Sco | 5 | 14 | 20.98 | 0.1 | 209.8 | 0.968 | NO | 35.49 | 11.83 | 3 | 15.048 | UPL |
| HD142703 | 3999744 | A2Ib/II | 52.9 | 300 | 17 | 54.27 | 0.39 | 139.15 | 0.988 | NO | 46.51 | 15.5 | 3 | 7.63 | UPL | |
| HD144661 | 4000256 | B8IV/V | 117.6 | Upper Sco | 5 | 14 | 17.19 | 0.24 | 71.63 | 1.004 | NO | 11.13 | 3.71 | 3 | 6.076 | UPL |
| HD145964 | 4000768 | B9V | 105.8 | Upper Sco | 5 | 14 | 19.01 | 1.6 | 11.88 | 0.95 | NO | 15.72 | 5.24 | 3 | 7.248 | UPL |
| HD158460 | 7970048 | A1V | 104.4 | 260 | 5 | 53.15 | 0.34 | 156.32 | 1.155 | YES | 18.26 | 1.19 | 15.34 | 3.646 | YES | |
| HD158485 | 7969280 | A4V | 109.3 | 420 | 5 | 24 | 0.1 | 240 | 0.94 | NO | ||||||
| HD161868 | 8797184 | A0V | 29.1 | 184 | 8,5 | 413.51 | 18.31 | 22.58 | 1.722 | YES | 1085.19 | 217 | 5 | 40.819 | YES | |
| 8796928 | ||||||||||||||||
| HD163466 | 12872448 | A2 | 196.5 | 310 | 5 | 20.15 | 0.13 | 155 | 0.958 | NO | ||||||
| HD165459 | 9851392 | A2V | 89.3 | 5 | 5 | 25.32 | 0.25 | 101.28 | 1.467 | YES | 25.93 | 1.08 | 24.01 | 13.664 | YES | |
| HD172167 | 9547776 | A0V | 7.8 | Castor | 200 | 1,2 | 8900 | 89 | 100 | 1.12 | YES | 11416.1 | 2283.22 | 5 | 13.236 | YE |
| 9458432 | ||||||||||||||||
| HD172728 | 12872704 | A0V | 130.5 | 210 | 5 | 31.33 | 0.15 | 208.87 | 0.918 | NO | ||||||
| HD181296 | 8935424 | A0Vn | 47.7 | Tucana | 30 | 23,18 | 382.43 | 6.46 | 59.2 | 5.186 | YES | 408.53 | 41.37 | 9.87 | 50.033 | YES |
| 8935168 | ||||||||||||||||
| HD183324 | 4002048 | A0V | 59.0 | 10 | 3 | 50.3 | 1.25 | 40.24 | 1.114 | YES | 30.76 | 4.89 | 6.29 | 6.29 | YES | |
| HD188228 | 3725824 | A0V | 32.5 | 10 | 8,5 | 170.75 | 0.55 | 310.45 | 0.977 | NO | 68.95 | 6.1 | 11.3 | 3.695 | YES | |
| HD193281 | 4002560 | A2III | 218.3 | 600 | 3 | 27.26 | 1.93 | 14.12 | 1.01 | NO | 7.96 | 2.65 | 3 | 2.649 | UPL | |
| HD198160 | 4002816 | A2.5IV/V | 73.2 | 600 | 3 | 62.52 | 0.64 | 97.69 | 0.96 | NO | 62.07 | 5.78 | 10.74 | 8.609 | YES | |
| HD204041 | 4003328 | A1IV | 87.3 | 400 | 3 | 33.54 | 0.37 | 90.65 | 1.124 | YES | 8.78 | 2.93 | 3 | 2.647 | UPL | |
| HD209952 | 7979008 | B7IV | 31.1 | 100 | 5 | 979.38 | 1.78 | 550.21 | 0.97 | NO | 120.77 | 0.71 | 170.1 | 1.129 | NO | |
| 7345152 | ||||||||||||||||
| 9661696 | ||||||||||||||||
| 13642240 | ||||||||||||||||
| HD210049 | 3729920 | A2V | 40.0 | 245 | 5 | 128.47 | 0.38 | 338.08 | 1.014 | NO | 37.84 | 12.61 | 3 | 2.775 | UPL | |
| HD210111 | 4003584 | A2III/IV | 78.7 | 700 | 3 | 36.59 | 1.25 | 29.27 | 0.979 | NO | 9.46 | 3.15 | 3 | 2.264 | UPL | |
| HD210418 | 4003840 | A2V | 29.6 | 450 | 5 | 336.71 | 3.32 | 101.42 | 0.994 | NO | 46.82 | 3.48 | 13.45 | 1.248 | NO | |
| HD213320 | 4004096 | A0IVs | 81.4 | 300 | 4 | 71.85 | 0.85 | 84.53 | 1.005 | NO | 12.24 | 4.08 | 3 | 1.6 | UPL | |
| HD214923 | 4004352 | B8V | 63.9 | 120 | 5 | 241.91 | 2 | 120.96 | 0.977 | NO | 34.62 | 1.51 | 22.93 | 1.295 | NO | |
| HD215789 | 4004608 | A3V | 39.7 | 470 | 5 | 363.17 | 2.37 | 153.24 | 1.007 | NO | 45.67 | 4.43 | 10.31 | 1.143 | NO | |
| HD216956 | 4889088 | A3V | 7.7 | Castor | 200 | 1,2 | 3850 | 190 | 20.26 | 1.188 | YES | 9057.11 | 736.4 | 12.3 | 25.189 | YES |
| 12582400 | ||||||||||||||||
| HD216627 | 4004864 | A3V | 48.9 | Ursa Major | 300 | 7,19 | 420.03 | 2.16 | 194.46 | 0.985 | NO | 54.7 | 7.12 | 7.68 | 1.18 | NO |
| HD221756 | 4004608 | A1III | 71.6 | 130 | 3 | 62.46 | 1.08 | 57.83 | 1.184 | YES | 41.52 | 2.68 | 15.49 | 7.283 | YES | |
| HD225200 | 3972608 | A0V | 129.0 | Blanco 1 | 90 | 20,21 | 34.7 | 0.7 | 49.57 | 1.495 | YES | 101.05 | 2.36 | 42.82 | 39.857 | YES |
References. — 1: Barrado y Navascues (1998); 2: Song et al. (2000); 3: Paunzen (1997); 4: Gerbaldi et al. (1999); 5: Rieke et al. (2005); 6: Westin (1985); 7: King et al. (2003); 8: Song et al. (2001); 9: Perryman et al. (1998); 10: Corbally & Gray (1996); 11: Corbally (1984); 12: Bonatto et al. (2004); 13: Mamajek et al. (2000); 14: de Zeeuw et al. (1999); 15: Randich et al. (2001); 16: Odenkirchen et al. (1998); 17: Iliev & Barzova (1995); 18: Zuckerman et al. (2001); 19: Eggen (1983); 20: Panagi & O’dell (1997); 21: Lynga & Wramdemark (1984); 22: this study; 23: Zuckerman & Song (2004).
Note. — ♭ Age is set to 0 for the young stars that are below the ZAMS on the HRD; † Herbig Ae/Be star; ‡ Be stars; ♯ stars are disregarded having 24 excess due to 3.
| Name | 2MASS | Age | SpType | F25 | R25 | F60 | R60 | upper limit | ||
|---|---|---|---|---|---|---|---|---|---|---|
| mag | Myr | Jy | Jy | |||||||
| HD050241 | 2.62 | 660 | A7IV | 0.891 | 0.993 | 0.230 | 1.48 | 0.31 | 1.54 | 2.10 |
| HD005448 | 3.50 | 600 | A5V | 0.395 | 0.994 | 0.118 | 1.71 | 0.46 | 1.54 | 2.63 |
| HD033904 | 3.61 | 150 | B9IV | 0.355 | 1.032 | 0.127 | 2.13 | 0.43 | 2.65 | 2.98 |
| HD141003 | 3.31 | 300 | A2IV | 0.439 | 0.964 | 0.177 | 2.24 | 0.54 | 2.31 | 3.31 |
| HD027376 | 3.91 | 160 | B9V | 0.247 | 0.947 | 0.103 | 2.27 | 0.52 | 2.44 | 3.32 |
| HD130109 | 3.72 | 300 | A0V | 0.353 | 1.088 | 0.125 | 2.22 | 0.55 | 2.20 | 3.33 |
| HD077327 | 3.42 | 120 | A1Vne | 0.478 | 1.165 | 0.161 | 2.26 | 0.56 | 2.23 | 3.39 |
| HD080081 | 3.51 | 395 | A3V | 0.393 | 1.042 | 0.151 | 2.31 | 0.58 | 2.27 | 3.46 |
| HD056537 | 3.38 | 560 | A3V | 0.586 | 1.320 | 0.177 | 2.30 | 0.60 | 2.17 | 3.49 |
| HD118098 | 3.13 | 510 | A3V | 0.550 | 0.986 | 0.236 | 2.44 | 0.54 | 2.68 | 3.51 |
| HD079469 | 3.93 | 180 | B9.5V | 0.332 | 1.296 | 0.109 | 2.45 | 0.61 | 2.37 | 3.68 |
| HD153808 | 3.79 | 220 | A0V | 0.289 | 0.991 | 0.139 | 2.74 | 0.58 | 3.03 | 3.90 |
| HD088955 | 3.73 | 300 | A2V | 0.356 | 1.154 | 0.148 | 2.76 | 0.77 | 2.28 | 4.31 |
| HD198001 | 3.72 | 240 | A1.5V | 0.318 | 1.023 | 0.155 | 2.87 | 0.78 | 2.41 | 4.42 |
| HD089021 | 3.37 | 410 | A2IV | 0.431 | 0.963 | 0.232 | 2.98 | 0.75 | 2.66 | 4.48 |
| HD142105 | 4.12 | 180 | A3Vn | 0.247 | 1.147 | 0.125 | 3.34 | 0.60 | 3.89 | 4.55 |
| HD129246 | 3.64 | 320 | A3IVn | 0.342 | 1.023 | 0.177 | 3.05 | 0.79 | 2.58 | 4.63 |
| HD140436 | 3.77 | 160 | B9IV+ | 0.237 | 0.793 | 0.171 | 3.30 | 0.73 | 3.17 | 4.75 |
| HD039014 | 3.70 | 540 | A7V | 0.314 | 0.988 | 0.841 | 15.24 | 1.68 | 8.49 | 18.59 |
Note. — Reference for age used can be found in Rieke et al. (2005). is the error on the ratio (R60) between measured flux and predicted flux based on [24] color. is the significant of excess emission at 60 , i.e., (R1)/, while the last column is a 2- upper limit on R60, i.e., R.
| Name | Fire,24 | Fire,70 | T[24]-[70] | |||
|---|---|---|---|---|---|---|
| mJy | mJy | K | ||||
| group I – 24 and 70 excess disks | ||||||
| HD014055 | 87.06 | 13.1 | 766.18 | 4.9 | 75 | 6.71e-05 |
| HD019356 | 209.51 | 30.6 | 76.21 | 6.5 | 219 | 3.19e-06 |
| HD002262 | 18.06 | 4.5 | 47.81 | 12.8 | 98 | 7.07e-06 |
| HD023862 | 588.46 | 91.9 | 194.32 | 8.3 | 235 | 3.14e-04 |
| HD027045 | 12.69 | 14.6 | 32.3 | 4.6 | 99 | 1.05e-05 |
| HD028355 | 29.51 | 26.8 | 167.16 | 30.7 | 82 | 5.59e-05 |
| HD030422 | 7.5 | 11.7 | 60.49 | 59.9 | 76 | 4.86e-05 |
| HD031295 | 33.49 | 17.3 | 404.26 | 87.1 | 71 | 4.46e-05 |
| HD038056 | 16.47 | 44.5 | 47.46 | 44.8 | 96 | 4.81e-05 |
| HD038206 | 75.11 | 47.5 | 338.86 | 26.3 | 86 | 1.36e-04 |
| HD038678 | 529.07 | 30.8 | 210.73 | 8.6 | 206 | 9.75e-05 |
| HD039060 | 6959.86 | 9.6 | 12956.2 | 7.1 | 108 | 1.42e-03 |
| HD071043 | 26.51 | 18.4 | 93.8 | 3.2 | 91 | 4.74e-05 |
| HD071155 | 91.95 | 22.3 | 188.44 | 68.3 | 105 | 2.51e-05 |
| HD075416 | 85.03 | 65.9 | 30.38 | 32.7 | 221 | 4.74e-05 |
| HD079108 | 19.87 | 17.1 | 81.57 | 32.4 | 88 | 4.97e-05 |
| HD080950 | 81.9 | 53.5 | 55.68 | 58.0 | 154 | 7.48e-05 |
| HD095418 | 226.4 | 16.0 | 334.27 | 4.0 | 116 | 1.27e-05 |
| HD097633 | 62.37 | 25.1 | 39.24 | 20.9 | 160 | 7.09e-06 |
| HD102647 | 457.38 | 31.2 | 551.69 | 12.1 | 123 | 1.99e-05 |
| HD106591 | 38.37 | 9.3 | 24.58 | 6.5 | 159 | 4.95e-06 |
| HD110411 | 47.66 | 39.4 | 238.03 | 107.2 | 84 | 3.69e-05 |
| HD111786 | 15.79 | 14.4 | 64.29 | 17.6 | 88 | 2.95e-05 |
| HD115892 | 118.24 | 49.1 | 35.96 | 5.6 | 250 | 1.13e-05 |
| HD125162 | 75.08 | 32.4 | 343.5 | 88.5 | 86 | 5.06e-05 |
| HD136246 | 3.34 | 15.2 | 33.11 | 23.5 | 73 | 4.78e-05 |
| HD139006 | 383.07 | 24.8 | 445.81 | 5.5 | 125 | 1.43e-05 |
| HD158460 | 7.12 | 20.9 | 13.25 | 11.1 | 108 | 5.26e-06 |
| HD161868 | 173.41 | 9.5 | 1058.6 | 4.9 | 81 | 7.52e-05 |
| HD165459 | 8.06 | 32.2 | 24.03 | 22.2 | 95 | 4.66e-05 |
| HD172167 | 955.95 | 10.7 | 10553.6 | 4.6 | 72 | 2.33e-05 |
| HD181296 | 308.69 | 47.8 | 400.36 | 9.7 | 120 | 1.97e-04 |
| HD183324 | 5.13 | 4.1 | 25.87 | 5.3 | 84 | 1.04e-05 |
| HD216956 | 608.31 | 3.2 | 8697.54 | 11.8 | 70 | 6.14e-05 |
| HD221756 | 9.69 | 9.0 | 35.82 | 13.4 | 90 | 1.92e-05 |
| HD225200 | 11.49 | 16.4 | 98.51 | 41.7 | 75 | 7.95e-05 |
| group II – only-70 excess disks | ||||||
| HD004150 | 10.06 | 4.5 | 119 | 2.24e-06 | ||
| HD011413 | 46.99 | 21.9 | 66 | 2.54e-05 | ||
| HD028226 | 100.03 | 9.9 | 60 | 3.51e-05 | ||
| HD028527 | 24.65 | 4.1 | 83 | 6.27e-06 | ||
| HD033254 | 13.66 | 6.3 | 93 | 6.07e-06 | ||
| HD108382 | 14.21 | 11.6 | 85 | 4.23e-06 | ||
| HD188228 | 50.29 | 8.2 | 61 | 1.19e-05 | ||
| HD198160 | 54.86 | 9.5 | 61 | 1.34e-05 | ||
| group III – stellar photospheres | ||||||
| HD015008 | 249 | 1.37e-06 | ||||
| HD016970 | 114 | 1.49e-06 | ||||
| HD076644 | 170 | 1.44e-06 | ||||
| HD080007 | 361 | 1.07e-06 | ||||
| HD082621 | 141 | 8.84e-07 | ||||
| HD083808 | 125 | 6.80e-07 | ||||
| HD087901 | 83 | 4.70e-07 | ||||
| HD103287 | 322 | 2.41e-06 | ||||
| HD108767 | 146 | 5.30e-07 | ||||
| HD112185 | 244 | 1.31e-06 | ||||
| HD112413 | 341 | 2.94e-06 | ||||
| HD116842 | 99 | 1.67e-06 | ||||
| HD130841 | 140 | 8.79e-07 | ||||
| HD135742 | 84 | 4.10e-07 | ||||
| HD209952 | 205 | 9.16e-08 | ||||
| HD210418 | 130 | 1.57e-06 | ||||
| HD214923 | 147 | 4.21e-07 | ||||
| HD215789 | 108 | 1.40e-06 | ||||
| HD216627 | 93 | 1.61e-06 | ||||