The Spitzer Survey of the Small Magellanic Cloud: S3MC Imaging and Photometry in the Mid- and Far-Infrared Wavebands
Abstract
We present the initial results from the Spitzer Survey of the Small Magellanic Cloud (S3MC), which imaged the star-forming body of the Small Magellanic Cloud (SMC) in all seven MIPS and IRAC wavebands. We find that the F8/F24 ratio (an estimate of PAH abundance) has large spatial variations and takes a wide range of values that are unrelated to metallicity but anticorrelated with 24 m brightness and ratio. This suggests that photodestruction is primarily responsible for the low abundance of PAHs observed in star-forming low-metallicity galaxies. We use the S3MC images to compile a photometric catalog of mid- and far-infrared point sources in the SMC. The sources detected at the longest wavelengths fall into four main categories: 1) bright m sources with very faint optical counterparts and very red mid-infrared colors (), which we identify as YSOs. 2) Bright mid-infrared sources with mildly red colors (), identified as carbon stars. 3) Bright mid-infrared sources with neutral colors and bright optical counterparts, corresponding to oxygen-rich evolved stars. And, 4) unreddened early B stars (B3 to O9) with a large 24 m excess. This excess is reminiscent of debris disks, and is detected in only a small fraction of these stars (). The majority of the brightest infrared point sources in the SMC fall into groups one to three. We use this photometric information to produce a catalog of 282 bright YSOs in the SMC with a very low level of contamination ().
Subject headings:
dust — galaxies: dwarf — galaxies: stellar content — infrared: ISM — infrared: stars — Magellanic Clouds1. Introduction
The Small Magellanic Cloud (SMC), one of the closest and most prominent neighbors of the Milky Way, is a southern hemisphere dwarf galaxy of low mass (M M⊙; Stanimirović et al., 2004) and small size (R kpc). The SMC is actively interacting with its companion the Large Magellanic Cloud (LMC, studied by the Spitzer SAGE project; Meixner et al., 2006). Both galaxies are being tidally disrupted by the Milky Way, and also suffer from ram-pressure interactions with the halo of hot gas surrounding the Galaxy (e.g., Gardiner & Noguchi, 1996). The results of this complex dynamical interplay are the dramatic features of the Magellanic Bridge and Magellanic Stream, which dominate the high-velocity H I emission in the Southern sky.
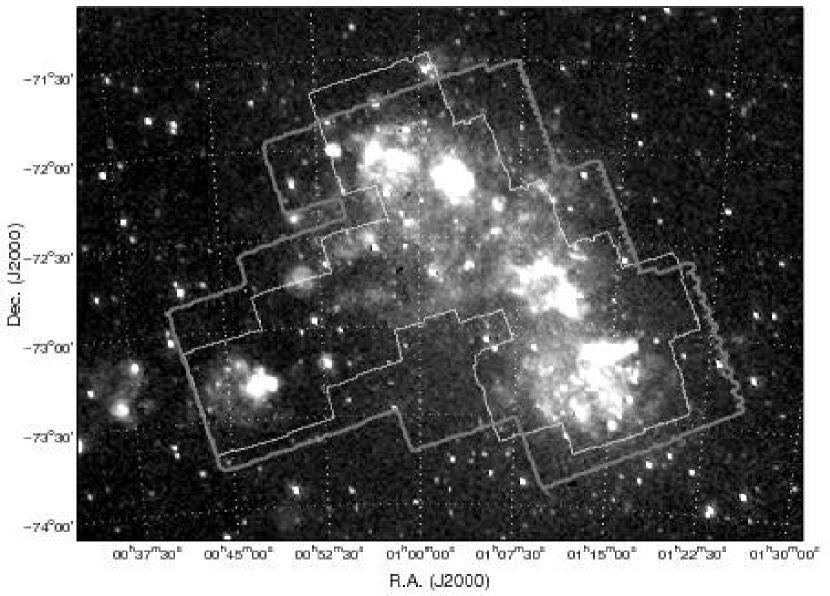
Befitting its nature as a gas-rich late-type dwarf galaxy, the SMC contains a number of sites of active star formation that are apparent in H images, although none are as prominent as the 30 Doradus starburst in the LMC. The brightest SMC star forming complex is the giant H II region N 66 (also known as DEM 103, or NGC 346; Henize, 1956; Davies et al., 1976), which contains approximately O stars (Massey et al., 1989). The star formation activity of the SMC, as well as most of its gas, are concentrated in the feature known as the “Bar” (probably the body of the SMC proper). A second feature, the “Wing”, is an extension roughly perpendicular to the Bar on its eastern side that continues into the H I bridge that joins both Clouds (Figure 1). As one may expect in an interacting system, the three-dimensional structure of the galaxy remains quite unclear. Recent analyses show that the prominent irregular features, which are apparent in the light of young stars, disappear when looking at the old stellar populations (Cioni et al., 2000; Zaritsky et al., 2000; Maragoudaki et al., 2001). These are regularly distributed, and the shape of the SMC appears spheroidal. Observations indicate that the distances to the Bar and the Wing are measurably different, and that the line-of-sight depth of the SMC is not negligible, amounting to 6 to 12 kpc (Crowl et al., 2001, and references therein). The distance to the center of the SMC is approximately 61.1 kpc, corresponding to a distance modulus of mag and a spatial scale of 0.3 pc/″(Hilditch et al., 2005; Keller & Wood, 2006). To put this in context, the spatial resolution of the m data presented here is similar to the 60 m resolution of the Infrared Astronomical Satellite (IRAS) at 2 kpc. The thickness of the SMC introduces a dispersion of mag in the distance modulus for objects located near either edge. The line-of-sight to the SMC is very clear, with a foreground extinction , corresponding to a reddening of (Schlegel et al., 1998).
The proximity of the SMC makes it the lowest metallicity gas-rich galaxy that can be studied in great detail. For observational reasons metallicity, , is commonly quantified using the oxygen abundance relative to hydrogen. The gas-phase oxygen abundances measured in SMC H II regions are (Dufour, 1975; Dufour & Harlow, 1977; Dufour, 1984), only a factor of 4 to 5 higher than those observed in the lowest metallicity galaxies known (I Zw 18 and SBS 0335-052), and a factor of 5 lower than solar metallicity. The same metallicity with very little dispersion is observed in several stellar types in the SMC, including K, F, and A supergiants and Cepheid variables (Russell & Bessell, 1989; Hill, 1997; Luck et al., 1998; Venn, 1999). Its low heavy-element abundance suggests that the SMC may be one of the best local templates for studying the primitive interstellar medium and providing insight into the processes at work in primordial galaxies at high redshift. In particular, the interaction between massive stars, gas, and dust is unusually accessible in this nearby galaxy.
Compared to the Milky Way, the dust properties of the SMC are peculiar. For quite a while it has been recognized that the UV extinction curve in the SMC lacks the 2175 Å“hump” (e.g., Gordon et al., 2003) which is interpreted as signaling the lack of a population of small carbonaceous dust grains (Li & Draine, 2002). Indeed, most current models of dust composition in the SMC rely heavily on silicates to reproduce its extinction curve, with typical silicate to carbon ratios by mass in the range (e.g., Weingartner & Draine, 2001). Whether this dearth of carbonaceous grains is maintained for the large grains remains unclear, as there is a well known anticorrelation between the specific frequency of carbon stars (the main producers of carbonaceous grains) and galactic metallicity (e.g., Blanco et al., 1980), that results in a large abundance of these stars in the SMC.
Other lines of research also suggest a dearth of the smallest dust grains in the low-metallicity interstellar medium of the SMC. The first wide-field infrared maps of the SMC were acquired by IRAS and presented by Schwering & Israel (1989). Sauvage et al. (1990) studied the IRAS colors of the SMC, comparing them to the emission from larger, higher metallicity galaxies, and concluded that there was evidence for a paucity of the small grains that are responsible for the bulk of the extended 12 m emission. More recently, Stanimirović et al. (2000) reprocessed the IRAS data to produce maps with improved angular resolution of 1′ at 12 m, 25 m, and 60 m, and 17 at 100 m. By comparing these data with H I observations of the SMC at similar resolution, they were able to study the large-scale properties of the ISM. Stanimirović et al. used these far-infrared (FIR) observations to measure the dust mass, the dust temperature and its spatial variations, and the dust-to-gas ratio, DGR, across the SMC. This study found a mean dust-to-gas ratio in the SMC that is a factor of times lower than in the Milky Way, providing a different environment for star formation to take place. It also concluded that the dust in the SMC is dominated by large grains, with weaker contributions from polycyclic aromatic hydrocarbons (PAHs, typical sizes 4Å12Å; Désert et al., 1990) and very small grains (VSGs, 12Å150Å) than are found in the Galaxy. One of the limitations of this study is the use of the 60 m IRAS waveband to determine dust temperature. This waveband is expected to have a substantial contribution from stochastically heated small dust grains, out of equilibrium with the radiation field.
Bot et al. (2004) expanded this work by adding Infrared Space Observatory (ISO) 170 m imaging of the SMC to the IRAS data. Using a combination of 100 and 170 m data they measured an appreciably higher dust-to-gas ratio, times lower than Galactic. They also modeled the spectral energy distribution to decompose the emission into the contributions by PAHs, VSGs, and large grains, finding a substantial 60 m excess. Such excess could be caused by an enhanced interstellar radiation field in the SMC, or perhaps by a change in the grain size distribution with respect to the Galaxy, with more VSGs relative to large grains. Bot et al. suggest that grain destruction, perhaps shattering by supernovae shocks, is the driver behind the different properties of the dust in the SMC and the Milky Way.
These studies point to a dust-to-gas ratio in the SMC much lower than Galactic, scaling with its metallicity as DGR , a result similar to that found for a collection of galaxies by Lisenfeld & Ferrara (1998). Note that measurements of the mass-loss rate of the most evolved asymptotic giant branch (AGB) stars in the SMC, however, find a much larger dust-to-gas ratio, scaling as DGR (van Loon, 2006). Because these stars are believed to dominate the ISM dust production, this observation suggests that efficient destruction of dust takes place in the metal-poor star-forming ISM, along the lines of the evidence mentioned in the previous paragraphs.
Detailed modeling of SMC UV absorption and FIR emission data by Weingartner & Draine (2001), Li & Draine (2002), and Clayton et al. (2003) indicate that a deficit of PAHs, as well as the lower abundance of VSGs suggested by IRAS, and perhaps a change in composition with more silicate and fewer graphite grains are required to reproduce the observations. Contursi et al. (2000) studied N 66 using the cameras onboard ISO, and found that the emission from the Aromatic Infrared Band (AIB) in the 6.75 m ISO waveband, commonly attributed to PAHs, was faint compared to the 15 m dust continuum. This was confirmed spectroscopically using ISO’s continuously variable filter (CVF) to obtain low-resolution spectra toward emission peaks, all of which show very weak or nonexistent AIB emission. As a counterpoint, Reach et al. (2000) used the CVF to obtain spectroscopy toward a quiescent molecular cloud in the SMC. They measured AIB-to-continuum ratios similar to those observed in the Milky Way, pointing to similar relative abundances of PAHs. These data suggest that PAHs do form and survive in the SMC and other star-forming low-metallicity galaxies in quantities very similar to Milky Way PAHs, where the environment allows it. Indeed, SMC observations show us that dust properties are environment dependent, and one of the main motivations for a new infrared survey of the SMC is to study and characterize the influence of the local environment on the properties and composition of interstellar dust.
The Spitzer Space Telescope allows dramatic improvements in our ability to study the ISM of the SMC, with previously unattainable images at 3.6 to 8.0 m and a factor of higher angular resolution and typically an order of magnitude better sensitivity at FIR wavelengths than previous missions. The Spitzer data enable us to take a giant step forward in the study of the detailed, distribution of all types of dust grains, including PAHs which primarily emit at wavelengths shorter than 12 m. The high angular resolution of Spitzer means that point sources can be separated from diffuse emission out to 70 m, allowing investigations of large samples of IR point sources (such as carbon stars and young stellar objects) and simultaneously providing a cleaner picture of the ISM. The unprecedented sensitivity and resolution of the Spitzer data makes it possible to determine the abundance and distribution of dust grains and PAHs in relationship to their environment, to test and constrain dust models, and to obtain a complete census of star formation in the SMC, the nearest “primitive” galaxy.
In this paper we present an overview of the Spitzer Survey of the Small Magellanic Cloud (S3MC), discussing the observations, methodology, and some of the initial results on the extended emission and the infrared point sources in the SMC. This is the second in a series of papers presenting the results of the survey (see also Stanimirović et al., 2005). In §2 we describe the observations, in §3 we describe in detail the data reduction process employed to obtain the final S3MC images, in §4 we discuss the point source photometry for the global survey and the comparison with existing datasets, in §5 we analyze the extended dust emission and discuss the different stellar populations detected by Spitzer, and in §6 we summarize our findings.
2. Observations
We obtained Spitzer Space Telescope images of the Small Magellanic Cloud in all the bands of the Infrared Array Camera (IRAC, Fazio et al., 2004) and the Multiband Imaging Photometer and Spectrometer (MIPS, Rieke et al., 2004) as part of the Cycle I General Observer project 3316, “The Small Magellanic Cloud: A Template for the Primitive Interstellar Medium”. This project was designed to map as large an area of the SMC as possible with good sensitivity and within the scope of a small Spitzer proposal (less than 50 hours), with the goal of sampling a diverse set of environments. The images cover an area of approximately 2.8 to 4 deg2 in the various bands, with a region of mapped along the SMC Bar, and along the Wing, and the Astronomical Observing Requests (AORs) were designed to provide contiguous coverage without imposing scheduling constraints (Figure 1).
The MIPS data were acquired in November 2004, using five large AORs each lasting over hr, and two smaller AORs slightly over 1 hour long each. The angular resolution of Spitzer at 24, 70, and 160 m is 6″, 18″, and 40″ respectively. The observations used the MIPS Scan Astronomical Observing Template (AOT), with a medium ( s-1) scan rate as a compromise between coverage and sensitivity. A total of over 11,700 individual images were obtained in each of the three MIPS bands. The 1- sensitivities measured in the MIPS images are approximately 0.045 MJy sr-1 at 24 m, 0.6 MJy sr-1 at 70 m, and 0.7 MJy sr-1 at 160 m. The sensitivity is degraded at 70 m by the pattern noise present in the image. At 160 m it is questionable whether it is possible to find regions of the image that are free of emission in which to measure the noise level, so the sensitivity estimate for this wavelength has a significant uncertainty. Furthermore, to accommodate the observations within the scope of the proposal the oversampling factor (i.e., the number of times a given position in the sky is observed with different parts of the detector) at 160 m was two rather than the recommended four. The corresponding 1- point source sensitivities are 0.043, 5, and 30 mJy respectively.
The IRAC data were obtained during 2005 May using 8 large 4 hour-long and 2 small 2 hour-long AORs with a frame time of 12 seconds and a 3 point cycling dithering pattern. The point response function of IRAC has a FWHM of approximately , , , and in the 3.6, 4.5, 5.8, and 8.0 m bands. The typical oversampling factor of a given position in the sky was . Anticipating a number of bright point sources, the AOTs for the fields along the SMC Bar were obtained using the high dynamic range mode, which takes a short 0.6 second exposure along with each 12 second exposure on the sky. This allows us to recover the correct fluxes for very bright stars that are saturated in the 12 second exposures. The saturation limits for stars in an 0.6 second exposure are 630, 650, 4600, and 2500 mJy in the 3.6, 4.5, 5.8, and 8.0 m bands respectively. Approximately 6,700 individual images were obtained at each band. The 1- sensitivities estimated from the mosaics are 0.008, 0.01, 0.04, and 0.04 MJy sr-1, corresponding to point source sensitivities of 0.7, 1.1, 8, and 6.5 Jy respectively. Table 1 summarizes the survey properties.
| Property | Unit | 3.6 m | 4.5 m | 5.8 m | 8.0 m | 24 m | 70 m | 160 m |
|---|---|---|---|---|---|---|---|---|
| Sensitivity11For extended emission, 1-. | MJy sr-1 | 0.008 | 0.010 | 0.040 | 0.040 | 0.045 | 0.600 | 0.700 |
| Sensitivity22For point sources, 1-. | Jy | 0.7 | 1.1 | 8 | 6.5 | 43 | 5,000 | 30,000 |
| Resolution | arcsec | 1.66 | 1.72 | 1.88 | 1.98 | 6 | 18 | 40 |
| Saturation | mJy | 630 | 650 | 4,600 | 2,500 | 1,000 | 5,750 | 750 |
| Area | deg2 | 2.77 | 2.77 | 2.77 | 2.77 | 3.94 | 3.70 | 3.69 |
| Source Count33Approximate. | 292,000 | 289,000 | 80,000 | 62,000 | 16,000 | 1,800 | … | |
| Completeness Flux44Approximate. See discussion in §4.2. | Jy | 31 | 24 | 80 | 80 | 400 | 40,000 | … |
| Photometric Zero Point55Martin Cohen, priv. comm.. Consistent with Reach et al. (2005). | Jy | 277.1 | 179.4 | 113.9 | 63.1 | 7.253 | 0.8198 | … |
3. Data Reduction
We used the MOPEX data reduction package (version 050905) provided by the Spitzer Science Center (SSC) to combine the individual Basic Calibrated Data (BCD) frames into large mosaics. There are a number of possible methods for processing the data into a final mosaic of the SMC. We chose to begin with the BCD frames, which are derived from a single data collection event (a DCE, or a single frame exposure). The BCD images were generated by the SSC using the standard pipeline (version S11.4). The detailed pipeline processing of raw images from Spitzer to BCD FITS files is fully discussed by Gordon et al. (2005) and Masci et al. (2005). Each BCD image is accompanied by an uncertainty and a mask image, which allow proper weighting of the data and removal of corrupt pixels.
The SSC pipeline provides, in addition to the BCD images, a preliminary mosaic of each AOR referred to as the post-BCD mosaic. We use these images primarily for comparison when we generate the full, much larger mosaic of the SMC.
3.1. MIPS Data Reduction
Inspection of the 24m MIPS BCD and post-BCD images revealed a small number of saturated sources and obvious latent images from bright sources or cosmic ray hits. No attempt was made to explicitly remove cosmic rays from individual BCD images before combining frames together. To avoid including cosmic ray hits in the final mosaics, we used the redundancy and outlier rejection in mosaicking. Only temporal outlier rejection was performed, where redundant fields taken at different times are compared to remove artifacts.
The 70 m data contain several instrumental effects as well as bright extended emission that make point-source extraction difficult. The SSC provides two types of BCD images: normally processed (unfiltered) and those with a time-median filter applied that removes most of the background signal (filtered). Following the recommendation of the SSC, we used the 70 m filtered data to obtain point-source fluxes. However, only the unfiltered data preserve extended emission. In this paper, we present mosaics made from the unfiltered 70 m data. Because of the complexities of dealing with the “first frame” effect, row-droop, and other similar artifacts in the current software pipeline (Gordon et al., 2005), we have not applied any extensive processing to form the 70 m mosaic.
We combined the individual MIPS observations to form a mosaic using the default linear interpolation method. Adjacent, partially overlapping fields were combined using corrections computed by the MOPEX task overlap.pl, which matches fluxes in common regions to guarantee a consistent background level. Because this process is computer intensive, we applied it to subsets of 3,000 images at a time. MOPEX calculates the offsets corresponding to each image by generating a matrix of median values for different DCEs and solving a system of linear equations.
We linearly combined the background-corrected MIPS BCD images, weighting them by the number of coverages at a given position and the associated uncertainty image. The outlier rejection settings employed are described above.
3.2. IRAC Data Reduction
For the IRAC data, we performed a number of pre-processing steps on the individual BCDs before combining them into a complete mosaic. We used the full “dual-outlier” rejection method (see following paragraphs) in order to address bright, solar system objects whose proper motion is easily detectable during our dwell time on the SMC. Following recommendations from the SSC (D. Makovoz, priv. comm.) we used the default linear interpolation method to resample pixels from the BCD images into the new fiducial mosaic image frame in all instances.
Following this correction, we used specialized MOPEX routines to remove two artifacts present in the IRAC images: the so called muxbleed and column-pulldown cosmetic effects caused by the presence of bright sources in individual DCEs. Muxbleed manifests itself as a trail of repeating bright pixels (every fourth pixel) along the readout direction of the chip after detection of an extremely bright star. The effect of column-pulldown is to bring down the counts in an entire column associated with a bright source (Patten et al., 2004). These artifacts are dealt with using the MOPEX script cosmetic.pl. Pixels are masked out of the final image processing if both 1) at least one pixel is found to exceed 50 MJy/sr and 2) if more than 10% of the pixels along the bright pixel row are found to have fluxes outside of the range 2–40 the RMS value for the row. These settings are the default values, found to work best in removing the muxbleed problems.
The next pre-processing step removed the saturated pixels in those fields (along the Bar) for which we obtained high dynamic-range imaging. We compared the short and long exposures for each pixel and identified saturated pixels. Those pixels found to be saturated in the long exposure were then replaced with the corresponding pixel in the short exposure.
An important component of the mosaicking of the IRAC BCDs is outlier rejection. We combined the corrected IRAC BCD images by performing both time-domain (outlier rejection) and the more elaborate spatial-temporal (dual-outlier rejection) filtering processes. We used the recommended (default) settings for the values of the relevant modules in outlier rejection. We linearly interpolated the BCD data onto the final mosaic. The images are combined as a weighted sum, using the associated uncertainty images, to form the final image.
The IRAC images from the 5.8 m waveband (and, to a lesser extent, those at 8.0 m) presented an additional challenge in the form of large-scale additive gradients in the background throughout the mosaic. The gradient is caused by the combination of a time varying offset in the readout amplifier, and the mosaicking algorithm implemented in MOPEX (SSC, priv. comm.). Following the recommendations of the SSC, we made a “super dark” frame using the BCDs within each AOR. Using procedures developed in IDL, we stacked the BCDs for each AOR and computed a pixel-by-pixel median value. We then subtracted the overall median of this super dark from each pixel, so that its DC level was zero. We subtracted the super dark from each BCD, flat fielded the images, and continued with the same mosaicking routines that were used for the 3.6 and 4.5 m wavebands.
3.3. Spitzer Flux Calibration and Color Corrections
The dominant process that affects the IRAC calibration is the location-dependent photometric flat-field corrections for compact sources, caused by geometric array distortions and by the change in the effective filter bandpass as a function of the incidence angles of the radiation (Quijada et al., 2004). This effect can amount to a 10% peak-to-peak calibration error across the array. The ultimate absolute point source calibration attainable by IRAC is (Reach et al., 2005). Because of the dithering and oversampling used to obtain our images, we believe their relative calibration may be closer to this latter limit. The complex backgrounds and the level of confusion in dense stellar regions of the SMC, however, are probably the limiting factors in our photometric accuracy.
The MIPS flux densities have an estimated absolute uncertainty of 10% and 20%, for 24 and 70 m, respectively (Rieke et al., 2004). These uncertainties are dominated by the uncertainty in the fluxes of the calibration sources.
To convert our photometric fluxes to the Vega magnitud system we use the zero points determined by M. Cohen (priv. comm.), which are consistent with Reach et al. (2005). They are listed in Table 1.
The definition of monochromatic flux density used by IRAC, which is common to IRAS and MSX, assumes an underlying flux density . The MIPS flux scale, however, assumes a Rayleigh-Jeans underlying flux density . To convert the MIPS scale into the IRAC scale it is necessary to apply factors of 1.041, 1.089, and 1.043 to the MIPS fluxes measured in the 24, 70, and 160 m wavebands respectively. In the magnitude scale, these color corrections correspond to -0.043, -0.094, and -0.046 mag respectively. Note that throughout this paper we use the flux definitions native to each instrument. Thus these corrections are not applied.
4. Point Source Photometry
Point source photometry was carried out on the mosaic images using the Astronomical Point Source Extractor (APEX) software in the MOPEX package (version 050905) provided by the SSC. Using the routine apex_1frame, we detected bright sources in the images with a default point response function (PRF) generated from in-orbit checkout observations. We selected of the most isolated of these stars, covering a range of brightnesses and positions, and built a new PRF for each band with the prf_response routine. We then fitted the new PRF to the data and calculated flux densities for all sources detected at a signal-to-noise ratio greater than 5 (again with apex_1frame). Aperture correction factors of 1.12, 1.01, 0.91, 0.92, 0.98, and 1.00 were applied to the 3.6, 4.5, 5.8, 8.0, 24, and 70 m PRF fitting photometry respectively, to bring the measured flux densities into agreement with very large aperture measurements of chosen bright stars. Finally, we created a point source-subtracted image with apex_qa to assess the results of the PRF fitting and to examine the extended emission that remained.
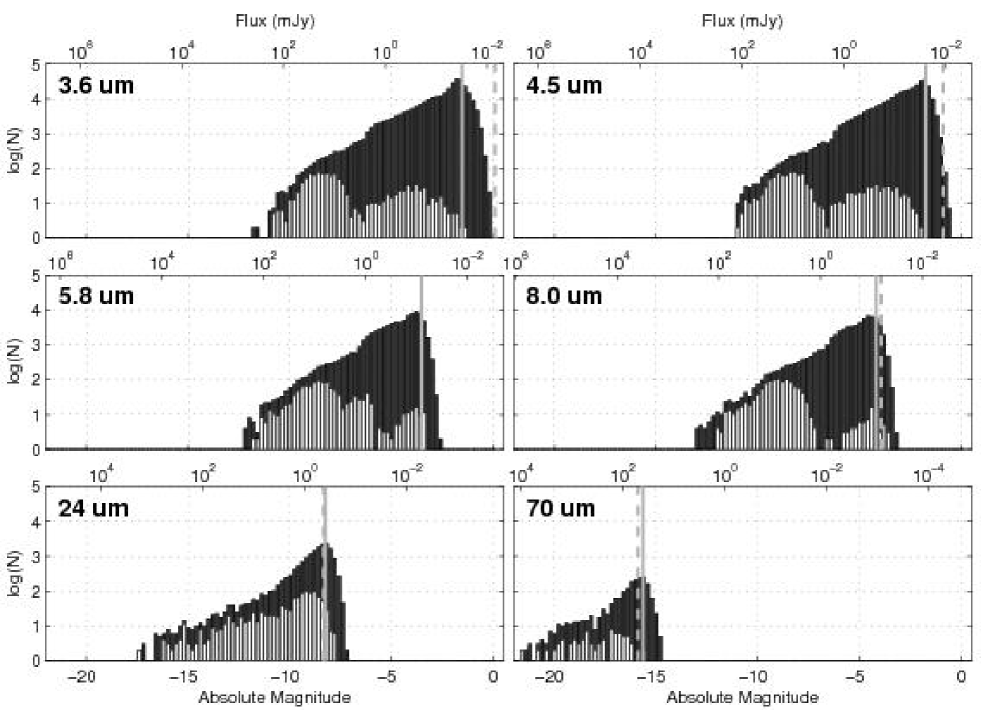
We can use the source count histograms to estimate the fluxes at which incompleteness in the photometry becomes significant. Figure 2 shows the histograms of the counts for a given source flux in each Spitzer waveband. Assuming that the intrinsic source counts approximately follow a power law, we use the peak of the histogram to find the flux below which the photometry is missing a large number of sources. Because of the effects of extended backgrounds and source confusion, the actual level of completeness of the photometry depends on the location in the image (see §4.2). Nevertheless, Figure 2 shows that below 31, 24, 80, 80, 400, and 40000 Jy the point source photometry for the 3.6 through 70 m wavebands is clearly incomplete. These limits are very close to 10 times the 1- noise in the images, except for the 3.6 and 4.5 m wavebands where that criterion would lead us to expect completeness limits of 7 and 11 Jy respectively. The diminished effective “sensitivity” in these wavebands is due to the effects of crowding and confusion, which are most severe at the shortest wavelengths.
As in other Spitzer imaging observations, we have found that the largest source of false stellar detections are the diffraction artifacts associated with bright stars (e.g., Babbedge et al., 2006). Wherever possible we have pruned them from the final catalog, either by hand or by a two-step process in the photometry, where we use a different PSF for bright stars. In the end, however, the catalog suffers from some artifact contamination that is difficult to estimate. These artificial sources are usually clustered near bright stars, and are generally detected in just one waveband.
4.1. Comparison to Previous Infrared Missions
In this section we compare the fluxes of different point sources in existing catalogs with our Spitzer photometry. The SMC was imaged by previous infrared satellites, including IRAS, MSX, and ISO. There are numerous cataloged sources in the SMC, but the lower angular resolution of most previous missions (especially IRAS) can make it difficult to confidently identify them with sources seen in our data or at other wavelengths. Also, the different instrument bandpasses should be considered for a fully meaningful comparison of fluxes. In the following discussion we concentrate on the samples for which source confusion and bandpass issues are minimized.
4.1.1 MIPS Comparison
Using the IRAS images, Groenewegen & Blommaert (1998) located 30 likely AGB stars in the SMC. Approximately one third of these sources are carbon stars, one third are oxygen-rich AGB stars, and the remainder are presumed to be other types of evolved stars. The IRAS 25 m bandpass is fairly similar to the MIPS 24 m bandpass, allowing us to compare the flux densities we observe with Spitzer to the earlier IRAS observations. Nineteen of the stars discussed by Groenewegen & Blommaert (1998) lie within the area covered by our MIPS 24 m map, and 17 have good fluxes in the IRAS and MIPS data.
We find that on average, the IRAS flux densities are 37% higher than the MIPS flux densities (23% higher if we consider the median rather than the mean), and for a few sources the difference is as much as a factor of three. Only two of the flux densities agree within the quoted uncertainties given by Groenewegen & Blommaert (1998). Trams et al. (1999) also found a similar discrepancy in comparing IRAS and ISO photometry for sources fainter than 0.2 Jy. Some of these differences are certainly due to variability (Werner et al., 1980), which in dust-shrouded AGB stars can amount up to a magnitude at mid-infrared (MIR) wavelengths (Le Bertre, 1992, 1993; van Loon et al., 1998). Variability may introduce a systematic offset in the sense of one data set consistently yielding brighter measurements if that data has considerably lower sensitivities and the sources in question are close to the detection limit (in other words, they are only detected by IRAS in their high state). Confusion within the large IRAS beam may also play a role, although sources that are clearly isolated in the Spitzer observations show similar discrepancies between their IRAS and MIPS fluxes, suggesting that confusion is not the main cause of the disagreement.
The MSX Point Source Catalog (Egan et al., 2003) contains 9 very bright ( Jy) 21 m sources in the SMC. Eight of these lie within our survey area, and seven are unsaturated. Two of these split into multiple sources by MOPEX. Comparison of the MSX 21 m flux densities with the MIPS 24 m flux densities for the remaining five sources shows that one of the sources agrees within 1-, and the remaining four are somewhat brighter ( %) in the MIPS data. Overall, the average flux ratio between MSX and MIPS is 0.85, and the median is 0.88. Given the substantial difference between the MIPS and MSX bandpasses, and again allowing for variability, it seems that the calibration of the 24 m Spitzer data is consistent with that of MSX.
4.1.2 IRAC Comparison
At 8 m there are about 120 MSX sources in our field. After matching them to the IRAC catalog and removing the sources that are flagged by MSX as being variable, confused, or low quality, 53 sources remain. These sources are on average brighter in our data than in MSX. This effect is entirely attributable to the fact that the IRAC 8 m bandpass is slightly bluer than that of MSX ( m compared to m). A stellar blackbody in the Rayleigh-Jeans limit (valid for photospheric temperatures K) will be approximately times brighter in the IRAC waveband. Thus, the 8 m IRAC point source calibration is consistent with MSX.
There is also some overlap between the ISO Magellanic Clouds Mini-Survey (Loup et al., in preparation) and the area mapped by our survey. The ISO data were taken in the LW2 band, which is centered at 6.7 m and has a FWHM of 3.5 m. Unfortunately, this bandpass does not match any of the IRAC bands very closely, but the average of IRAC 5.8 m and 8.0 m flux densities should provide a reasonable approximation of the LW2 flux density. We find 114 sources in the ISO catalog that have both 5.8 m and 8.0 m fluxes, have no close neighbors, are not confused, and have an ISO S/N of at least 10. After discarding the 10 reddest sources (), and using the mean of the 5.8 m and 8.0 m bands, we find that the IRAC flux densities are 5% larger than the ISO measurements with a scatter of 33%. Given the uncertainties involved in comparing the different bandpasses, the calibration of our IRAC data appears compatible with that of ISO.
4.2. Photometric Completeness
We used artificial star tests to estimate the completeness of the photometry. We added scaled versions of the measured PRF at random positions in each image and re-ran the MOPEX photometry to see how many of the artificial sources were recovered. Because of the large variations in both the surface density of point sources and the brightness of extended emission regions across the SMC, the completeness is a complex function of both flux and position. In order to determine the approximate size of these effects, we carried out completeness tests in four separate fields that span the range of surface densities found in the data. Field 1 is centered at in the southwest part of the Bar, with extremely high stellar density and significant extended emission. Field 2 is at near the middle of the Bar with a high stellar density. Field 3 is at near the top of the Bar with a moderate stellar density and some extended emission. Finally, Field 4 is well out in the Wing at , in a low density area. Each field is 768 pixels on a side, covering an area of 104.9 arcmin2 in the IRAC bands and 1065.4 arcmin2 in the MIPS 24 m mosaic.
We summarize in Table 2 the results of the artificial star tests. The worst crowding occurs at 3.6 m, and in the highest density regions the photometry is only 90% complete to (110.3 Jy). In the lowest density regions the 90% completeness limit is fainter than . At longer wavelengths, the crowding declines dramatically as the stellar photospheres that comprise a large majority of the detected sources fall off as and the detector sensitivity rapidly decreases. In the MIPS data, incompleteness is largely caused by the presence of bright dust emission rather than point source crowding (as there are no very crowded regions). Thus, the completeness results in the four fields scale as the percentage of the field that is covered by bright extended emission.
| Magnitude | Flux | Field 1 | Field 2 | Field 3 | Field 4 |
|---|---|---|---|---|---|
| (Jy) | (%) | (%) | (%) | (%) | |
| 3.6 m | |||||
| 15 | 277.1 | 97.3 | 99.3 | 99.0 | 99.7 |
| 16 | 110.3 | 90.7 | 91.7 | 96.0 | 98.0 |
| 17 | 43.9 | 79.0 | 83.2 | 91.0 | 95.2 |
| 4.5 m | |||||
| 15 | 179.4 | 96.7 | 96.3 | 99.0 | 100.0 |
| 16 | 71.4 | 91.0 | 92.0 | 97.3 | 99.7 |
| 17 | 28.4 | 72.0 | 79.4 | 91.8 | 95.6 |
| 5.8 m | |||||
| 14 | 286.1 | 98.7 | 99.0 | 98.3 | 99.7 |
| 15 | 113.9 | 94.3 | 94.3 | 97.0 | 99.3 |
| 15.5 | 71.9 | 78.2 | 88.0 | 95.0 | 96.8 |
| 16 | 45.3 | 30.0 | 42.0 | 65.0 | 59.3 |
| 8.0 m | |||||
| 14 | 158.5 | 94.7 | 97.3 | 96.0 | 98.3 |
| 15 | 63.1 | 55.0 | 85.3 | 94.0 | 78.9 |
| 15.5 | 39.8 | 14.8 | 34.0 | 54.2 | 30.4 |
| 16 | 25.1 | 4.8 | 9.4 | 15.2 | 6.9 |
| 24 m | |||||
| 9 | 1821.9 | 88.3 | 98.3 | 91.3 | 95.1 |
| 10 | 725.3 | 78.0 | 92.7 | 86.9 | 93.1 |
| 11 | 288.7 | 8.2 | 21.4 | 18.2 | 23.3 |
4.3. Catalog Compilation
We searched for sources in each waveband using APEX and the procedure outlined in §4. The catalogs for the individual wavebands were then merged using positional tolerances of 1″ for IRAC, and 3″ and 6″ for MIPS at 24 and 70 m respectively. Catalog assembly proceeded from the shortest to the longest wavelength; the closest source within the aforementioned positional tolerances was associated with a pre-existing source, or a new entry was created if no cataloged source existed within the tolerances. We derived the source position in the final merged catalog of all the Spitzer bands using the signal-to-noise weighted average of the detections in the IRAC bands, or adopting the the 24 or 70 m positions (in that order) if no IRAC detections were available.
We proceeded to cross-identify the Spitzer sources with the OGLE II catalog (Udalski et al., 1998) and the SMC catalog of the Magellanic Cloud Photometric Survey (MCPS, Zaritsky et al., 2002) in the optical, and with the 2MASS catalog in the near infrared (Skrutskie et al., 2006). The fluxes reported by OGLE II were preferred to those of the MCPS (see Zaritsky et al., 2002). The positional tolerance used for cross-identification was 1″. The final catalog compiled has over 400,000 point sources, and is available electronically at the project URL111http://celestial.berkeley.edu/spitzer. To produce a uniform catalog we expressed all fluxes in Jy, using the following photometric zero points for BVIJHK: 4060, 3723, 2459, 1594, 1024, 666.8 Jy (Cohen et al., 2003a, b). For the Spitzer wavebands we use the zero points listed in Table 1.
5. Discussion
The S3MC data provide a rich resource for studying many aspects of the interstellar medium (ISM) and star formation activity in the SMC. The 3.6 and 4.5 m wavebands are mostly sensitive to stellar photospheres and very hot circumstellar dust, with some contribution from bound-free transitions, free-free radiation, and Brackett recombination emission in H II regions. Although the 4.5 m waveband is free from AIB contribution, the 3.29 m emission feature (thought to be due to C-H bond stretching in PAHs) contributes to the 3.6 m intensity near molecular clouds. In cool stars the 4.5 m waveband includes the CO fundamental bandhead, which will appear in absorption. Both the 5.8 and 8.0 m wavebands show molecular material in the ISM and circumstellar envelopes, as well as increasingly faint stellar photospheres. They encompass the 6.2 m emission feature and the very bright emission complex at m thought to be dominated by C-C stretching modes (with some contribution from in-plane C-H bending) of the bonds in PAHs and very small carbonaceous dust grains. The 24 m waveband is sensitive to continuum emission from PAHs and VSGs, which are stochastically heated to temperatures of K by the interstellar radiation field (ISRF) or by the central star in warm circumstellar envelopes. Thus, the extended 24 m emission is bright in dusty regions near massive stars and stellar clusters. In material that is shocked or exposed to very hard radiation fields associated with peculiar objects, the 24 m waveband may also have a contribution from spectral lines, such as [O IV] at 25.89 m. Emission in the 160 m waveband arises mostly from large dust grains in the ISM in equilibrium with the radiation field, which typically heats them to temperatures of several tens of degrees Kelvin. The 70 m waveband, finally, is a combination of VSG and large grain emission, in proportions that depend on the relative abundances of the grain populations (Désert et al., 1990).
5.1. The SMC in the Mid and Far Infrared
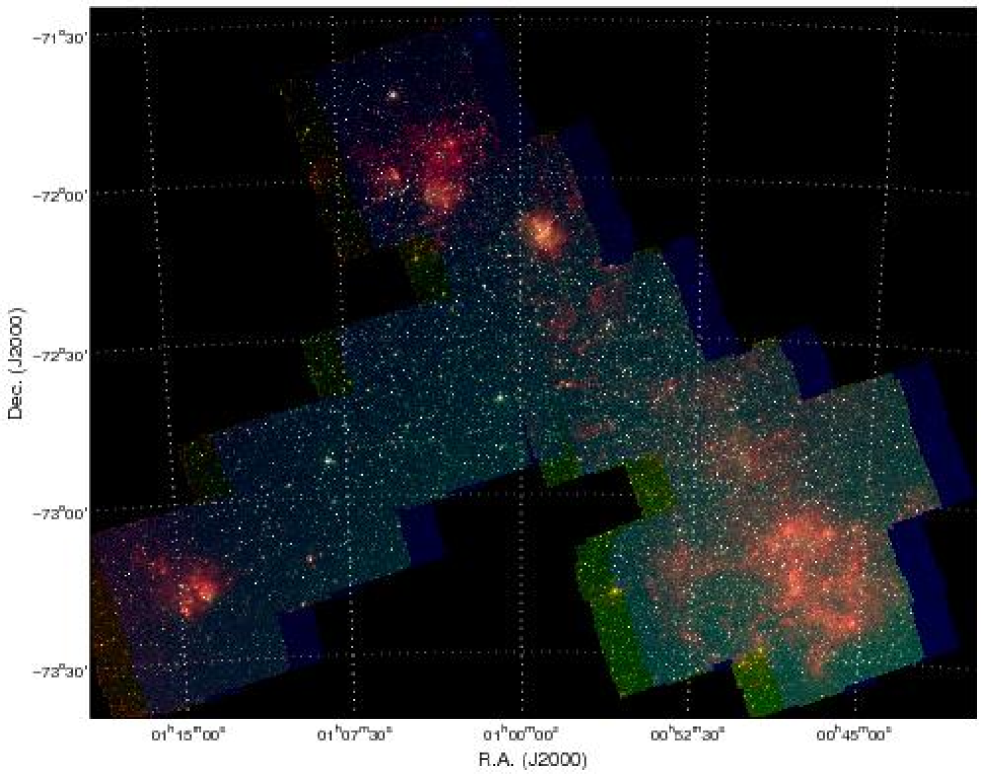
The Spitzer images of the SMC reveal an astounding degree of detail. Figure 3 is a color composite of the 8.0, 4.5, and 3.6 m wavebands corresponding to the red, green, and blue colors. The regions displaying bright red emission are associated with star formation and known molecular clouds: N 66 (NGC 346), the region around N 76, N 83/N 84, and the south-west tip of the Bar are all prominent at 8.0 m. The south-west region is also the region of highest stellar density, as evidenced by the bright diffuse blue background made up of sources beyond Spitzer’s confusion limit. Note that because the 3.6/5.8 m and the 4.5/8.0 m wavebands of IRAC occupy different places in the Spitzer focal plane, the areas mapped by each pair of channels do not completely overlap.
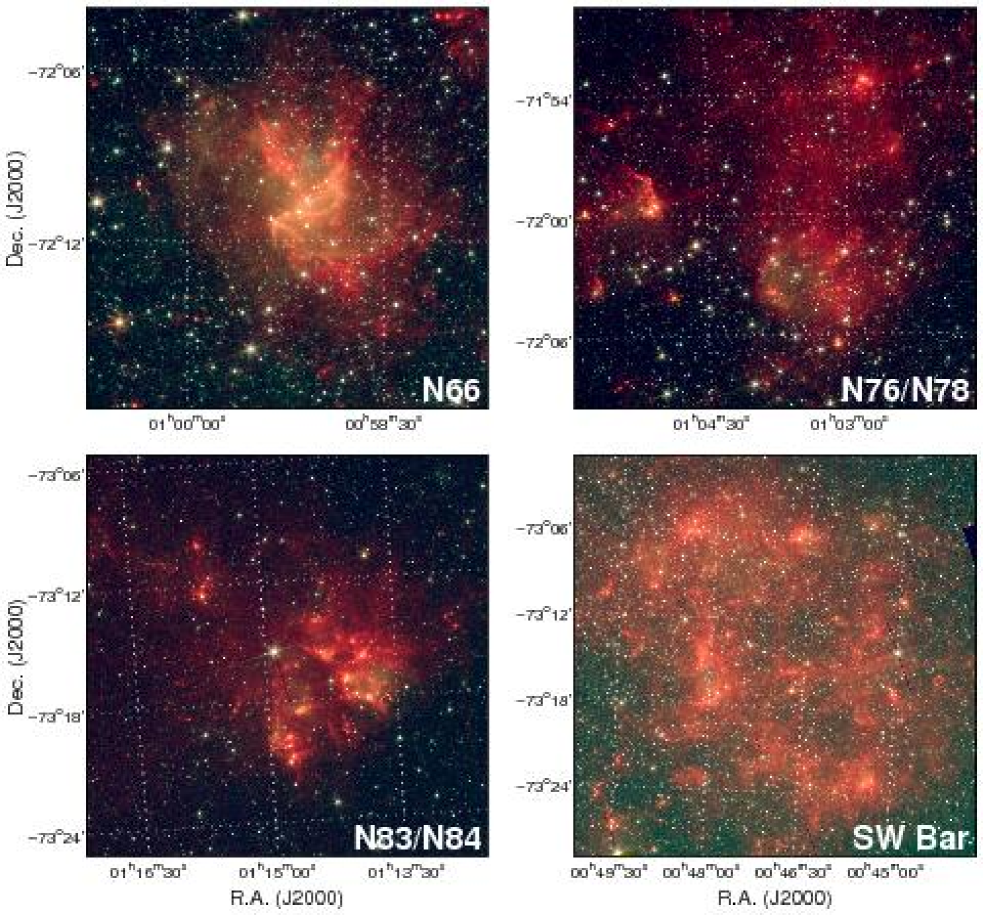
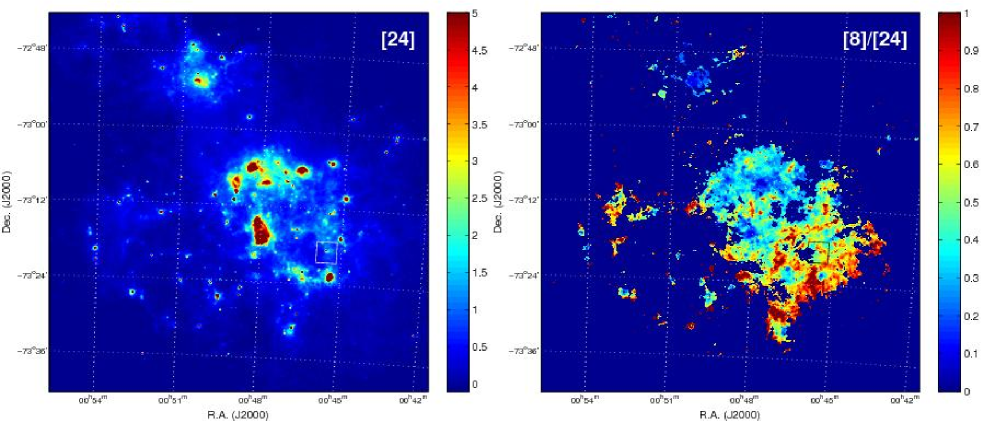
Close inspection of Figure 3 reveals that a dramatic change of the colors of the MIR extended emission takes place within star forming regions. Indeed, Figure 4 shows clearly that the bright extended 8.0 m emission frequently surrounds a well defined cavity around one or more stars, inside which the emission is bluer. This phenomenon is likely caused by the destruction of the carriers of the 8.0 m emission (nominally PAHs), which are obliterated by the intense radiation field present in H II regions. The transition between the regions of intense and faint 8 m emission is often sharp, probably corresponding to the edges of dense molecular material where shielding protects PAHs from photodestruction by UV radiation.
| Waveband | Total Flux11Approximate total flux in the corresponding Spitzer image after foreground subtraction. Note that the mapped area is different in the various wavebands. | Point sources | YSOs | Carbon stars | RSG/OAGB | Dusty B stars |
|---|---|---|---|---|---|---|
| (Jy) | (Jy) | (%) | (%) | (%) | (%) | |
| 3.6 m | 163 | 95.9 | 0.2 | 13.6 | 3.5 | 0.0 |
| 4.5 m | 115 | 71.4 | 0.4 | 14.4 | 3.2 | 0.1 |
| 5.8 m | 85 | 71.1 | 1.4 | 17.2 | 3.2 | 0.1 |
| 8.0 m | 78 | 51.6 | 5.0 | 18.6 | 2.3 | 0.6 |
| 24 m | 367 | 73.3 | 26.6 | 2.0 | 0.3 | 4.4 |
| 70 m | 9451 | 347 | 19.7 | 0.1 | 0.0 | 3.422From only 6 objects detected. Probably misidentified 70 m sources. |
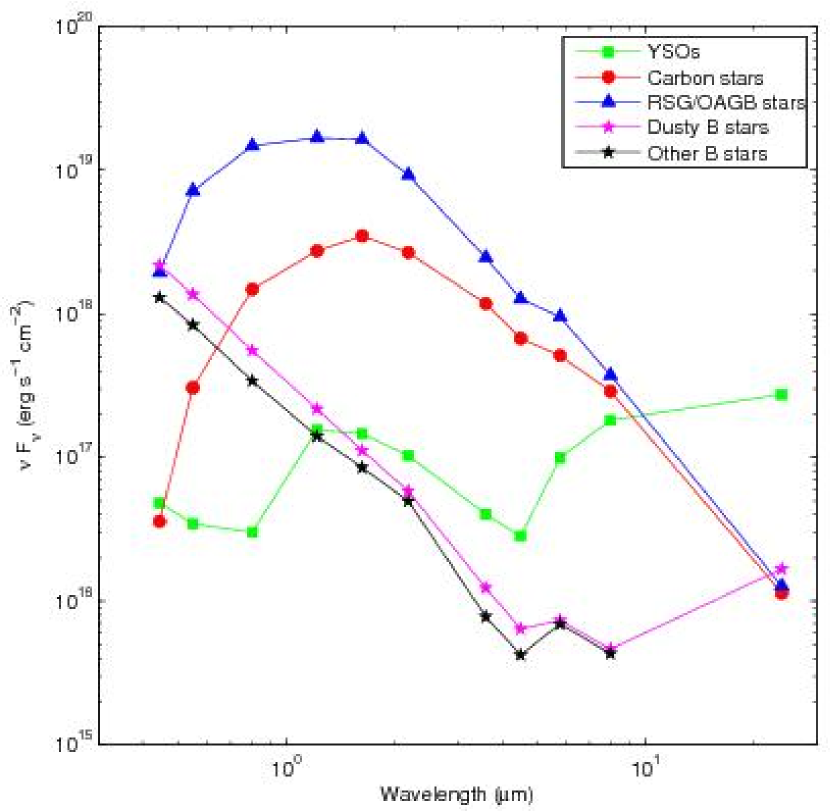
What percentage of the flux in the different wavebands is due to point sources? Moreover, to help interpret the unresolved infrared observations from distant metal-poor galaxies it is interesting to estimate the contribution to the global infrared flux arising from various types of point sources. Table 3 lists the fluxes measured over the entire S3MC images and compares it to the fluxes in the different classes of point sources discussed in §5.5. Considering the level of completeness in the phometric catalog in the areas of high confusion (e.g., the SW Bar), it is clear that most of the flux in the 3.6, 4.5, and 5.8 m wavebands is due to point sources. At 8 m, however, there is a noticeable contribution from extended emission that becomes rapidly dominant at the longer wavelengths of MIPS. Among the different types of sources discussed in §5.5, the carbon stars stand out prominently in the IRAC wavebands, while the YSOs are the largest fraction of resolved flux for MIPS. The red supergiants and oxygen-rich AGB stars, and the dusty early-B stars, although clearly detected in the analysis, are not prominent contributors to any of the Spitzer bands.
5.2. PAHs in the SMC
Among the recent Spitzer results is the disappearance of PAH emission in galaxies of low metallicity (Engelbracht et al., 2005; Hogg et al., 2005; Wu et al., 2006; O’Halloran et al., 2006). The F8/F24 flux ratio in galaxies changes dramatically at a metallicity of (the metallicity of the SMC), with low metallicity objects exhibiting very low ratios (F8/F24) compared to those seen in solar-metallicity objects (F8/F24). This decrease in the 8 m emission relative to 24 m is frequently interpreted as the enhanced destruction or reduced formation of PAHs in these environments (Plante & Sauvage, 2002; Madden, 2002; Madden et al., 2006). PAH destruction by itself, however, is probably not enough to account for the observed range in the F8/F24 ratio, which may require also an enhanced hot dust component in low-metallicity systems (Engelbracht et al., 2005). Figures 3 and 4 clearly show that there are large variations in the brightness of the 8 m emission depending on the local conditions. These images suggest on the scale of the entire SMC an important conclusion reached by Reach et al. (2000) using observations of a small, quiescent region: PAHs exist even in the low-metallicity interstellar medium when the local environment allows it.
We further explore the variation in the relative intensity of the 8 m waveband by producing a ratio map of the SW region of the Bar (Figure 5). In order to produce this image we convolved the 8 m image to a 6″ resolution, subtracted the foregrounds from each image (estimated from the modes of the respective histograms to be 5.09 and 21.90 MJy sr-1 for the 8 and 24 m images respectively), and median filtered the resulting images to remove most point sources. It is apparent that the F8/F24 ratio takes a large range of values, with an overall gradient increasing toward the southwest. This gradient has the opposite sense to the gradient in the brightness of the 24 m emission, an indicator of massive star formation and intense ISRF. Extended regions of the SW Bar exhibit typical of solar-metallicity objects, while other areas generally associated with bright 24 m continuum and massive star formation have . Because there are no large variations of metallicity across the SMC (Dufour, 1984), it appears that the PAH abundance (at least as traced by the F8/F24 ratio) is regulated primarily by the local ISRF rather than metallicity. This does not imply that metallicity plays no role on setting the abundance of PAHs on galactic scales. In the context of global measurements of galaxies, where the ISRF is a function of metallicity, this observation suggests that photodestruction of PAHs, not reduced formation, may be primarily responsible for the range of values measured for the F8/F24 ratio.
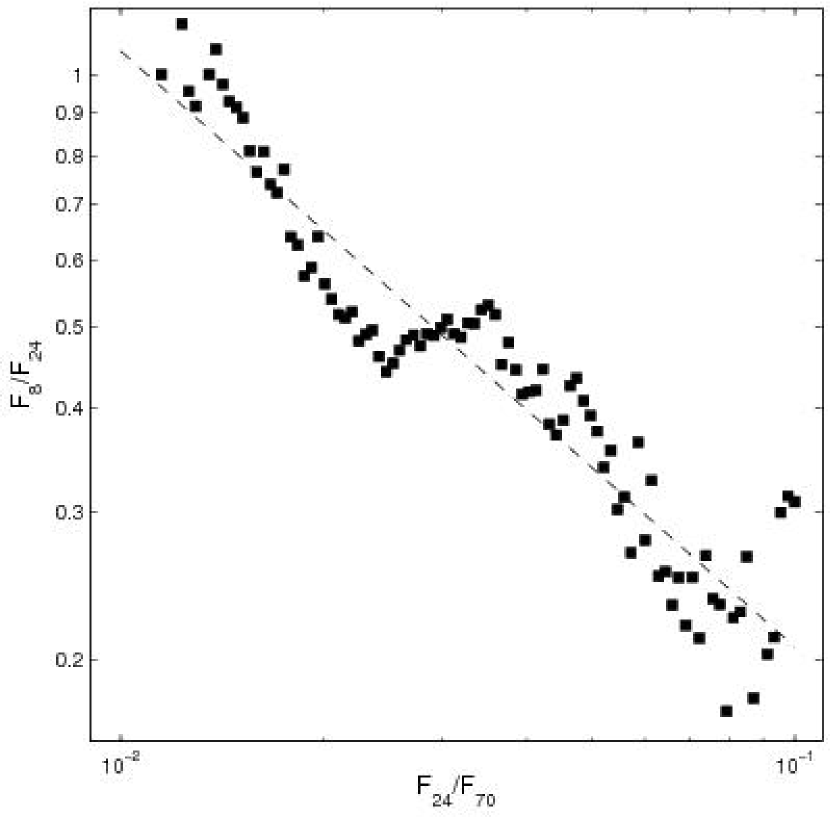
Figure 6 shows a quantification of the relationship between this ratio and the dust FIR color . To obtain this plot we convolved the 8 and 24 m images of the SW Bar region to the angular resolution of the 70 m data, resampled the median-filtered maps to obtain approximately one pixel per resolution element, and removed the corresponding foregrounds from the individual images (in addition to the 8 and 24 m foregrounds mentioned above, we estimate the 70 m foreground to be MJy sr-1). We considered only data with , , and MJy sr-1 after foreground removal. We computed the density of points in the F8/F24 ratio versus the F24/F70 ratio plane, and calculated its mean in F24/F70 bins. We find that, albeit with large scatter, the trend for the F8/F24 ratio as a function of F24/F70 is described by . The uncertainties in these parameters are considerable and due mostly to uncertainties in the foreground substraction. This shows that regions with blue dust colors (thus presumably high radiation fields) tend to be underluminous in 8 m emission with respect to 24 m, again suggesting a link between the intensity of the local ISRF and the presence of PAH emission. The determination of the precise roles of PAH destruction and enhanced 24 m VSG emission in setting the F8/F24 ratio will have to await upcoming spectroscopic observations. About 55% of the 8 m flux and 22% of the 24 m flux in the SW Bar image are associated with regions where . The overall ratio of the total 8 and 24 m fluxes in this region of the SMC is . We defer the detailed quantitative study of the extended emission of the SMC in the FIR and MIR to a series of subsequent papers (Leroy et al., in prep.; Sandstrom et al., in prep.; Bolatto et al., in prep.).
.
5.3. Infrared Point Sources and Their Optical Counterparts
Perhaps one of the most interesting matters to pursue using the S3MC point source catalog is to investigate the classes of sources detected by Spitzer in its different wavebands. The cross identification against optical data is very valuable in this regard, as the techniques of source classification based on the MIR colors and magnitudes alone are currently in their infancy. The S3MC catalog provides unique deep photometric data on a large sample of stars located at the same distance, with similar metallicities, and low levels of foreground and background confusion. We expect that one of the contributions of this dataset will be to provide a basis for testing different source-identification schemes.
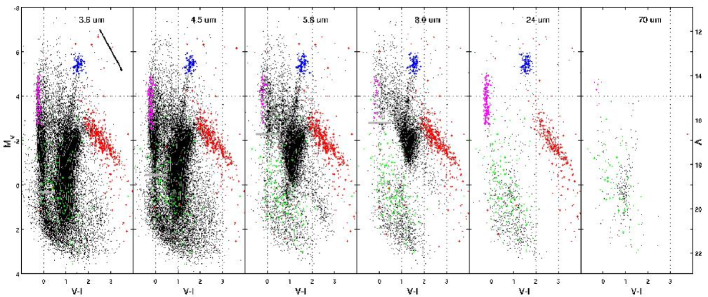
Figure 7 shows the optical color-magnitude diagrams (CMDs) for sources detected in each Spitzer waveband at a signal-to-noise greater than 10. Several populations are immediately apparent: 1) the main sequence for stellar types earlier than A0, at approximately zero color; 2) the blue-loop helium core-burning stars, running parallel to the main sequence; 3) the red giant branch and the red clump, where most of the Spitzer sources are found, at ; 4) the asymptotic giant branch (AGB) and the red supergiants (RSG); 5) the approximately horizontal branch corresponding to evolved carbon stars, at and ; and, 6) a fuzz of sources at low luminosities that consist of misidentifications, stars in the Milky Way halo and thick disk, unresolved background galaxies, and highly reddened sources. The location of the blue-loop stars is both theoretically and observationally linked to the metallicity of the intermediate-mass stars that populate this feature; i.e., theoretical isochrones show a metallicity dependence on the location of the blue loop in the CMD (Girardi et al., 2000; Lejeune & Schaerer, 2001), and the observations of different metallicity dwarf irregular galaxies confirm that the location of the blue-loop stars varies with metallicity as predicted by isochrones (e.g., Dohm-Palmer et al., 1997, 1998). In the SMC, the blue loop stars are well separated from the main-sequence as expected for their metallicities. The foreground plume is nearly vertical at whereas the RSG stars occupy a locus that is slightly slanted at and to almost . The foreground plume has been seen in other studies of the stellar populations of Local Group dwarf galaxies (e.g. McConnachie et al., 2005).
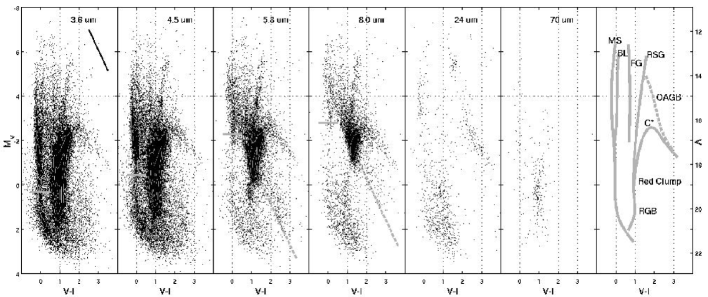
As the sensitivity of our observations, indicated by the gray bar on the main sequence, diminishes for the longer wavebands, we progressively lose the fainter sources. The sensitivity across the CMD, however, is clearly dependent on the color and follows a trend, illustrated by the dashed gray lines in Figure 7, that is approximately parallel to the reddening vector illustrated in the upper right corner of each panel. This reddening vector corresponds to AV/E(), derived using SMC measurements and assuming a Galactic E()/E() (Bouchet et al., 1985; Rieke & Lebofsky, 1985). The color dependence of the sensitivity suggests that many sources in the highly reddened region of the CMD could be intrinsically brighter stars located behind a few magnitudes of extinction. The spatial distribution of these reddened stars, however, is not strongly clustered. Such clustering would be expected if they were located behind localized regions of extinction, such as molecular clouds. Clearly, if the reddening of these stars is caused by dust, this dust must be closely associated with the sources themselves. Most of these sources, however, do not exhibit a strong infrared excess, which makes this explanation unlikely. Alternatively, these sources may be K and M dwarfs in the disk and halo of our own Galaxy, at distances of less than 2 kpc. Their infrared colors (, ) support this hypothesis. The slope in the sensitivity would then be related to the slope of the lower main sequence, weighted by the distance distribution of the sources. In addition to these foreground interlopers, there is contamination by background, unresolved galaxies, which can be seen throughout the SMC at infrared wavelengths. We discuss the importance of these contaminants in §5.5.1.
We do not expect to detect stellar photospheres in the MIPS wavebands. Indeed, the drops in detector sensitivity and in stellar flux (which approximately follows a Rayleigh-Jeans law), combine to lower our detection limit by mag at 24 m with respect to the 8.0 m IRAC waveband. Thus, only the brightest red supergiants and AGB stars are directly detectable at 24 m. The other sources found in the MIPS images must have a substantial infrared excess from dusty envelopes or emission lines, or correspond to misidentifications. The latter is probably the case with the optical counterparts of most sources at 70 m, which are distributed in the CMD plane very much like a randomly drawn subsample of the population detected at 3.6 or 4.5 m.
Besides the bright end of the AGB and the RSG stars, there are three other distinct populations of sources clearly detected at 24 m. The bright end of the main sequence shows an overdensity of sources with and absolute magnitudes in the range , corresponding to stellar types B3 to O9. The highly reddened side of the diagram shows the branch corresponding to evolved carbon stars, with an overdensity of sources connecting it to the red supergiants. Finally, the spread of sources at the bottom of the diagram, which persists also throughout the IRAC bands, is not entirely consistent with a randomly drawn subsample of the detections at 3.6 or 4.5 m. Although there is probably strong contamination, if the bottom of the CMD were entirely composed of misidentified sources we would expect it to look much more like the 70 m diagram, with a source density following closely the contours of the CMDs for the lowest IRAC wavebands and featuring a prominent red clump. It does not, thus a sizable fraction of these sources are indeed bright MIR sources with very faint optical counterparts. It turns out that many of them have very red MIR colors, and are consistent with background galaxies and foreground M dwarfs. We will investigate this matter further in §5.5.
The fact that the carbon star branch is prominent at 24 m suggests that it may be possible to use Spitzer observations to identify these sources, which are common contaminants in extragalactic chemical evolution studies. Carbon stars are difficult to analyze due to their plethora of carbon molecular lines, which affect the continuum placement in the analysis of the spectra. This problem is even more accute in low-metallicity galaxies, where carbon stars are more abundant (Blanco et al., 1978, 1980) and have stronger C2H2 bands (van Loon et al., 2006; Sloan et al., 2006). Recent work on dwarf spheroidal galaxies, for example, has been based on detailed spectral analyses of RGB stars (e.g., Shetrone et al., 2003; Tolstoy et al., 2003; Sadakane et al., 2004). The selection of the target stars, however, is not always obvious and suffers from the inclusion of carbon stars. In fact, because the studied galaxies are far away the stars selected tend to be at the tip of the RGB, where there is the greatest overlap and confusion potential with carbon stars. In the aforementioned studies these contaminants amounted to 25% of the original sample, and weeding them out required a large time investment in an 8m class telescope. With infrared colors, target selection can be significantly improved. As shown by Sloan et al. (2006), and also seen here, the carbon stars easily separate out from RGB stars at infrared wavelengths, e.g., 3.6, 4.5, 5.8, 8.0, and even 24 m. Analysis of the old RGB stars in the dwarf irregular galaxies may show similarities to the metal-poor halo of our Galaxy, and help to explain the formation of our Galaxy, unlike the chemistry of the metal-poor stars in the nearby dwarf spheroidal galaxies which do not show chemical similarities with metal-poor stars in our Galaxy at all (Venn et al., 2004).
5.4. Mid and Far IR Color-Magnitude Diagrams
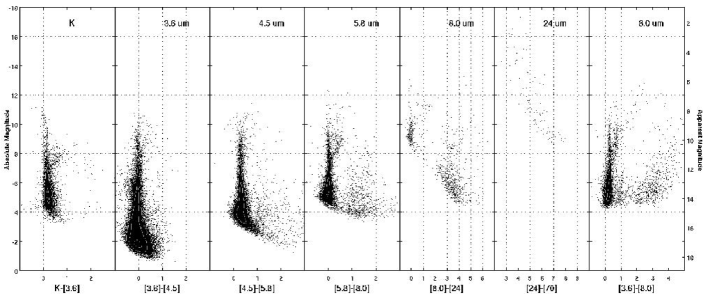
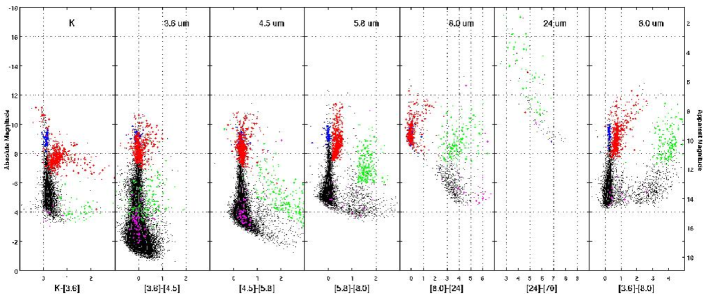
Figure 8 shows the color-magnitude diagrams in different combinations of the Spitzer wavebands. The progression from left to right shows the absolute magnitude in one band plotted against the color with respect to the next Spitzer waveband. The rightmost panel shows the 8 m magnitude versus the color, a CMD modeled by Whitney et al. (2003).
Several features are apparent in these plots. Since most stars emit like blackbodies in the infrared, they pile on a vertical line near zero color constituting a MIR “main sequence”. At longer wavelengths there is an increasing number of objects that appear as a red plume of sources, which becomes progressively more detached from this main sequence. In several of these CMDs there is also a number of sources in a branch off the main sequence toward redder colors at high luminosities. At the longer wavebands the progressive loss of sensitivity results in a diminishing number of sources detected on the main sequence, until in the 24 m vs. CMD most sources have a color redder than 3, implying a ratio of fluxes and a spectral energy density rapidly rising toward the far infrared.
5.5. Stellar Populations
To gain insight into the nature of the different stellar populations detected, we used color and flux selection criteria in the CMDs to pull out particular subsets of sources (Figures 9 and 10). We defined four groups of sources, which we discuss below. Sources in groups 1 to 3 are a substantial fraction of the brightest sources seen in our Spitzer data (, Figure 2).
-
1.
Sources with , and . We also require that these sources be detected with at these wavebands and one neighboring waveband (either 4.5 or 24 m). About 280 sources fall into this category. They are representative of the highly reddened plume present in the 5.8 m CMD.
-
2.
Sources with and and . About 660 sources fall into this class. These correspond to the branch that splits off the upper main sequence in the MIR. These sources are identified by their optical CMD as carbon stars.
-
3.
Sources detected with at 24 m and with optical colors and absolute magnitude . About 130 sources belong to this category. These represent the red supergiants and the bright end of the OAGB (i.e., oxygen-rich evolved stars) detected at 24 m.
-
4.
Sources detected with at 24 m and at or m, with optical colors and absolute magnitude . These sources correspond to the population of early-B stars (B3 to O9) detected at 24 m; about 190 (5%) of the stars that fulfill these optical color criteria have 24 m counterparts. Inspection of the individual SEDs to cull sources with poor or likely misidentified photometry reduces the sample to sources.
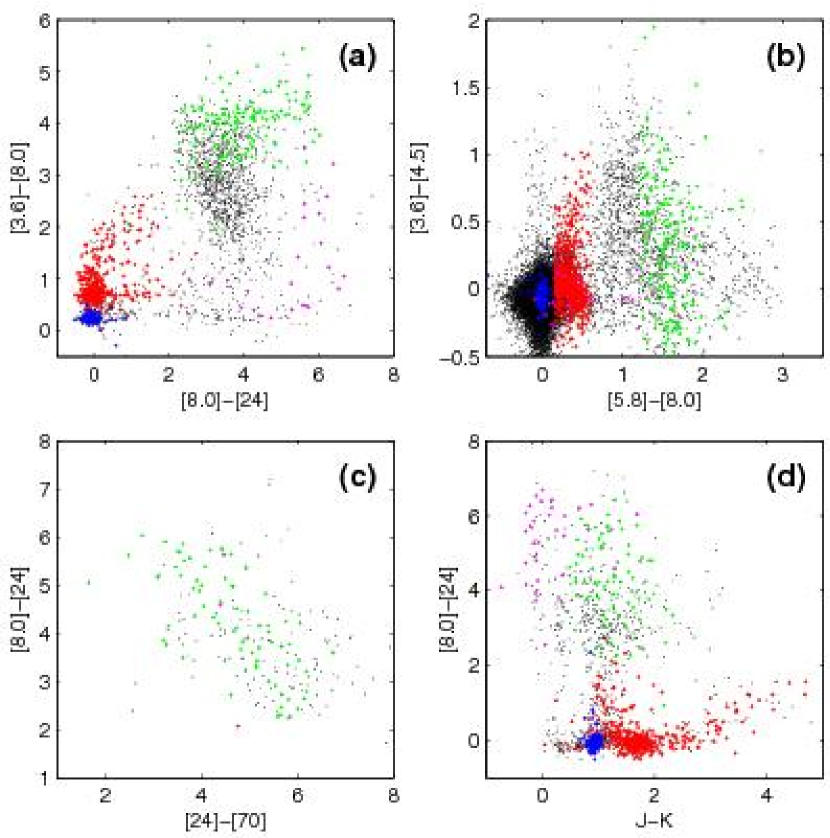
These populations have been highlighted in the optical CMDs in Figure 9. This plot shows that the stars with large 8.0 m excess selected in the MIR CMDs (group 1 defined above) have only very faint optical counterparts, as they are almost all located in the spread of sources at the bottom of the diagram. Many of these counterparts may in fact be misidentifications. The bright stars with small 8.0 m excess (group 2) are clearly identified with the branch of carbon stars in the optical. Bright carbon stars have been studied using Spitzer spectroscopy by Sloan et al. (2006). They find that oxygen-rich and carbon-rich AGB can be split into two sequences using and colors, with the oxygen-rich and carbon-rich sources forming two sequences around and , and and respectively (see also Blum et al., 2006). We clearly see both sequences in Figure 12d. The carbon stars, as well as the red supergiant stars selected in group 3, are not preferentially distributed along the SMC Bar but show a much smoother spatial distribution (Figure 11b,c). In particular, the distribution of the MIR-selected carbon stars is compatible with the spheroidal shape found by other studies of the older SMC stellar populations (e.g., Cioni et al., 2000; Zaritsky et al., 2000).
Identification of these populations in the CMDs in Figure 10 shows some of their MIR characteristics. The red supergiants, for example, are also most of the brightest stars in the MIR. Many of the rest of the brightest stars are carbon stars, which form a distinct branch off the main sequence not only in the color, but also in the CMD. The B stars with 24 m excess cluster near the bottom of the main sequence in most of these CMDs due to their large bolometric corrections at IR wavelengths, although they tend to be under-represented at the longest wavelengths because very few are detected at 5.8 or 70 m.
5.5.1 A Sample of Young Stellar Objects in the SMC
The highly reddened 8.0 m sources in group 1 constitute many of the sources detected at both 24 and 70 m. Their spatial distibution (Figure 11a) is highly clustered around known molecular clouds and star forming regions, suggesting that many of these sources are still embedded young stellar objects (YSOs), with a secondary contribution from unresolved extragalactic background sources. Further support for this hypothesis is lent by the location of these sources in the [8.0] vs. CMD, as well as in the color-color plots in Figure 12. These combinations of colors have been modeled by Whitney et al. (2003) for different objects, including YSOs. The highly reddened 8.0 m sources occupy the space in those plots that is predicted for late Class 0 to Class II YSOs with different geometrical parameters. About 280 candidate YSOs fulfill our color-magnitude criteria, and they are compiled in Table 4 (published in its entirety in the electronic edition of the journal). The color-magnitude selection criteria used to identify these sources have been chosen to minimize the contamination of the sample, and limit us to the brightest YSOs in the SMC; clearly there is a large population of fainter YSOs detected in this survey as well, but it is highly contaminated by background galaxies (Figure 11e). By modeling the SEDs of individual sources rather than relying only on color selection it is possible to identify a larger samples of YSOs in these data. Simon et al. (in prep.) successfully use this technique to identify over 200 YSOs with stellar masses as low as 1.5 M⊙ in the N 66 region alone.
Missing from Figure 12 are the early Class 0 YSOs, which are predicted to have extreme colors . Our sensitivity at 24 m would not, for the most part, allow us to detect such sources. Thus, some of our 70 m detections without 24 m counterparts may be early Class 0 YSOs (Figure 11f). There are approximately 370 highly significant () 70 m detections without 24 m counterparts in our photometry, with a total flux Jy (i.e., almost twice the total flux in our sample of YSOs in Table 5.5.1 YSOs as noted in Table 3). Because of the limited angular resolution at 70 m, the image artifacts, and the bright extended emission result in catalog reliability and confusion issues, however, we defer such a study to a separate paper (Simon et al., in prep.).
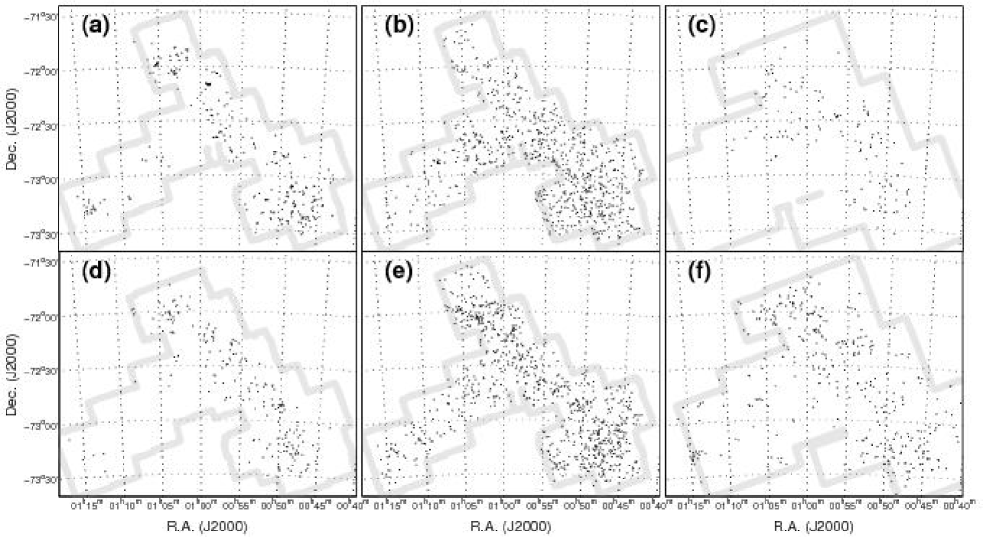
To quantify the degree of contamination by background galaxies and foreground thick disk interlopers we have used the SWIRE catalog of the ELAIS-N1 field by Surace et al. (2004). This field is conveniently located at the same Galactic latitude as the SMC but in the northern hemisphere, and at a Galactic longitude comparable to that of the SMC (). Applying exactly the same color and magnitude criteria we used to find YSOs in the S3MC catalog to the SWIRE catalog we find 70 sources in the entire 8.7 square degree ELAIS-N1 field (Lonsdale et al., 2003). Scaling this number to the 5.8 and 8.0 m overlap area in the S3MC mosaic (2.45 square degrees), we expect contaminants in our sample of candidates (). The magnitude and color cuts employed are designed to minimize the degree of contamination: pushing below rapidly increases the number of background galaxies included. Reducing the faint magnitude cut to results in interlopers out of 533 sources (). Moving the limit in to bluer colors, although more benign than including fainter sources, results also in a higher rate of contaminants. Using (1.0) yields 40 (27) interlopers in a total of 386 (340) sources, or (8%) contamination. Figure 11e shows the spatial distribution of sources that have the same colors as our YSO candidate sample but that are fainter than . Although there is an concentration of such sources along the Bar and in known star-forming regions, they are much more uniformly distributed than our YSO sample, pointing to heavy contamination by sources outside the SMC.
5.5.2 A Population of Dusty Early B Stars in the SMC
Figure 9 shows that the early B stars detected at 24 m, defined as group 4 above, have an extremely interesting spectral energy distribution. They gradually disappear in the 5.8 and 8.0 m wavebands, then strongly reappear at 24 m, and there are virtually no detections at 70 m. These 24 m-bright stars are not conspicuous at any other wavelength. Their typical absolute magnitudes in any of the IRAC bands are , while their mean 24 m absolute magnitude is . Their mean SED (Figure 13) shows that the typical 24 m excess over the photospheric flux is very large, , otherwise we would not have detected them. Their color, an excess indicator widely used because of its independence from the stellar temperature, is extremely large, with a typical value .
The sharp rise in the SED of these stars at 24 m can be explained by emission from M⊕ of dust at a temperature of T K, or perhaps by an emission line present in the 24 m window. It is difficult to imagine what such an emission line could be, since the usual candidates such as [O IV] at 25.89 m or [Fe II] at 24.52 m are not prominent in normal stars. If dust is the cause of their detection at 24 m, however, a particular geometry is required because these stars are not appreciably reddened in the optical. Their intrinsic colors are and (after removing the line-of-sight reddening to the SMC), while the photospheric colors of B0 stars of metallicity are and . The preferred geometry would be a face-on disk if the material is close to the star, a tenuous envelope, or a thin disk with a large central gap seen at arbitrary viewing angles. It could be argued that, since these stars were selected from their optical colors, the fact that they are only slightly reddened is not surprising. The FWHM of the 24 m emitting B star sequence seen in Figure 7, however, is only 0.08 mag in . This is completely consistent with the FWHM of the normal, main sequence B stars (0.07 mag). The 24 m-bright B stars therefore form a sequence as sharp as the main sequence with no sign of additional spread due to intrinsic reddening. Both this fact and Figure 7 show that there is no evidence of a population of more reddened but otherwise similar sources. This suggests that the dusty material is arranged in a very tenuous envelope or in a thin disk with a large central gap, so that viewing angle does not play a role in the selection of these stars. Given the very large luminosity of the central source, material at T K near an early-B star should be located at distances of AU or more (Backman & Paresce, 1993).
What are these “24 m excess” early-B stars? Searches for these objects in the SIMBAD and VizieR databases indicate that out of approximately 190 stars in this group, 10 are eclipsing binaries (out of 1351 such objects found by OGLE in the SMC; Wyrzykowski et al., 2004), and 12 are emission line stars (Meyssonnier & Azzopardi, 1993). In these aspects, this population does not seem peculiar. These sources are present in the SMC Bar and the tip of the Wing (Figure 11d), in regions of recent star formation. Their spatial distribution is, in fact, similar to that of the YSO candidates although not as strongly clustered, which is consistent with expectations for Myr old stars. We consider four possible explanations for the origin of these objects and their 24 m emission: 1) an accretion disk remnant, 2) free-free emission associated with emission line stars, 3) a circumstellar debris disk, or 4) nearby cirrus emission unrelated to the stars themselves. We briefly discuss these possibilities below, but an in-depth discussion of these sources is deferred to a forthcoming paper (Bolatto et al., in prep.).
Far infrared excess in stars is frequently a sign of stellar youth. These dusty B stars may be in the process of shedding their accretion remnants through photoevaporation. These early-B stars exhibit small ratios of IR excess luminosity to stellar luminosity, , rather than the much larger ratios observed in young stellar objects, . This fact, and their optical colors, suggest that their 24 m emission may be due to a remnant accretion disk or envelope with a large central gap, and that we may be observing them in the very late stages of the accretion process. Disk dispersal timescales, and in particular the timescale for removing the outer disk, are not well known for massive stars. Models of less massive stars, however, suggest that the outer disk clearing time is dominated by photoevaporation, and that its dispersal occurs very quickly after the inner disk is cleared (Alexander et al., 2006a, b). This phase in the lives of stars would be, consequently, very short, which suggests its observation is improbable.
Although Milky Way emission line stars frequently have IR excesses, it seems unlikely that the 24 m emission observed in our SMC objects is explained by the various types of Be activity. A type of infrared excess associated with this activity is observed in Galactic Herbig Ae/Be stars, which are young, massive stars that may host circumstellar disks or envelopes that remain from the protostellar accretion phase and give rise to IR emission (Hillenbrand et al., 1992). Classical Be stars, on the other hand, are older objects whose IR excess comes from free-free emission associated with their stellar winds and circumstellar disks. Be stars in the Milky Way tend to be later spectral types, but there is some evidence pointing to a large abundance of very early spectral types in the Magellanic Cloud (Grebel et al., 1993; Wisniewski & Bjorkman, 2006). We already mentioned that only a few of these 24 m emitting early-B stars are identified as Be stars in existing catalogs. Be envelopes are hot and close to the star, showing an infrared excess at m (e.g., Waters & Waelkens, 1998). Most, albeit not all, of our objects do have a small excess shortwards of 24 m. At 4.5 m the measured flux is 75% over the photosphere predicted by a Kurucz model tied to the observed V magnitude, and only a handful of these stars show an excess over a factor of 2. By comparison, in the prototypical Herbig Ae/Be star AB Aur the observed emission exceeds the photospheric emission by more than an order of magnitude at 4.5 m, and similarly large excesses are observed in many classical Be stars (e.g., Miroshnichenko et al., 2003). Furthermore, the mean SED of our 24 m emitting B stars shortward of 24 m is indistinguishable from the mean SED of B stars with the same and but undetected at 24 m (Figure 13). More importantly, Figure 13 (as well as inspection of the individual SEDs) shows that for most of our objects the observed short-wavelength excess cannot explain their 24 m emission, where the SED takes a significant turn upwards.
The low IR luminosity of these SMC stars in comparison to their photospheric stellar luminosity is characteristic of systems hosting debris disks (e.g., Rieke et al., 2005; Gorlova et al., 2006; Chen et al., 2006). These disks are mostly devoid of gas, and form and replenish through the grinding of planetesimals. The small 24 m excess in our SMC early-B stars relative to their luminosity () is very similar to the typical excess observed in debris disks (), where only a small fraction of the radiation from the central source is captured by the dust and reradiated in the IR (e.g., Uzpen et al., 2005). This is, of course, an exciting possibility since it would provide indirect evidence for the existence of planets in a galaxy other than our own. There is a well-known deficit of giant planets (found by radial velocity techniques) around subsolar-metallicity stars that suggests such planets would be rare in a low-metallicity galaxy such as the SMC (Fischer & Valenti, 2005). Recent observations, however, find that this deficit of giant planets does not translate into a deficit of debris disks (Greaves et al., 2006; Bryden et al., 2006). Debris disks around massive early-B stars would be populated by millimeter-size particles, as radiation pressure should rapidly clear out smaller particles (unless gas drag is significant). By comparison, recent spectroscopic observations suggest that debris disks around less massive A and F stars are populated by particles with sizes larger than 10 m (Jura et al., 2004; Chen et al., 2006).
The final possibility we consider for the origin of the 24 m emission is cirrus hotspots, sometimes noted as the Pleiades effect (e.g., Sloan et al., 2004). Cirrus hotspots occur where radiation from a massive star dominates over the ISRF, heating a nearby patch of interstellar dust above the typical temperature of cirrus emission (van Buren, 1989). Following van Buren & McCray (1988), we estimate that the distance over which an early-B star can heat small ( m size) ISM dust grains to temperatures T K is pc, or at the distance of the SMC. This would appear as a unresolved source in our data for everything except the brightest B0-O9 stars, and thus be very difficult to disentangle from a remnant accretion disk or a debris disk without additional observations at higher resolution.
6. Summary and Conclusions
We have used the Spitzer Space Telescope to image the star-forming body of the SMC in the mid and far IR with unprecedented sensitivity and resolution.
IRAC images of the SMC show a wealth of diffuse emission across the SMC seen for the first time. Particularly striking is the diffuse emission at 8 m, often associated with star-forming regions. We have used these images to take a first look at the F8/F24 ratio (an estimator of PAH abundance) across the SW Bar region of the SMC. We find that this ratio has large spatial variations, and takes a wide range of values even in a small region. Extended emission in the southernmost part of the SW Bar has , typical of solar-metallicity galaxies, while near the sites of massive star formation and bright 24 m emission (suggesting large radiation fields) the ratio drops to the observed in metal-poor galaxies (Engelbracht et al., 2005). Because existing surveys of abundances in H II regions find no evidence for a gradient (or even a large scatter) for metallicity in the SMC, we conclude that the wide range of values taken by the F8/F24 ratio in this galaxy, and the wide range of PAH abundance suggested by it, is primarily driven by the local ISRF and not metallicity. We find that the relationship between the F8/F24 ratio and the FIR dust color represented by the F24/F70 ratio can be described by , showing that regions of blue FIR color are deficient in 8 m PAH emission relative to their 24 m intensity.
We combine these observations with optical and near-IR photometry in the literature to produce a catalog of point sources that spans from optical wavelengths to 70 m. We use this catalog to investigate the nature of the sources detected in the Spitzer wavebands. We find that the most prominent sources detected at the long wavelengths fall into four categories: 1) sources with very faint optical counterparts and very red () colors. This population corresponds to YSOs, with some contamination from background galaxies and foreground dwarfs that we estimate using the SWIRE ELAIS-N1 catalog. 2) Bright MIR sources () with midly red colors (), many of which have bright optical counterparts. These are identified as carbon stars. 3) Bright mid infrared sources with neutral colors and bright optical counterparts, corresponding to oxygen-rich AGB and red supergiant stars. And 4) a class of dusty early B stars (B3 to O9, based on the optical photometry) that are not appreciably reddened optically, but that have large excesses at 24 m most of which cannot be explained by free-free emission. We use our multiwavelength data to compile a catalog of 282 bright YSOs in the SMC, where we choose the color-magnitude cuts to allow for only 7% contamination by background or foreground sources (Table 4).
Finally, we discuss the population of early B stars detected at 24 m, which constitutes a few percent () of the B stars in a narrow region of the optical color-magnitude space, and shares many of the observational signatures of debris disks or cirrus hotspots in the Milky Way. Based on their small near IR excess and the fact that most of these objects are not found in existing objective prism catalogs, we conclude that the bulk of these systems are not emission line stars. They may constitute a population of young massive stellar systems caught in the act of photoevaporating their accretion disks, but the timescale derived by models for such process suggests that this is unlikely. Dust associated with debris disks or cirrus hotspots (i.e., the Pleiades effect) appear to be the most likely explanation for the origin of their 24 m emission.
The S3MC point source catalog constitutes a deep and uniform photometric database for a large sample of stars located at the same distance, with similar metallicities, and low levels of foreground and background confusion. We expect that one of the contributions of this work will be to supply the basis on which to test different schemes for identifying mid- and far-infrared sources. The S3MC observations provide a unique resource for the study of stellar evolution, dust production, dust properties, and the interaction between the ISM and star formation in an environment that, because of its proximity and low metallicity, has closer resemblance to the conditions prevalent in primitive galaxies than any other galaxy that can be studied in similar detail.
References
- Alexander et al. (2006a) Alexander, R. D., Clarke, C. J., & Pringle, J. E. 2006, MNRAS, 369, 216
- Alexander et al. (2006b) Alexander, R. D., Clarke, C. J., & Pringle, J. E. 2006, MNRAS, 369, 229
- Babbedge et al. (2006) Babbedge, T. S. R., et al. 2006, MNRAS, in press (arXiv:astro-ph/0605305)
- Backman & Paresce (1993) Backman, D. E., & Paresce, F. 1993, in Protostars and Planets, Vol. 3, ed. E. H. Ley & J. I. Lunine (Tuckson: Univ. Arizona Press), 1253
- Le Bertre (1992) Le Bertre, T. 1992, A&AS, 94, 377
- Le Bertre (1993) Le Bertre, T. 1993, A&AS, 97, 729
- Blanco et al. (1978) Blanco, B. M., Blanco, V. M., & McCarthy, M. F. 1978, Nature, 271, 638
- Blanco et al. (1980) Blanco, V. M., Blanco, B. M., & McCarthy, M. F. 1980, ApJ, 242, 938
- Blum et al. (2006) Blum, R. D., et al. 2006, ApJ, in press, (astro-ph/0608189)
- Bot et al. (2004) Bot, C., Boulanger, F., Lagache, G., Cambrésy, L., & Egret, D. 2004, A&A, 423, 567
- Bouchet et al. (1985) Bouchet, P., Lequeux, J., Maurice, E., Prevot, L., & Prevot-Burnichon, M. L. 1985, A&A, 149, 330
- Bryden et al. (2006) Bryden, G., et al. 2006, ApJ, 636, 1098
- van Buren (1989) van Buren, D. 1989, ApJ, 338, 147
- van Buren & McCray (1988) van Buren, D., & McCray, R. 1988, ApJ, 329, L93
- Chen et al. (2006) Chen, C. H., et al. 2006, ApJ, in press (astro-ph/0605277)
- Cioni et al. (2000) Cioni, M.-R. L., Habing, H. J., & Israel, F. P. 2000, A&A, 358, L9
- Clayton et al. (2003) Clayton, G. C., Wolff, M. J., Sofia, U. J., Gordon, K. D., & Misselt, K. A. 2003, ApJ, 588, 871
- Cohen et al. (2003a) Cohen, M., Megeath, S. T., Hammersley, P. L., Martín-Luis, F., & Stauffer, J. 2003, AJ, 125, 2645
- Cohen et al. (2003b) Cohen, M., Wheaton, W. A., & Megeath, S. T. 2003, AJ, 126, 1090
- Contursi et al. (2000) Contursi, A., et al. 2000, A&A, 362, 310
- Crowl et al. (2001) Crowl, H. H., Sarajedini, A., Piatti, A. E., Geisler, D., Bica, E., Clariá, J. J., & Santos, J. F. C. 2001, AJ, 122, 220
- Davies et al. (1976) Davies, R. D., Elliott, K. H., & Meaburn, J. 1976, MmRAS, 81, 89
- Désert et al. (1990) Desert, F.-X., Boulanger, F., & Puget, J. L. 1990, A&A, 237, 215
- Egan et al. (2003) Egan, M. P., et al. 2003, AFRL Tech. Rep. No. AFRL-VS-TR-2003-1589
- Dohm-Palmer et al. (1997) Dohm-Palmer, R. C., et al. 1997, AJ, 114, 2527
- Dohm-Palmer et al. (1998) Dohm-Palmer, R. C., et al. 1998, AJ, 116, 1227
- Dufour & Harlow (1977) Dufour, R. J., & Harlow, W. V. 1977, ApJ, 216, 706
- Dufour (1975) Dufour, R. J. 1975, ApJ, 195, 315
- Dufour (1984) Dufour, R. J. 1984, IAU Symp. 108: Structure and Evolution of the Magellanic Clouds, 108, 353
- Engelbracht et al. (2005) Engelbracht, C. W., Gordon, K. D., Rieke, G. H., Werner, M. W., Dale, D. A., & Latter, W. B. 2005, ApJ, 628, L29
- Fazio et al. (2004) Fazio, G. G., et al. 2004, ApJS, 154, 10
- Fischer & Valenti (2005) Fischer, D. A., & Valenti, J. 2005, ApJ, 622, 1102
- Galliano et al. (2005) Galliano, F., Madden, S. C., Jones, A. P., Wilson, C. D., & Bernard, J.-P. 2005, A&A, 434, 867
- Gardiner & Noguchi (1996) Gardiner, L. T., & Noguchi, M. 1996, MNRAS, 278, 191
- Girardi et al. (2000) Girardi, L., Bressan, A., Bertelli, G., & Chiosi, C. 2000, A&AS, 141, 371
- Gordon et al. (2003) Gordon, K. D., Clayton, G. C., Misselt, K. A., Landolt, A. U., & Wolff, M. J. 2003, ApJ, 594, 279
- Gordon et al. (2005) Gordon, K. D., et al. 2005, PASP, 117, 503
- Gorlova et al. (2004) Gorlova, N., et al. 2004, ApJS, 154, 448
- Gorlova et al. (2006) Gorlova, N., Rieke, G. H., Muzerolle, J., Stauffer, J. R., Siegler, N., Young, E. T., & Stansberry, J. H. 2006, ApJ, in press
- Greaves et al. (2006) Greaves, J. S., Fischer, D. A., & Wyatt, M. C. 2006, MNRAS, 366, 283
- Grebel et al. (1993) Grebel, E. K., Roberts, W. M. J., Will, J. M., & de Boer, K. S. 1993, Space Science Reviews, 66, 65
- Groenewegen & Blommaert (1998) Groenewegen, M. A. T., & Blommaert, J. A. D. L. 1998, A&A, 332, 25
- Henize (1956) Henize, K. G. 1956, ApJS, 2, 315
- Hilditch et al. (2005) Hilditch, R. W., Howarth, I. D., & Harries, T. J. 2005, MNRAS, 357, 304
- Hogg et al. (2005) Hogg, D. W., Tremonti, C. A., Blanton, M. R., Finkbeiner, D. P., Padmanabhan, N., Quintero, A. D., Schlegel, D. J., & Wherry, N. 2005, ApJ, 624, 162
- Keller & Wood (2006) Keller, S. C., & Wood, P. R. 2006, ApJ, in press (astro-ph/0601225)
- Hill (1997) Hill, V. 1997, A&A, 324, 435
- Hillenbrand et al. (1992) Hillenbrand, L. A., Strom, S. E., Vrba, F. J., & Keene, J. 1992, ApJ, 397, 613
- Jura et al. (2004) Jura, M., et al. 2004, ApJS, 154, 453
- Kennicutt et al. (1995) Kennicutt, R. C., Bresolin, F., Bomans, D. J., Bothun, G. D., & Thompson, I. B. 1995, AJ, 109, 594
- Lagrange et al. (2000) Lagrange, A.-M., Backman, D. E., & Artymowicz, P. 2000, in Protostars and Planets IV, ed. V. Mannings, A. P. Boss, & S. S. Russell (Tucson: Univ. Arizona Press), 639
- Lejeune & Schaerer (2001) Lejeune, T., & Schaerer, D. 2001, A&A, 366, 538
- Li & Draine (2002) Li, A., & Draine, B. T. 2002, ApJ, 576, 762
- Lisenfeld & Ferrara (1998) Lisenfeld, U., & Ferrara, A. 1998, ApJ, 496, 145
- Lonsdale et al. (2003) Lonsdale, C. J., et al. 2003, PASP, 115, 897
- van Loon et al. (1998) van Loon, J. T., et al. 1998, A&A, 329, 169
- van Loon (2006) van Loon, J. T. 2006, in “The 2005 Tartu workshop: Stellar Evolution at Low Metallicity: Mass Loss, Explosions, Cosmology”, eds. H.J.G.L.M. Lamers, N. Langer, T. Nugis and K. Annuk, ASP Conference Series, in press (astro-ph/0512326 )
- van Loon et al. (2006) van Loon, J. T., Marshall, J. R., Cohen, M., Matsuura, M., Wood, P. R., Yamamura, I., & Zijlstra, A. A. 2006, A&A, 447, 971
- van Loon (2005) van Loon, J. T. 2005, in “Stellar Evolution at Low Metallicity: Mass Loss, Explosions, Cosmology”, eds. H.J.G.L.M. Lamers, N. Langer, T. Nugis and K. Annuk (ASP Conference Series), in press (arXiv:astro-ph/0512326)
- Luck et al. (1998) Luck, R. E., Moffett, T. J., Barnes, T. G., & Gieren, W. P. 1998, AJ, 115, 605
- Madden et al. (2006) Madden, S. C., Galliano, F., Jones, A. P., & Sauvage, M. 2006, A&A, 446, 877
- Madden (2002) Madden, S. C. 2002, Ap&SS, 281, 247
- Maragoudaki et al. (2001) Maragoudaki, F., Kontizas, M., Morgan, D. H., Kontizas, E., Dapergolas, A., & Livanou, E. 2001, A&A, 379, 864
- Masci et al. (2005) Masci, F. J., Laher, R., Fang, F., Fowler, J., Lee, W., Stolovy, S., Padgett, D., & Moshir, M. 2005, in ASP Conf. Ser., Astronomical Data Analysis Software and Systems XIV, ed. P. L. Shopbell, M. C. Britton, & R. Ebert (San Francisco: ASP), in press (astro-ph/0411316)
- Massey et al. (1989) Massey, P., Parker, J. W., & Garmany, C. D. 1989, AJ, 98, 1305
- McConnachie et al. (2005) McConnachie, A. W., Irwin, M. J., Ferguson, A. M. N., Ibata, R. A., Lewis, G. F., & Tanvir, N. 2005, MNRAS, 356, 979
- Meixner et al. (2006) Meixner, M., et al. 2006, ApJ, in press (astro-ph/0606356)
- Meyssonnier & Azzopardi (1993) Meyssonnier, N., & Azzopardi, M. 1993, A&AS, 102, 451
- Miroshnichenko et al. (2003) Miroshnichenko, A. S., Levato, H., Bjorkman, K. S., & Grosso, M. 2003, A&A, 406, 673
- O’Halloran et al. (2006) O’Halloran, B., Satyapal, S., & Dudik, R. P. 2006, ApJ, 641, 795
- Patten et al. (2004) Patten, B. M, Hora, J. L., Fazio, G. G., Barmby, P., Wang, Z., & Makovoz, D. 2004, SPIE, 5487, 186
- Plante & Sauvage (2002) Plante, S., & Sauvage, M. 2002, AJ, 124, 1995
- Quijada et al. (2004) Quijada, M., Marx, C. T., Arendt, R. G., & Moseley, S. H. 2004, SPIE, 5487, 244
- Reach et al. (2000) Reach, W. T., Boulanger, F., Contursi, A., & Lequeux, J. 2000, A&A, 361, 895
- Reach et al. (2005) Reach, W. T., et al. 2005, PASP, 117, 978
- Rieke & Lebofsky (1985) Rieke, G. H., & Lebofsky, M. J. 1985, ApJ, 288, 618
- Rieke et al. (2004) Rieke, G. H., et al. 2004, ApJS, 154, 25
- Rieke et al. (2005) Rieke, G. H., et al. 2005, ApJ, 620, 1010
- Rubio et al. (2000) Rubio, M., Contursi, A., Lequeux, J., Probst, R., Barbá, R., Boulanger, F., Cesarsky, D., & Maoli, R. 2000, A&A, 359, 1139
- Russell & Bessell (1989) Russell, S. C., & Bessell, M. S. 1989, ApJS, 70, 865
- Sadakane et al. (2004) Sadakane, K., Arimoto, N., Ikuta, C., Aoki, W., Jablonka, P., & Tajitsu, A. 2004, PASJ, 56, 1041
- Sauvage et al. (1990) Sauvage, M., Vigroux, L., & Thuan, T. X. 1990, A&A, 237, 296
- Schlegel et al. (1998) Schlegel, D. J., Finkbeiner, D. P., & Davis, M. 1998, ApJ, 500, 525
- Schwering & Israel (1989) Schwering, P. B. W., & Israel, F. P. 1989, A&AS, 79, 79
- Shetrone et al. (2003) Shetrone, M., Venn, K. A., Tolstoy, E., Primas, F., Hill, V., & Kaufer, A. 2003, AJ, 125, 684
- Skrutskie et al. (2006) Skrutskie, M. F., et al. 2006, AJ, 131, 1163
- Sloan et al. (2004) Sloan, G. C., et al. 2004, ApJ, 614, L77
- Sloan et al. (2006) Sloan, G. C., Kraemer, K. E., Matsuura, M., Wood, P. R., Price, S. D., & Egan, M. P. 2006, ApJ, in press (arXiv:astro-ph/0603607)
- Stanimirović et al. (2000) Stanimirović, S., Staveley-Smith, L., van der Hulst, J. M., Bontekoe, T. R., Kester, D. J. M., & Jones, P. A. 2000, MNRAS, 315, 791
- Stanimirović et al. (2004) Stanimirović, S., Staveley-Smith, L., & Jones, P. A. 2004, ApJ, 604, 176
- Stanimirović et al. (2005) Stanimirović, S., Bolatto, A. D., Sandstrom, K., Leroy, A. K., Simon, J. D., Gaensler, B. M., Shah, R. Y., & Jackson, J. M. 2005, ApJ, 632, L103
- Stauffer et al. (2005) Stauffer, J. R., et al. 2005, AJ, 130, 1834
- Surace et al. (2004) Surace, J. A., et al. 2004, VizieR Online Data Catalog, 2255, 0
- Tolstoy et al. (2003) Tolstoy, E., Venn, K. A., Shetrone, M., Primas, F., Hill, V., Kaufer, A., & Szeifert, T. 2003, AJ, 125, 707
- Trams et al. (1999) Trams, N. R., et al. 1999, A&A, 346, 843
- Udalski et al. (1998) Udalski, A., Szymanski, M., Kubiak, M., Pietrzynski, G., Wozniak, P., & Zebrun, K. 1998, Acta Astronomica, 48, 147
- Uzpen et al. (2005) Uzpen, B., et al. 2005, ApJ, 629, 512
- Venn et al. (2004) Venn, K. A., Irwin, M., Shetrone, M. D., Tout, C. A., Hill, V., & Tolstoy, E. 2004, AJ, 128, 1177
- Venn (1999) Venn, K. A. 1999, ApJ, 518, 405
- Waters & Waelkens (1998) Waters, L. B. F. M., & Waelkens, C. 1998, ARA&A, 36, 233
- Weingartner & Draine (2001) Weingartner, J. C., & Draine, B. T. 2001, ApJ, 548, 296
- Werner et al. (1980) Werner, M. W., Beckwith, S., Gatley, I., Sellgren, K., Berriman, G., & Whiting, D. L. 1980, ApJ, 239, 540
- Whitney et al. (2003) Whitney, B. A., Wood, K., Bjorkman, J. E., & Cohen, M. 2003, ApJ, 598, 1079
- Wisniewski & Bjorkman (2006) Wisniewski, J. P., & Bjorkman, K. S. 2006, ApJ, in press (astro-ph/0606525)
- Wu et al. (2006) Wu, Y., Charmandaris, V., Hao, L., Brandl, B. R., Bernard-Salas, J., Spoon, H. W. W., & Houck, J. R. 2006, ApJ, 639, 157
- Wyrzykowski et al. (2004) Wyrzykowski, L., et al. 2004, Acta Astronomica, 54, 1
- Zaritsky et al. (2000) Zaritsky, D., Harris, J., Grebel, E. K., & Thompson, I. B. 2000, ApJ, 534, L53
- Zaritsky et al. (2002) Zaritsky D., Harris J., Thompson I.B., Grebel E.K., Massey P. 2002, AJ, 123, 855
![[Uncaptioned image]](/html/astro-ph/0608561/assets/x14.png)