Stellar archaeology: the evolving spectrum of FG Sge
Over an interval of 120 years, the extraordinary object FG Sge has been transformed from a hot post-AGB star to a very luminous cool supergiant. Theoretically, this evolution has been associated with the reignition of a helium-shell during the post-AGB stage. A series of studies of the chemical composition of the photosphere have suggested that this evolution has been associated with a dramatic increase of approximately 3 dex in the abundances of s-process elements between about 1960 and 1995. The problem with this apparent change is that it occurred at a time when the surface convection zone, which is governed by the star’s effective temperature, could not have developed sufficiently to dredge processed material from the stellar interior to the surface. We have reviewed the chemical evolution of FG Sge by means of modelling the time-varying spectrum under a range of assumptions. By comparing these models with published observational data, a self-consistent picture has emerged. In particular we find that surface hydrogen has been depleted during the interval in question. In contrast, the s-process abundances have generally maintained a steady enhancement of around dex, although some modest changes may have occurred since 1950. This implies that FG Sge has not just completed dredging up freshly-produced s-process isotopes. However, there remains a contradiction between the observed hydrogen-depletion, the age of the associated planetary nebula, and current evolutionary models for a pre-white dwarf suffering a late thermal pulse.
Key Words.:
stars: fundamental parameters – stars: abundances – stars: evolution – stars: individual (FG Sge)1 Introduction
During the last century, FG Sagittae evolved from a hot central star of a planetary nebulae to become an F-type supergiant within approximately 90 years. Only two comparable objects are known; V4334 Sgr (Sakurai’s object) covered a similar evolution in approximately five years to become, in 1999, a C-type giant smothered by its own dust shell (Duerbeck et al. Due02 (2002)), and V605 Aql which, after a brief foray into the giant domain during the 1920’s, returned to the high-temperature régime as a typical [WC]-type planetary nebula central star (Clayton & de Marco Cla97 (1997)). The rarity and brevity of such events arising from a cataclysm in the final evolution of low-mass stars is such that they are of profound interest.
For these reasons, every observation of these stars is important, not so much for their contemporary significance, but for their contribution to retrospective studies of evolutionary episodes which, even for such astronomically rapid events, may last longer than most scientists’ careers. In particular, the development of increasingly sophisticated analytical methods render the original data of primary importance in any historical interpretation.
The generally accepted interpretation for the redward evolution of FG Sge is that of a late thermal pulse in a young white dwarf or planetary nebula central star (Paczynski Pac71 (1971); Langer, Kraft & Anderson Lan74 (1974); Sackmann & Despain Sac74 (1974); Schönberner Sch79 (1979); Iben Ibe84 (1984); Blöcker & Schönberner Blo97 (1997); Gonzalez et al. Gon98 (1998); Lawlor & MacDonald Law03 (2003)) wherein nuclear helium-burning at the surface of the electron-degenerate carbon-oxygen core is reignited. Detailed models for these late thermal pulses have been generated by several investigators (cf. Schönberner Sch79 (1979); Iben Ibe84 (1984); Blöcker Blo95 (1995)), but the main features are principally the same. The energy released by the helium-shell flash forces the outer layers to expand in about 50 to a few 100 years, depending on their mass. Hydrogen-rich, helium-rich and carbon-rich material is mixed by convective overshoot from the helium-shell flash, but the surface of the star retains its pre-pulse composition. A major component of this mixed region will be a supply of newly-produced s-process elements generated by the mixing of and protons. As the star expands, its surface cools allowing surface convection to occur. As the temperature bottoms-out, the convection zone digs deeper, dredging processed material to the stellar surface.
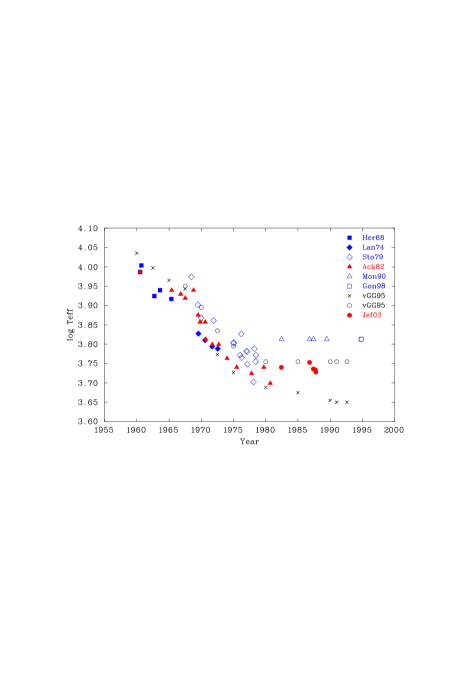
The evolution of FG Sge in terms of effective temperature ( Teff) and luminosity () has been established from long-term photometric studies (van Genderen & Gautschy vGG95 (1995)). These data appear to support the late thermal pulse hypothesis (Blöcker & Schönberner Blo97 (1997); Herwig 2001a ; Lawlor & MacDonald Law03 (2003)). Further evidence is the apparent enhancement of s-process elements in the photosphere of FG Sge (Langer et al. Lan74 (1974)) as Teff dropped below 8 500 K, almost exactly the point where surface convection is expected to develop (cf. van Genderen & Gautschy vGG95 (1995)). The dilemma, in simple terms, is that the theoretical models for late thermal pulse evolution do not predict the dredge-up of s-processed material to the surface until some considerable time after the star has reached its minimum effective temperature. Moreover, the dredge-up should also be associated with a significant change in the abundances of hydrogen, helium, carbon and oxygen. Iben (Ibe84 (1984)) remarks that “The heretical conclusion to which one appears to be forced is that FG Sge has not just completed dredging up freshly produced s-process isotopes. If this is so, then the fault must lie in the estimates of surface abundances.”
Consequently, either the theoretical predictions or the observations concerning the surface abundance of late thermal pulse products is wrong, or FG Sge is not a late thermal pulse product.
More recently, a variant of the late thermal pulse phenomenon has been identified (Herwig et al. Her99 (1999))111In fact, both classes of thermal pulse were previously encountered, but not explicitly labelled, by Schönberner (Sch79 (1979)). . The “late thermal pulse” (LTP) model introduced above does qualitatively well in reproducing the hydrogen-deficiency and high carbon abundances seen in hydrogen-deficient planetary nebulae central stars, but fails to reproduce the large oxygen abundances found therein. Herwig et al. (Her99 (1999)) found, however, that a “very late thermal pulse” (VLTP), occurring after the H-burning shell has become inactive, was able to produce a surface abudance pattern in good general agreement with that observed in the hydrogen-deficient post-AGB stars, primarily because he considered convective overshoot. The two models are different in one major respect. In the first, the convection zone produced in the He-rich shell at He ignition cannot extend into the hydrogen-rich envelope (Iben Ibe76 (1984)). In the second, this convection zone is able to penetrate into the H-rich surface layers and transport protons downwards (Herwig et al. Her99 (1999)). What is not immediately apparent from the published figures, although it is stated in the text, is that the nuclear-driven convection zones are able to propagate through to the surface before the star cools sufficiently to develop a deep opacity-driven convection layer at its surface. This means that in the VLTP model, the disappearance of surface hydrogen and the appearance of highly-processed material can occur quickly and while the effective temperature is still significantly high.
Another major difference between the LTP and VLTP models is that the latter occurs on a much shorter timescale than the former. A VLTP occurs when the envelope mass is close to . Since the nuclear energy produced by protons ingested into the intershell region is enormous ( erg in less than a week), expansion following a VLTP occurs on the very small thermal timescale ( y) of the tiny hydrogen-rich envelope (Herwig et al. Her97 (1997)). In contrast, a LTP occurs when the envelope mass is also , but of hydrogen-free intershell must also be lifted, there is no proton-ingestion, and the expansion energy comes from the He-shell flash alone. Consequently the expansion occurs on a much longer timescale ( y).
The VLTP model is therefore important for understanding the observed abundance evolution of FG Sge and V4334 Sgr (Gonzalez et al. Gon98 (1998), Asplund et al. Asp97 (1997)). For example, it has been stated by several authors that, because of their respective evolution timescales, FG Sge and V4334 Sgr are examples of LTP and VLTP evolution respectively (cf. Herwig 2001a ).
It is the intent of this investigation to determine whether observation can indeed be reconciled with theory, and whether FG Sge has suffered either a “late” or a “very late” thermal pulse. The next sections give a more detailed discussion of specific observations, followed by a presentation of the model atmospheres and spectra used and our subsequent analysis. It considers in more detail ideas introduced by Schönberner & Jeffery (2003).
The literature on FG Sge is extensive, there are currently over 394 citations in the simbad database between 1960 and the present (2006 July)222There is only one citation in SIMBAD from before 1960: Hoffmeister’s (Hof44 (1944)) list of 171 new variables.. It would be impossible and inappropriate to survey critically every one of these articles, but inadvertent omissions of material that others might consider seminal will no doubt have been made. However we recognise the contribution of all of these publications, and hence our prefatory remarks on the importance of primary data. These derive from the fact that much early spectroscopic material is no longer accessible to us. Consequently, any conclusions which run contrary to the original authors’ are legitimately disputable. On the other hand, if it can be shown that a self-consistent picture of FG Sge could be realised by a reassessment of these data, this paper will have achieved its goal.

2 The expansion of FG Sge
The evolution track derived from optical photometry and pulsation analysis (van Genderen & Gautschy vGG95 (1995), Fig. 1) is adopted as a principal benchmark. These authors actually give two evolution tracks, with low and high temperature scales respectively. We have adopted the high scale for reasons which will become clear later, although van Genderen & Gautschy (1995) prefer the low scale. Underlying this is the basic assumption that over a long timescale and in the absence of major events affecting the internal structure of the star, the evolution track will be smooth (Fig. 1). Superimposed on the evolution are short-term pulsational changes (, ), which will perturb instantaneous measurements of Teff and . Other authors (Montesinos et al. Mon90 (1990), Gonzalez et al. Gon98 (1998)) argue that the adopted calibration is unreliable because of line-blanketing in the optical by enhanced s-process elements. This does not apply to observations before approximately 1970, when the first s-process episode was claimed (Langer et al. Lan74 (1974)). In this paper we investigate the influence of s-process element enhancements on the calibration.
It is also useful to check broad-band photometric measurements of Teff against other methods. Spectrophotometry and spectroscopy have both been used to measure Teff for FG Sge over the last forty years.
Spectrophotometry of FG Sge covering the decade 1968–1978 was calibrated against a sequence of MK standard supergiants (Stone Sto79 (1979)). Only wavelengths Å were used in an effort to avoid the effect of blanketing by s-process elements. The effective temperatures inferred were higher than those derived spectroscopically (Langer et al. Lan74 (1974), Fig. 2). The systematic difference could be due to non-LTE effects in the atmosphere or, more likely in the present authors’ view, to the influence of rare-earth metal lines on the red spectrum. These would have different consequences for the two methods of temperature measurement. However the measured cooling rate (310 K yr-1) agreed with contemporary measurements (Smolinski, Climenhaga & Kipper Smo76 (1976)). This rate appeared to reduce later to K yr-1 (Cohen & Phillips Coh80 (1980)).
We note that the spectroscopic measurements of effective temperature Teff do not always agree well with measurements of the ionization temperature measured from the same data (Langer et al. Lan74 (1974)) but are in satisfactory agreement with independent contemporary analyses (Chalonge, Divan & Mirzoyan Cha77 (1977)).
Spectral type alone can be a useful measure of Teff if the calibration (e.g. Johnson Joh66 (1966)) is reliable, and gives results (Acker, Jaschek & Gleizes Ack82 (1982)) that agree very well with the photometric calibration (Fig. 2). It is important to note that the lowest temperatures are given for the interval 1975–1981. The authors are not aware of any subsequent spectroscopic measurement of Teff that gives a value below 6 000 K.
The addition of ultraviolet and infrared photometry during the 1980’s provided more data with which to measure Teff using the total flux method. However the intrinsic short-term variability of FG Sge made simultaneous UV, visual and IR photometry difficult to achieve. The problem is most apparent in the infrared, where a 115 d intrinsic variation (Arkhipova Ark93 (1993)) was shown to be due to a 1300 K fluctuation in Teff and a factor two change in luminosity (Taranova Tar87 (1987)).
The only study to exploit the IUE data (Montesinos et al. Mon90 (1990)) used a simple comparison with standard model atmospheres (Kurucz Kur79 (1979)) to provide estimates of Teff, concluding that K and in the interval 1982–1989. These authors also conclude that the previous expansion had stopped sometime in the early 1980’s and that a possible rise in temperature had occurred. The questions raised by this study concern the appropriateness of the model atmospheres used, the influence of variability on the comparison of non-contemporary data and – as was to become clearer in the 1990’s – the development of a dust shell masking the photosphere.
Subsequently, colours in 1991–1993 were reported to be consistent with spectral type Gp, while the line spectrum remained essentially the same as in 1983 (Stone, Kraft & Prossner Sto93 (1993)). 1992 August marked the beginning of a new phase in the evolution of FG Sge (Papousek Pap92 (1992)) in which it has shown a series of deep obscurational minima reminiscent of an R CrB-type light curve (Royer Roy99 (1999)). The clouds of dust formed during these events have substantially transformed every subsequent observation of the underlying star, so that it has been difficult to follow any further evolution in, for example, Teff or intrinsic brightness.
Several authors have employed the intrinsic variability or pulsations of FG Sge as a proxy for Teff. The principle is that linear pulsation models provide a relation between mass, period, luminosity and temperature. Assuming that the star evolves at constant luminosity (and mass), then a pulsation period gives Teff. However, the difficulty of establishing reliable periods and the necessary assumptions regarding mass and luminosity suggest these estimates should be used with caution.
3 The chemical evolution of FG Sge
The expansion of FG Sge has naturally caused huge changes in its spectrum. It has been argued that these are not purely due to changes in Teff alone, but that there have been concomitant changes in the chemical composition of the photosphere. The most significant studies are reviewed here. It is appropriate to note that each study considers a different epoch, using a different observational dataset. Of equal note, each study approaches the abundance analysis using a different method with different underlying assumptions. The dangers of simply concatenating such a series of results must be self-evident. Attention is drawn to some of the major inconsistencies.
3.1 Herbig & Boyarchuk Her68 (1968)
The first data to permit a view of the chemical evolution of FG Sge was provided by Coudé spectrograms obtained at the Lick Observatory between 1960 and 1972 (Herbig & Boyarchuk Her68 (1968); Langer et al. Lan74 (1974)), together with some earlier low-dispersion plates from 1955. The dramatic spectral evolution from B4 I to A5 Ia was initially interpreted as an expanding surface, or false photosphere, above an invisible central star (Herbig & Boyarchuk Her68 (1968)). However, it is the extensive tables of equivalent widths published by these authors that provide the most valuable and accessible data from which to reassess the history of FG Sge. These include data from absorption lines between 3300 and 4930 Å, including those due to hydrogen and neutral helium, light elements and iron-group ions.
These equivalent widths were used by Herbig & Boyarchuk (Her68 (1968)) in a
curve-of-growth analysis to measure abundances of 20 species from
hydrogen up to europium. The results were tabulated relative to
$α$ Cyg, after normalising all abundances so that
the mean combined abundance of Si, Ti, Cr and Fe was the same for both
FG Sge and $α$ Cyg (see appendix A).
The following points are interesting:
i) The absence of He i lines from 1962 onwards places limits on
Teff and helium abundance;
ii) a probable excess of carbon (+0.7 dex) in most spectra;
iii) a 0.5 dex overabundance of oxygen;
iv) an apparent excess of cobalt and strontium (+0.8 dex) at
all epochs;
v) nearly all other elements are overabundant by 0.2 to 0.3 dex.
Assuming that the differential abundance measurements are relatively
secure, a modern abundance analysis of
$α$ Cyg can be used (e.g. Albayrak Alb00 (2000)) to compute
absolute abundances (see Appendix A).
After correcting for substantial differences between
$α$ Cyg and the Sun, we could further conclude:
i) carbon is overabundant by 1 dex,
ii) helium, nitrogen – iron and nickel are near-normal, and
iii) cobalt, strontium, zirconium, barium and europium are
overabundant by from +0.7 (cobalt) to +2.1 dex (strontium).
It is significant that large overabundances in heavy elements, particularly cobalt and strontium, are evident from 1960 onwards. We should, however, be cautious in evaluating these data: measurement errors were not given, and the curve-of-growth method has limitations. However, the equivalent widths themselves are invaluable as they permit further analysis using modern model-atmosphere techniques.
3.2 Langer, Kraft & Anderson Lan74 (1974)
As the star continued to evolve, it began to show abnormally
strong lines of Y ii, Zr ii, Ce ii, La ii
and other s-process species sometime after 1967 (Langer et al. Lan74 (1974)).
Apparent abundances rose to some 25 times (+1.4 dex) the solar value.
Commencing with a reanalysis of the final
spectrum used by Herbig & Boyarchuk (Her68 (1968)), the most interesting
results are:
i) a drop to near-normal carbon abundance (low weight).
ii) steady Ti, Cr and Fe abundances.
iii) significant increases in Y and Zr.
iv) the appearance of La, Ce, Pr, Nd and Sm with +0.9 …+1.5
dex overabundances.
It is difficult, however, to reproduce these values as the crucial equivalent widths have not been published, and only a photographic reproduction of the coudé spectra in a small region of the spectrum is accessible to us333The authors have contacted two coauthors of Langer et al. (Kraft and Anderson) and the principal author of Cohen & Phillips (Coh80 (1980)), who also had access to these data. Detailed records of the original work can no longer be located. Although the original plates should still be in the Lick plate archive, their extraction and analysis lie beyond our current resources. . Taken together, these two papers (Herbig & Boyarchuk Her68 (1968); Langer et al. Lan74 (1974)) pose a number of significant questions:
i) What has happened to the carbon abundance in FG Sge? It appeared to start high and then fall. However, if dredge-up of s-process elements occurred during this epoch, then carbon should also have been enriched. This may not be a severe observational constraint; the early carbon abundances were “based on one or two very high excitation Ci lines in an uncertain atmosphere with eV, so the Boltzmann factor would be pretty sizeable, and the results pretty uncertain” (Kraft, private communication). Since the carbon abundance derived by Langer et al. (1974) is also quite uncertain, the case of the carbon abundance as based on these two investigations remains unsettled.
ii) Is FG Sge hydrogen-deficient and when did it become so? Is there any corollary with, say, V4334 Sgr, claimed to show a similar transition to hydrogen-deficiency during its redward evolution (Asplund et al. Asp97 (1997))? Deep envelope mixing and the enrichment of s-process material should be dominated by the dredge-up of helium and dilution of surface hydrogen. This is a very important question. A low hydrogen abundance would be difficult to detect after 1960, yet it would have a dramatic effect on the structure of the atmosphere and the strengths of many lines in the spectrum.
iii) Has FG Sge been s-process rich all the time? Are early enhancements in Co and Sr symptomatic of a general s-process enhancement that was simply not recognised until the photosphere cooled sufficiently for ions with lower ionization potentials to become visible?
iv) How would the adopted model atmosphere affect, for example, measurements of the change of abundance with effective temperature? In the domain of interest, a very small drop in Teff produces a very sharp increase in for the second ions of rare-earth elements. Would additional opacity from carbon, or reduced opacity from hydrogen depletion be sufficient to cause a significant change in the original conclusions?
3.3 Cohen & Phillips Coh80 (1980)
Cohen & Phillips (Coh80 (1980)) continued the work of Langer et al. (Lan74 (1974)) using 4-m echelle spectra obtained each year from 1975 to 1978. They introduced a ratio technique to deduce Teff and chemical abundances from each spectrum. No lines with mÅ changed by more than 40% during this epoch. They also found for strong lines that , with rather than the anticipated 0.50. Whether this is a consequence of the low surface gravity or of the composition of the photosphere remains to be verified. The authors’ inference from the upper limit to changes in was that, in the absence of any cooling, the abundances of all elements with strong lines, including the rare earths, did not increase by more than 0.50 dex over the 3 yr time span. Any cooling would reduce this maximum abundance change. One comment is notable; “These models … predict for solar abundances of the non--process elements (believed to be valid for at least the even iron-peak elements in FG Sge) values of smaller than those observed in the spectra.” The authors suggest that this is due to the extended nature of the atmosphere. It is also the classic symptom of an atmosphere with a lower than usual continuum opacity as would be occasioned, for instance, by a low hydrogen abundance. If it is not an abundance effect, the cause should have the same consequence for all lines, including the -process elements, accounting for some, if not all, of their apparent overabundance. Unfortunately, due to severe line crowding in the blue, the spectra used in this study were obtained longward of 5000Å so that the only Balmer line observed was H.
3.4 Acker, Jaschek & Gleizes Ack82 (1982), Cowley, Jaschek & Acker Cow85 (1985)
Following the work at Lick Observatory, the spectrum of FG Sge during 1979 – 1980 suggested a remarkable new phenomenon. In addition to the increase in s-process elements (barium and the lanthanides), the abundances of iron-group elements were significantly reduced (Acker et al. Ack82 (1982); Cowley et al. Cow85 (1985)).
3.5 Kipper & Kipper Kip93 (1993), Kipper & Klochkova kip.klo01 (2001)
As well as abundance estimates for magnesium, four iron-peak elements and 13 rare-earth elements, Kipper & Kipper (Kip93 (1993)) report the detection of C2 in 1992. The deduced abundance of carbon is dependent entirely on the assumed Teff (and presumably on the assumed hydrogen abundance) but appears to be enhanced, lying in the range , where represents the fractional abundance (by number of atoms) relative to the total of all elements. Consequently, carbon is considered to have increased along with or after the -process elements. These authors used in their analysis.
High-resolution spectra taken in 2000 and analysed with the same model atmosphere () gave essentially the same results (Kipper & Klochkova kip.klo01 (2001)). The oxygen abundance, based on one single [O i] line, resulted in . Note that the model parameters imply (solar units).
Although a hydrogen-deficiency was not reported in either study, it should be noted that the abundances deduced are likely to be substantially smaller if hydrogen is significantly depleted.
3.6 Gonzalez et al. Gon98 (1998)
Gonzalez et al. (Gon98 (1998)) obtained modern high-resolution high S/N spectra between 1992 and 1996. Their fine analysis considered primarily a spectrum obtained in 1994. From Fe i and Fe ii lines they deduced , , (Fig. 3) and a 3 dex enhancement of s-process elements. About 1 dex of this enhancement must have occurred between 1992 and 1994 (Kipper & Kipper Kip93 (1993)).
As with the photometric analysis of Montesinos et al. (Mon90 (1990)), the difficulty posed by this analysis is that it requires the star to have both heated – possibly as it returns towards higher temperatures – and – to yield the measured surface gravity – shrunk in radius by a factor of since the observations reported by Acker et al. (Ack82 (1982)). Such a change would have produced a dex reduction in luminosity, but no concomitant change in (4 magnitudes) was observed over this interval.
It is therefore puzzling that emphasis should have been given to the 3 dex abundance change, but not to the radius change. The effective temperature and abundance measurements are not unaffected by this contradiction, since both depend on the surface gravity and model atmosphere adopted. Reviewing our own work on atmospheric fine analyses we find that, in general, lower surface gravities give lower effective temperatures for the same ionization or excitation equilibrium with . Reducing the Gonzalez et al. (Gon98 (1998)) surface gravity by the requisite amount to give yields K.
Secondly, if the abundances are as far from normal as these authors suggest, the implications of reduced hydrogen opacity and increased metal opacity will be extreme, as Gonzalez et al. (Gon98 (1998)) were aware. The structure of the adopted ATLAS9 model atmospheres with normal hydrogen and metal abundances would have been quite inappropriate for modelling the spectrum of such a peculiar star. With few reliable temperature indicators available to Gonzalez et al. (Gon98 (1998)), one wonders if the starting premise that the Montesinos et al. (Mon90 (1990)) results were ”probably the most accurate published temperature estimates since the early 1970’s” was unfortunate.
However, even if both effective temperature and surface gravity are wrong, the abundance measurements may not be so badly in error. If they are not, then FG Sge will have taught us something important about the late stages of stellar evolution. It is therefore both legitimate and necessary to make a thorough reappraisal of the chemical evolution of FG Sge, including those measurements made with the most modern equipment and methods.
4 Model atmospheres and synthetic spectra
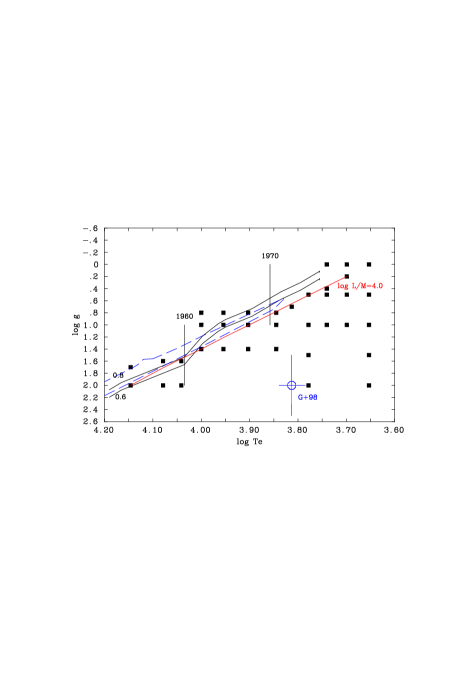
In order to interpret the evolving spectrum of FG Sge it is necessary to simulate the emergent radiation observed through its history under a range of assumptions. The principal constraint on these is the evolutionary track derived from optical colours and pulsation periods (van Genderen & Gautschy vGG95 (1995)). This track is shown in Fig. 3, assuming masses of 0.6 and 0.8 , respectively.
It will be seen that these tracks lie close to the classical Eddington limit and that obtaining suitable model atmospheres is not trivial. In the current era, the strong radiation field and extended atmospheres generally encountered in A-type supergiants would be considered to require a treatment of the failure of local thermodynamic equilibrium (LTE) and the curvature of the stellar photosphere, in addition to a luminosity-related stellar wind. However, in the present case, the quality of the available data are insufficient to warrant such effort so that the adoption of line-blanketed plane parallel model atmospheres in LTE may be considered a satisfactory approximation.
The program sterne (Schönberner & Wolf Sch74 (1974); Jeffery, Woolf & Pollacco Jef01 (2001)) can compute low-gravity model atmospheres over a wide range of Teff and chemical composition. Its use provides control over the assumed physics and allows us to monitor the convergence of each model atmosphere. We note that the current opacity distribution functions are incomplete, being based on the Kurucz & Peytremann (Kur75 (1975)) line list, and that the contribution of molecules to the equation of state and opacity in low Teff atmospheres is not considered. Since the calculations we make are largely comparative, the fact that they are used consistently to discuss all of the data for FG Sge across a large range in Teff far outweighs these limitations.
Model atmospheres were computed assuming a standard (solar) mix of elements heavier than helium. Three grids were computed assuming number abundances of hydrogen and helium and (0.01,0.99), which we have labelled hydrogen-normal, hydrogen-poor and hydrogen-deficient, respectively. The goal was to obtain a sequence of models with , close to the observed value and spanning the range in Teff exhibited by FG Sge since 1960. The grid computed (although not every model) is illustrated in terms of Teff and log in Fig. 3. We note that FG Sge’s luminosity-to-mass ratio may even be larger than the one assumed here.
Within each of these model grids, the composition of the heavy element component assumed in the calculation of the equation of state and the continuous (bound-free) opacity was (by number fraction relative to the total) : C:0.000363, N:0.000112, O:0.000832, Mg:0.0000339, Al:0.00000269, Si:0.0000316, S:0.0000158, Ca:0.00000229, and Fe:0.0000288, these being the standard solar abundances of these elements at the time they were adopted into sterne. The abundance of the most abundant element (H or He) was reduced by the total of these to ensure a total number density of unity. A complete review of the opacity sources used in sterne has been given recently by Behara & Jeffery (Beh06 (2006)). The abundances used in the calculation of the line-opacity were those hard-wired into the opacity distribution functions (ODFs) - being the Kurucz (Kur70 (1970)) ATLAS6 “p00” ODF for the hydrogen-rich grids and the Möller (Moe90 (1990)) “he90” ODF for the helium-rich grids.
Attempts to compute corresponding models using Kurucz’ program atlas9 (Kurucz Kur91 (1991)) were not so successful. These generally failed at very low gravities due to negative pressures in the equation of state, although we note that Lamers & Fitzpatrick (Lam88 (1988)) had computed much lower gravity models using an older version of atlas (Kurucz Kur79 (1979)), achieving rather than 2.0 at .
Using model atmospheres from sterne, the formal solution program spectrum (Jeffery et al. Jef01 (2001)) permits the computation of synthetic spectra (in LTE) over large wavelength intervals, the computation of individual line profiles and curves of growth and the computation of elemental line abundances for given equivalent widths.
A database for transitions of light elements in hot stars is maintained by one of us (LTE_LINES, Jeffery et al. Jef01 (2001)). For the present study, substantially more extensive data for iron-group and heavier atoms are required. The iron-group data have been collated from the extensive line lists of Kurucz (KurCD01 (1994)), providing a total of over 144 500 metallic absorption lines with wavelengths between 2900 and 8000 Å. For s-process elements, data for over 11 500 lines have been recovered from the Vienna Atomic Line Database (Piskunov et al. VALD1 (1995); Kupka et al. VALD2 (1999)). Since this represents only a subset of the s-process element lines observed in FG Sge, the effects of these elements will be underestimated.
5 Key questions
This section starts to address some of the key questions raised in the previous discussion. For example:
-
•
Why are there such substantial discrepancies in the Teff scales?
-
•
What was the evolution of the hydrogen abundance?
-
•
Is there any evidence of carbon enrichment ?
-
•
Did s-process enhancement ever really occur?
5.1 Are colour indices sensitive to composition?
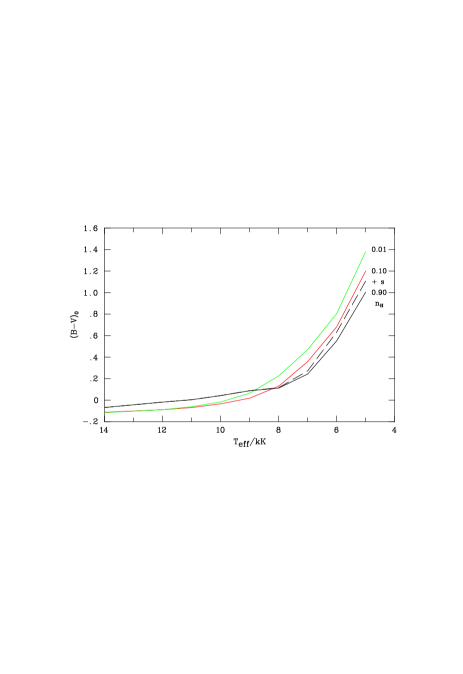
The sterne model atmospheres include a calculation of the emergent spectrum sampled at 342 wavelengths from the X-ray to the infrared, with sampling approximately every 20 Å in the UV and visible. A consequence immediately apparent is that for , the hydrogen-deficient models are substantially redder, in the optical region, than the hydrogen-normal models.
These flux distributions have been augmented by computing detailed synthetic spectra with spectrum using the linelists described above and 200,000 frequency points between 2900 and 8000 Å. These were convolved with appropriate detector response and filter transmission functions to compute theoretical intrinsic colour indices and . for models with both normal and modified abundances. In addition to the variations in hydrogen abundances, we also computed colours for a models in which the abundances of s-process elements strontium, yttrium, zirconium, barium, lanthanum, cerium, praseodymium, neodymium. samarium, europium, terbium, dysprosium, erbium, ytterbium, lutetium, hafnium, and lead were enhanced by two dex. Most of these have been reported at some time to be strongly overabundant in FG Sge.
The results for are shown in Fig. 4 which confirms that the cooler hydrogen-deficient models may be redder at a given temperature than their hydrogen-rich counterparts. This is a direct consequence of the much lower continuum opacities in the hydrogen-poor models. Strong metal line blanketing due to singly-ionized iron-group elements in the near-UV coincides with the peak of the Planck function and has a much stronger effect than in the hydrogen-rich model atmospheres – the ratio of line to continuous opacity is the crucial quantity. The increase in metal-line blanketing is partially compounded in the hotter models by a reduction in the contribution from the high-order Balmer series and Balmer continuum. One implication is that, for observations of FG Sge, the assumption of a normal hydrogen abundance could lead to an underestimate of Teff by as much as for .
The original object of this experiment was to check the effect of enhanced s-process element abundances on the colour– Teff calibration. Although only a subset of all s-process lines was included, Fig. 4 shows that these effects are probably not severe, contrary to the assertion by Montesinos et al. Mon90 (1990). They produce much smaller changes in than caused by changes in the hydrogen abundance. Therefore, if the hydrogen abundance is normal, the existing calibration (van Genderen & Gautschy vGG95 (1995)) should be acceptable.
5.2 Can photometry solve the hydrogen problem?
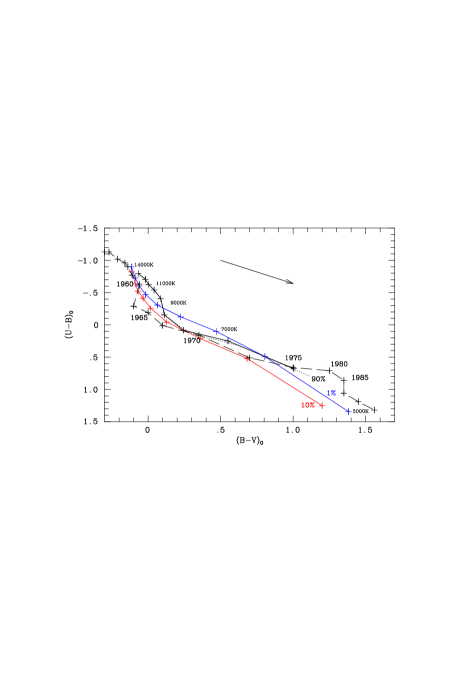
Taking the previous discussion one step further, it is interesting to ask whether photometry alone can constrain the chemical evolution of FG Sge. It has been shown that the Teff scale depends on the actual hydrogen abundance. For early-type stars, the Balmer continuum dominates the position of a star in the two-colour diagram. Figure 5 compares the locus of hydrogen-rich, poor and deficient model sequences with the evolutionary track of FG Sge.
While reducing the hydrogen from near-normal to reddens the evolutionary track in , as discussed above, the concomitant reduction in the Balmer continuum makes the tracks in the two-colour diagram distinguishable only in selected temperature and abundance domains.
The only clear conclusion is that, assuming a standard extinction law, FG Sge has been too red for a normal composition since at least 1975. However, since the star has been losing mass, its continued reddening may have as much to do with nonstandard extinction as with changing composition.
5.3 How robust is the photometric calibration?
If Teff is inferred from alone, one has to compute assuming some value for the reddening . Most authors have adopted , apparently following Herbig & Boyarchuk (Her68 (1968)) who compared observed colours with those expected for the current spectral type. While these authors also reported an unusual value for rather than the more usual value between 0.7 and 0.8, there have been no other suggestions of anomalous extinction before 1990, when dust-ejection episodes became frequent. It will be seen that adopting is quite consistent with the optical/UV flux distribution in the 1980’s and discussed in Section 5.7.


5.4 Was the composition of FG Sge unusual before 1965?
The first step toward determining whether a substantial change in surface composition actually occurred is to establish a zero point. Specifically, was already FG Sge depleted in hydrogen or rich in carbon or s-process elements in 1960–1965?
Since Herbig & Boyarchuk (1968) provide equivalent width measurements for over 300 lines and five different spectrograms, it is possible to assess this question quantitatively. Rather than attempt a detailed reanalysis of each spectrum, it is preferable to establish what systematic effects can be established.
We have computed predicted equivalent widths for 278 of the lines measured by Herbig & Boyarchuk (Her68 (1968)) for model atmospheres with in the range K and with hydrogen compositions of 90%, 10% and 1% by number. The abundances of all species other than hydrogen and helium were assumed to be solar. We also computed a set of equivalent widths for the 90% hydrogen models in which all species other than hydrogen and helium were enhanced by a factor of ten. Microturbulent velocities and 10 were used. In Figs. 6 and 7, the equivalent widths for selected lines are plotted as a function of temperature, with . The observed equivalent widths for each line are also plotted, assuming Teff given by the photometric calibration (van Genderen & Gautschy vGG95 (1995), Fig. 1). The maximum uncertainty in Teff is K. In particular, these figures demonstrate how sensitive different lines are to changes in Teff, hydrogen abundance and the elemental abundance.
A recurring question through the following analyses is that of the microturbulent velocity. The appropriate value to choose for this artificial factor is related to Teff and log (Gray, Graham & Hoyt Gray01 (2001)), and also to the specific ion in question (Albayrak Alb00 (2000)). To constrain in a problem where the number of degrees of freedom is comparable with the quantity of available data, we have chosen to be either 5 or 10 according to which gives the most conservative interpretation. In practice, this meant using when FG Sge was an early A star, and subsequently.
A number of strong conclusions concerning the following elements in FG Sge in 1960–1965 may be drawn:
-
•
He is normal.
-
•
C and O are not detectably different from normal, but C/O cannot be excluded.
-
•
Sr is significantly above normal ().
-
•
Y and Zr are not significantly different from normal.
Weaker conclusions include the following:
-
•
Mg, Si, and Ca are not well determined at these temperatures.
-
•
Sc and Ti appear normal.
-
•
Mn, Fe, Co and Ni may be somewhat underabundant.
-
•
Ba and Eu are significantly above normal (, one absorption line only for each species.
These conclusions are in line with the differential measurements given by Herbig & Boyarchuk (Her68 (1968)) if the abundance differences between Cyg and the Sun are also taken into account.
5.5 Was there an s-process enhancement episode around 1965–1970?
If some s-process elements were already enhanced in the interval 1960–1965, what is the significance of the dramatic increase reported between 1965 and 1970 (Langer et al. Lan74 (1974))? The evidence rests on a reanalysis of the plate obtained in 1965 by Herbig & Boyarchuk (1968) in which both light and heavy s-process elements are reported to be low. It is appropriate to note the remark by Langer et al. that “In a first reconnaissance of the abundance changes …, rather crude methods seem entirely appropriate …”. The 1965 spectrum only contains one line of barium amongst the heavy elements considered to be normal in 1965 by Langer et al.
We have already found this line and one due to europium to be stronger than expected. Whilst we find that yttrium and zirconium are not detectably different from normal in 1965, we do find another light s-process element, strontium, to be about 1 dex overabundant in 1965, before the apparent enhancement episode began.
We have considered the question from two angles. First, we have calculated theoretical equivalent widths of several lines for the given s-process abundances and Teff. By deducing what Teff or would be required if the abundances were to be normal and yield the same equivalent widths, we conclude that it would have been be impossible to confuse an s-process overabundance with a systematic error in Teff or a significant difference in between FG Sge and the comparison stars Per and Cyg.
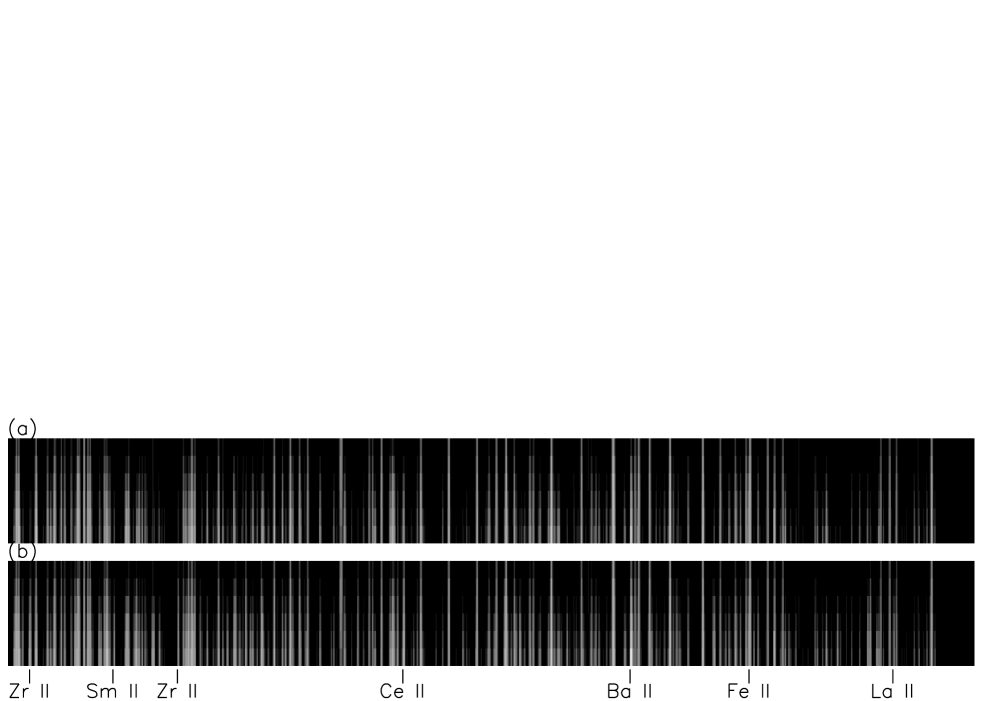
Second, we have attempted to reconstruct the photographic spectra presented by Langer et al. (Lan74 (1974)) in Fig. 8. The logarithmic greyscale images represent the region 4398 to 4640 Å, degraded to an instrumental resolution of 0.25 Å judged to correspond approximately to 8 Å mm-1 dispersion plates. Spectra were computed for Teff from 8 000 K to 5 500 K in steps of 500 K, for two chemical mixtures, one with solar abundances and one with abundances reported for 1972 August (Langer et al. Lan74 (1974), Table 1), and for and . Those with are shown in Fig. 8. The temperature sequence includes spectral classes from A8 I to G0 I, bracketing the Langer et al. range F0 I to F6 I. The progressive enhancement with falling Teff of lines due to s-process elements compared with lines of iron-peak elements is evident, and confirms that s-process elements were overabundant.
From the limited data available, we draw the following conclusions for the interval 1965–1972.
-
•
the Langer et al. results are broadly reliable.
-
•
abundances of light and iron-group elements are near normal.
-
•
Y and Zr are dex overabundant and had apparently increased after 1965. Note that Sr had been dex overabundant before 1965, but was not measured subsequently.
-
•
Ba, La, Ce, Pr, Nd and Sm are dex overabundant; only Ba had been measured previously when it was also dex overabundant.
The Y and Zr abundances are a mystery. Without dredge-up there should be no change in these elements. With dredge-up there should be large changes in many other elements. Blöcker & Schönberner (Blo97 (1997)) assumed that some elements could have been locked in grains, but that only moves the problem to one of how the grains would be dissociated as the star cools.

5.6 Spectral evolution in the 1970’s
Cohen & Phillips (Coh80 (1980)) give equivalent widths for a limited number of strong lines measured from echelle spectra obtained on 1975 June 24, 1976 July 7, and 1978 June 17. Using the new grid of model atmospheres, elemental abundances were computed as a function of Teff, and . Figure 9 shows the results for normal only. In line with arguments presented elsewhere, normal , and are the most appropriate to use for these data. The main conclusions are summarised below. There are uncertainties associated with the equivalent width measurements and the atomic data used in the line formation calculations. These are illustrated by a spread of 2 dex in the results from five Y ii lines. Currently the only Y i line and two Fe i lines measured by Cohen & Phillips (Coh80 (1980)) give abundances which are discrepant from other lines due to the same atoms by a further 2 dex. There is little or no evidence for a change in composition during the interval spanned by these data.
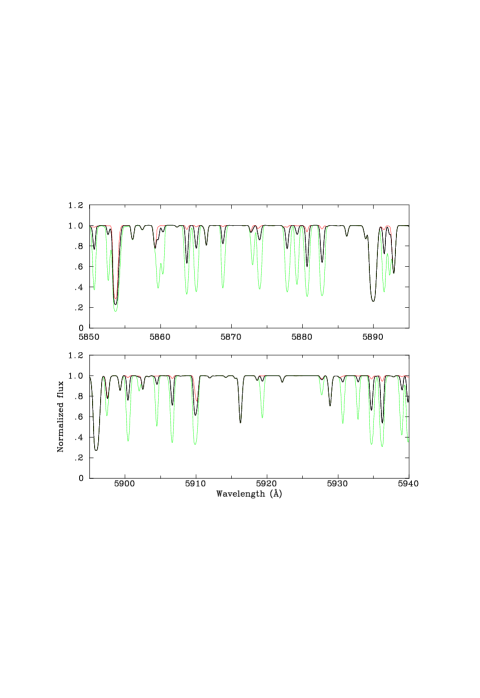
The individual line analyses are supported by examination of one echelle order of the 1975 spectrum of FG Sge (Cohen & Phillips Coh80 (1980), Fig. 3). Model spectra have been computed with the abundances of s-process elements and lanthanides Sr, Y, Zr, Ba, La, Ce, Pr, Nd, Sm and Eu enhanced by 0, 1 and 2 dex in turn for a range of Teff, and . Figure 10 shows the models for normal hydrogen, , and . A comparison with Fig. 3 of Cohen & Phillips (Coh80 (1980)) demonstrates that all of the principal features in the observed spectrum can be reproduced with an excess of dex in the s-process elements except, of course, for the interstellar component of the NaD line.
The conclusions from the line analyses in the latter half of the 1970’s include:
-
•
Na, Mg and Fe were approximately normal;
-
•
Y and Zr were overabundant by 1–2 dex, subject to a large line-to-line scatter in Y;
-
•
Ba, Ce, Pr and Nd were overabundant by dex;
-
•
La was overabundant by dex.
| Date | IUE | V | J | H | K | L | Teff | ||
|---|---|---|---|---|---|---|---|---|---|
| image | (FES) | (kK) | ( rad) | ||||||
| 1982 June | LWR 13399 | 9.4 | 7.0 | 6.8 | 6.6 | 6.6 | 5.450.08 | 5.150.05 | 0.47 |
| 1986 October | LWP 09356 | 9.1 | 7.0 | 6.6 | 6.4 | 6.1 | 5.420.05 | 6.080.02 | 3.05 |
| 1987 July | LWP 11269 | 9.2 | 7.0 | 6.7 | 6.5 | 6.2 | 5.390.05 | 5.420.05 | 0.91 |
| 1987 Sept | LWP 11585 | 9.1 | 7.0 | 6.6 | 6.5 | 6.3 | 5.300.04 | 5.620.05 | 0.57 |
| 1987 October | LWP 11820 | 9.2 | 7.1 | 6.7 | 6.5 | 6.1 | 5.280.04 | 5.360.05 | 0.84 |
5.7 in the 1980’s
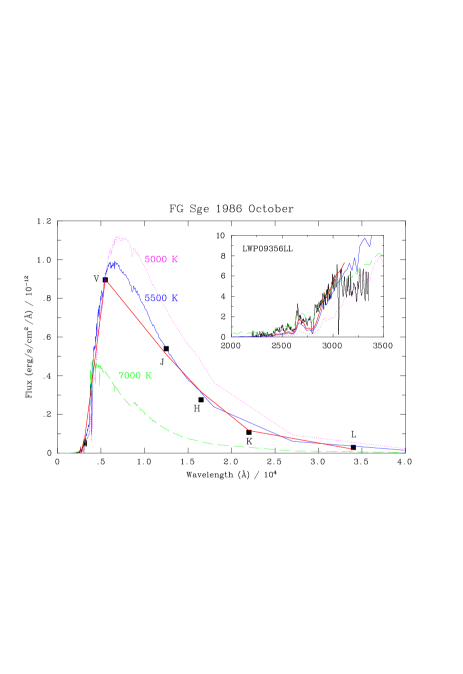
There are three published views of the run of Teff after 1980. Visual photometry provided either a K or K solution (van Genderen & Gautschy vGG95 (1995)), whilst the ultraviolet fluxes observed with IUE led to a still higher K solution (Montesinos et al. Mon90 (1990)). The latter are based on a very small fraction of the total energy distribution of the star. This may be verified by combining the UV data with the visual and infrared data presented by the same authors (Table 2), and by comparing these with theoretical spectral energy distributions (SED’s, Fig. 11).
Best fit model energy distributions have been obtained using a minimization procedure (ffit, Jeffery Jef01 (2001)). We have used SED’s from the models computed for this paper and have assumed (van Genderen & Gautschy vGG95 (1995)) and a standard Galactic extinction law (Seaton Sea79 (1979)). Only IUE data between 2400 and 3100 Å were used, larger data errors at Å substantially degraded the fit quality. We could not differentiate qualitatively between models having 1%, 10%, and 90% hydrogen (by number); this introduces a systematic uncertainty in Teff of a few tens of degrees, comparable with the formal fitting errors quoted in Table 2. Random errors in Teff due to other factors (primarily data quality) are K, and systematic errors due to other properties of the models may also be K.
We conclude that the high Teff photometric solution of van Genderen & Gautschy (1995) is consistent with the ultraviolet and infrared photometry. We suspect that the measurements of Montesinos et al. (Mon90 (1990)) were systematically in error due to the inclusion of noisy IUE data at Å and since they are completely inconsistent with the contemporary photometry.
5.8 Did s-process abundances continue to increase into the 1990’s?
The most recent analysis of the FG Sge photosphere before it was obscured by circumstellar dust finds a continued increase in s-process and rare-earth elements (Gonzalez et al. Gon98 (1998)). Section 3.6 discusses how this conclusion was based on a measurement of which both contradicts the total flux distribution (Section 5.7) and implies a rapid contraction between 1992 and 1994.
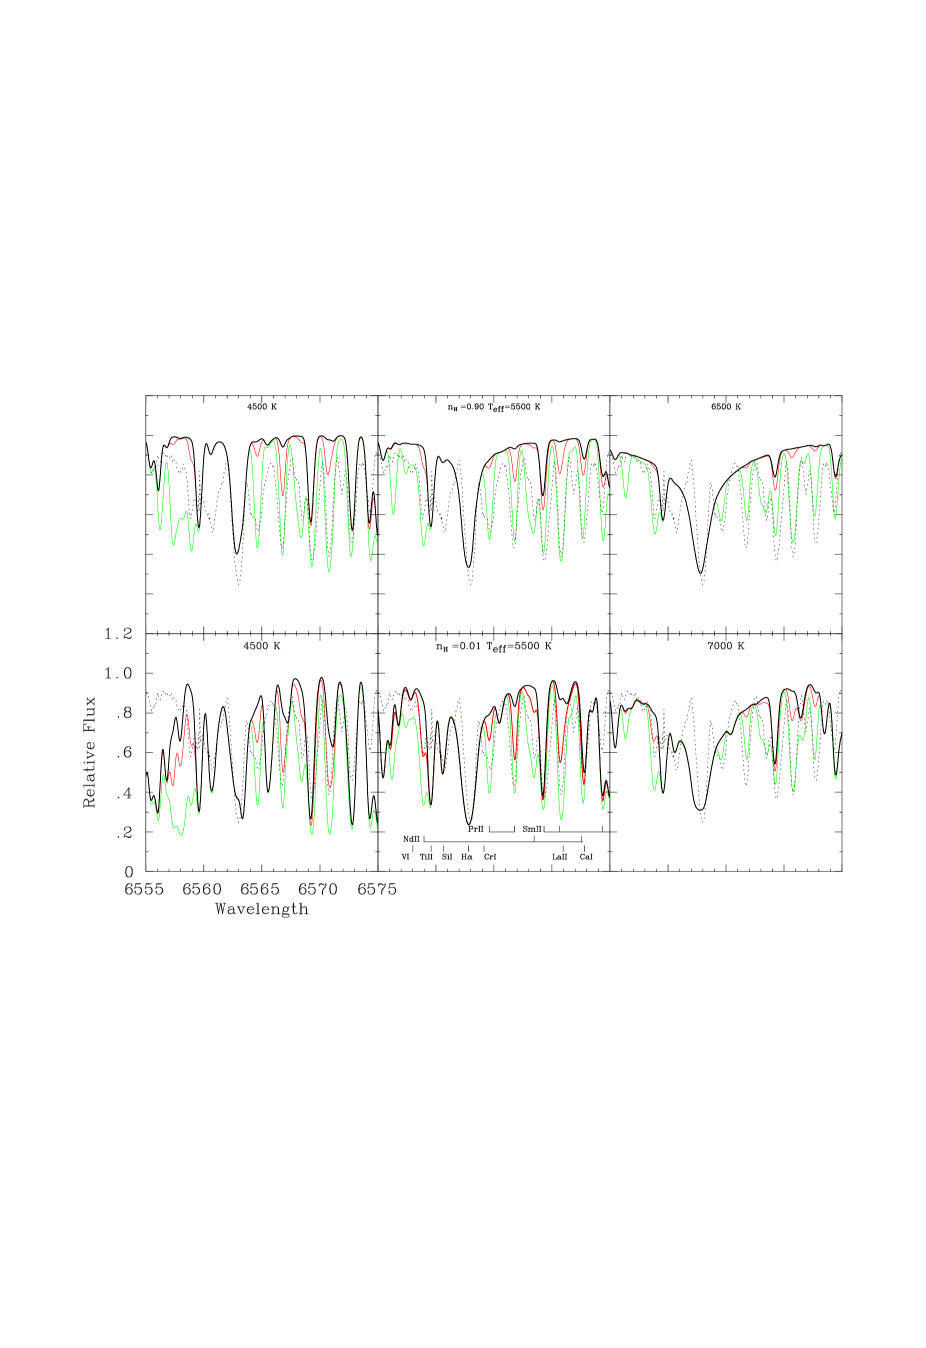
Prof. G. Gonzalez has kindly provided a copy of his 1994 September 21 spectrum for comparison with our models. While, we have not had the resources to carry out a complete fine analysis of this spectrum, we have been able to test (and revise) various hypotheses. As before, we have assumed and have computed theoretical spectra for Teff in the range 4 500 to 7 000 K. We have examined models with and 10 , and three hydrogen abundances, and 0.01. We have also considered models with elemental abundances for Sc, Ga, Sr, Y, Zr, Mo, Ba, La, Ce, Pr, Nd, Sm, Eu, Gd, Tb, Dy, Er, Yb, Lu, Hf and Pb increased by 0, 1, 2 and 3 dex.
Figure 12 is plotted for direct comparison with Fig. 14 of Gonzalez et al. (Gon98 (1998)). It shows a subset of the above models together with the spectrum of 1994 Sept 21 around H. The wavelength region shown includes lines of several s-process elements (La, Nd, Pr and Sm) as well as other species (Si, V, Cr, Ti).
With normal hydrogen (), , , and a 3 dex enhancement of s-process elements, the model does a reasonable job of reproducing the observed spectrum, except that the s-process lines are somewhat weak and the region close to H, especially Sii, does not fit well. A better fit to the s-process lines is recovered with and [s/Fe] = +3 redward of H. However the “continuum” and the region to the blue are not reproduced.
Models with match the measured IUE fluxes.
With reduced hydrogen (), and , several features are already quite well reproduced with normal (solar) abundances. Indeed, assuming a near-normal abundance for silicon, it appears in this case that the observed strength of Sii is a good indicator of hydrogen-deficiency. Exceptions to the fit quality are at the red and blue extremes. The remaining features can be reproduced with . These lower [s/Fe] values result entirely from the reduced hydrogen abundance, which lowers the background opacity and immediately strengthens all of the absorption lines (for weak lines, line strength varies as the ratio of line opacity to local continuous opacity).
Unfortunately, we are not in a position to model the C2 bands and hence to establish whether the carbon abundance is significantly different from normal. The mere fact, however, that C2 is apparent indicates with certainty that and that the carbon abundance must be somewhat enhanced (see Section 3.5).
In summary, by adopting a more appropriate Teff and gravity the FG Sge spectrum in 1992 shows:
-
•
reduced hydrogen abundance,
-
•
a C/O ratio ,
-
•
modest ( dex) overabundances of La, Nd, Pr and Sm,
-
•
by extension, detections of 3 dex overabundances in other elements seem premature.
A complete reanalysis of this spectrum using appropriate model atmospheres would be rewarding.
5.9 Summary
Taken as a whole, this re-evaluation provides the following view of the evolution of FG Sge between 1960 and 1995:
-
•
The high Teff scale (van Genderen & Gautschy vGG95 (1995)) based on visual photometry and pulsation period proxies is consistent with IUE and infrared photometry, and excludes a contraction/heating phase from the 1980s’s onwards.
-
•
FG Sge appears to have been hydrogen-rich at the start of this interval, but hydrogen-poor by the end.
-
•
There is little evidence for an unusual carbon abundance before the appearance of C2 bands in the 1990’s, which demand C/O . However, the available data are sparse (Herbig & Boyarchuk Her68 (1968)) and the C abundance in 1960 is poorly defined.
-
•
In general, the abundances of s-process elements and rare-earths are consistently about 1 dex above the solar value. With one exception, the evidence for wholescale changes of up to 3 dex must be viewed with scepticism. A modest increase (up to dex) between 1975 and 1994 may be acceptable, representing a confidence level on our estimates.
-
•
The only credible exception is a 1 dex enhancement in Y and Zr between 1965 and 1972. This is a mystery without dredge-up.

| Teff | log | Age (yr) | H | He | C | O |
|---|---|---|---|---|---|---|
| 6700 | 0.55 | 0 | 0.918 | 0.079 | 0.003 | 0.000 |
| 7000 | 0.63 | 128 | 0.877 | 0.119 | 0.003 | 0.001 |
| 7900 | 0.80 | 161 | 0.793 | 0.182 | 0.021 | 0.005 |
| 9000 | 1.00 | 195 | 0.657 | 0.279 | 0.052 | 0.013 |
| 10000 | 1.20 | 279 | 0.577 | 0.335 | 0.071 | 0.017 |
| 11200 | 1.37 | 374 | 0.461 | 0.416 | 0.099 | 0.024 |
| 11900 | 1.47 | 418 | 0.321 | 0.513 | 0.134 | 0.032 |
| 12300 | 1.49 | 507 | 0.181 | 0.607 | 0.170 | 0.041 |
| 12600 | 1.49 | 788 | 0.162 | 0.620 | 0.176 | 0.042 |
| 13800 | 1.70 | 1073 | 0.162 | 0.620 | 0.176 | 0.042 |
| 15800 | 1.94 | 1098 | 0.162 | 0.620 | 0.176 | 0.042 |
6 Evolution
The evolution of FG Sge is defined photometrically (van Genderen & Gautschy vGG95 (1995)) since about 1890 and spectroscopically since 1960. An additional upper limit of before expansion is provided by the associated planetary nebula (He 1–5: Hawley & Miller Haw78 (1978)), taking into account the weakness of the observed He ii emission and the recombination time scale. The nebula is reported by the same authors to have normal abundances, although a previous report of anomalously high N/O coupled with should be acknowledged (Harrington & Marionni Har76 (1976)). These constraints may be discussed in terms of theoretical models for the evolution of FG Sge.
6.1 Late thermal pulse models
The upper limit on Teff defined where the helium-shell flash occurred during FG Sge's contraction towards a white-dwarf configuration and indicates that this event happened along the horizontal part of its post-ABG evolution. This type of flash is normally called a ‘late’ thermal pulse (LTP) as opposed to a ‘very late’ thermal pulse (VLTP) which occurs on the descending part of the post-AGB track (cf. Blöcker Blo01 (2001)). From a theoretical point of view the characteristic difference between both types of thermal pulse is that only for the VLTP does the pulse-driven convective shell penetrate into hydrogen-rich layers, thereby causing complete mixing and burning of the hydrogen-rich envelope matter (Schönberner Sch79 (1979); Iben et al. Ibe83 (1983); Iben Ibe84 (1984); Herwig et al. Her99 (1999)). According to the latter authors, the final surface abundance pattern following a VLTP should reflect virtually that of the intershell region, viz. a mixture of helium, carbon and oxygen, without hydrogen (see also Herwig 2001a ).
The speed of the redward looping depends on the characteristic thermal/gravitational time scale of all the matter above the helium shell and is a strong function of the remnant mass. Based on ‘flashing’ post-AGB models of different masses Schönberner & Blöcker (1997) estimated for FG Sge a mass very close to 0.6 M⊙.
It is important to note here that in the VLTP mixing and burning of the hydrogen-rich envelope occurs immediately during the flash and is already completed before the star turns back to the red-giant region. On the contrary, a central star experiencing an LTP is not expected to show any signs of internal mixing/burning processes at its surface while it is expanding towards a ‘born-again’ red giant configuration. This appears to be confirmed by the normal surface composition found for FG~Sge after it attracted the attention of observers, i.e. at a time when the flash is already over.
In any case, the observed enrichment of the s-process elements need not be the result of the late thermal pulse (cf. Iben Ibe84 (1984)). The s-process elements are likely to be the result of the past pulses when FG~Sge was still an AGB star. Indeed, several post-AGB stars are already known to be enriched in C and N, with C/O , weak iron-group elements and s-process elements by dex (Reddy et al. Red99 (1999), Red02 (2002), Hrivnak & Reddy Hri03 (2003)). With very similar surface compositions, such stars are likely counterparts to FG Sge should they suffer a LTP sometime in the future.
Though the standard evolutionary models of an LTP develop strong envelope convection while approaching low surface temperatures, the bottom of the convection zone does not penetrate into nuclearly processed layers, i.e. the 3rd dredge-up does not occur until after the star reaches its minimum temperature.
This is illustrated in Fig. 13 and Table 3 by means of the 0.625 M⊙ born-again model of Blöcker (Blo01b (2001)). Dredge-up starts after the reddest point is reached, leading to a slow dilution of the hydrogen-rich envelope by helium/carbon-rich intershell matter, with a mean rate of M⊙/yr. Note that there occurs no burning of hydrogen. During the dredge-up the star contracts slowly towards , at a rate of 10 K/yr. The dredge-up is completed within about 800 years and leads to a hydrogen-deficient stellar surface: . The model has obviously changed into a [WC]-type central star. A very similar result has been obtained by Herwig (2001) for a 0.6 M⊙ post-AGB model.
Therefore the dilemma posed by FG Sge is that, according to the associated planetary nebula, it must have experienced a LTP. However, LTP models predict that surface hydrogen should not be depleted until a deep convection zone is established, and then only y after the pulse occurs. In the case of FG Sge, this hydrogen-depletion has occurred before the star reaches its minimum temperature, but substantially after the time at which it is predicted to occur following a VLTP.
6.2 Double-loop models
An alternative and interesting model has been proposed by Lawlor & MacDonald (Law03 (2003)). In their calculations of the evolution of a post-AGB star following a ’very late thermal pulse’, “models with low convective mixing efficiency first evolve quickly to the AGB, return to the blue, and then evolve more slowly back to the AGB for a second time before finally returning to the white dwarf cooling track”. The attraction of this model is that it appears to provide a very satisfactory explanation for the rapid redward evolution of V4334 Sgr (Duerbeck et al. Due02 (2002)), the historical appearance and subsequent contraction of V605 Aql (Clayton & de Marco Cla97 (1997)) and the comparatively leisurely expansion of FG Sge as different phases of the same evolutionary track.
According to this model, FG Sge would be in its second return to the red, but the weaknesses of the model are several. It predicts that the surface of FG Sge should be highly-processed (i.e. hydrogen-deficient and carbon-rich) throughout its recent history which, we have shown, it was not. It also states that the star would have been a white dwarf, with , in the comparatively recent past; too hot to comply with the nebula diagnostics (cf. Sect. 6), and possibly too old for the nebula to have survived (which it has).
Very recently, Miller Bertolami et al. (Mil06 (2006)) have made an independent calculation of evolution following a very late thermal pulse, and again find a double-loop structure with hydrogen and then helium providing two phases of expansion. The interepretation of FG Sge within this framework suffers the same difficulties as for the Lawlor & MacDonald (Law03 (2003)) models.
7 Conclusions
We have made an extensive review of the chemical evolution of the surface of FG Sge between approximately 1960 and 1990, an epoch during which there have been published reports of dramatic changes in the abundances of many elements including particularly those created by s-process nucleosynthesis in the stellar interior. In several cases, these various reports have been shown to be seriously inconsistent with one another and with stellar evolution theory. Although it is more usual to recast the theory when observation and theory come into conflict, the observational inconsistencies are sufficiently strong that they must be examined closely.
Although we have not had direct access to the majority of the raw spectrograms, we have been able to assess the reliability of the majority of key studies, particularly those by Herbig & Boyarchuk (Her68 (1968)), Langer et al. (Lan74 (1974)), Cohen & Phillips (Coh80 (1980)), and Gonzalez et al. (Gon98 (1998)). Although the first three of these report some changes in the abundances of carbon and s-process elements, we find that the data presented are almost entirely consistent with a constant surface composition typical of other post-AGB stars, i.e. with C/O and s-process abundances enhanced by dex. The exception that the earliest data for Y and Zr indicate an increase from normal abundance to dex remains a mystery. The very dramatic increases in s-process abundances reported in the most recent study (Gonzalez et al. Gon98 (1998)) are demonstrably wrong. They are due to the adoption of a value for Teff which is 1 000 K too high. A reassessment of the calibration of the photometric evolution from ultraviolet data by Montesinos et al. (Mon90 (1990)) demonstrates that the “high” Teff calibration by van Genderen & Gautschy (vGG95 (1995)) is most consistent with all of the photometric and spectroscopic data. Since FG Sge has now maintained its current Teff of around 5 500 Kfor over a decade, this may represent the cool limit in its redward evolution.
Supporting Iben (Ibe84 (1984)), we have argued that the current surface of FG Sge does not show evidence of freshly dredged-up material in the form of carbon or s-processed elements. Contrary to Schönberner & Jeffery (Sch03 (2003)), we find that surface hydrogen has been depleted in the recent past ( y). In the 1960’s it had an apparently normal H content (cf. Fig. 6), whereas in 1994 there is evidence of H-depletion via a reduced background opacity (cf. Fig. 12); a conclusion based on a partial analysis of the high-resolution spectrum of Gonzalez et al. (Gon98 (1998)) not earlier at our disposal. We do not see evidence of the very prompt mixing suggested by recent VLTP theory.
Stellar evolution theory predicts that, although a convective envelope does form as the star cools following a late thermal pulse, a deep convective envelope capable of dredging up processed material will not form until some time after the star has completed its redward evolution. Therefore, the observed hydrogen depletion, suggesting prompt envelope mixing following a VLTP, contradicts the age derived from the associated planetary nebula, which suggests an LTP. The question is then how well the physics of the LTP and VLTP are understood, and whether the demarcation between them is as concrete as current models suggest.
FG Sge is one of those very rare objects which demonstrates stellar evolution “while-you-wait”. As a very evolved star, its surface already shows some material which has been created by nucleosynthesis in the deep interior. Astero-archaeology is the science of sifting through such material for clues to the past evolution of the star. In this case, most of the material was brought to the surface when the star had a deep convective envelope on the asymptotic giant branch. However, it seems that FG Sge has recently entered a new period of excavation, which has recently brought fresh helium to the surface. Other elements will be added to this within the next hundred or so years, when it will be possible to observe fresh material being brought to the surface as the star begins to dig up its own past. Continuing observations will provide key tests for stellar evolution models, particularly for models of late and very late thermal pulses.
Acknowledgements
This research was supported by a Northern Ireland Department of Culture, Arts and Leisure grant to the Armagh Observatory and by visitor grants from the Astrophysikalisches Institut Potsdam. This research has made extensive use of the SIMBAD database, operated at CDS, Strasbourg, France, of NASA’s Astrophysics Data System, and of the INES System, developed by the ESA IUE Project at VILSPA.
The authors are grateful to: Ms E. Stephenson, a summer student sponsored by the Nuffield Foundation, for assistance with remeasurement of the IUE data, to Prof G. Gonzalez for providing a copy of the 1994 spectrum of FG Sge, to Dr T. Blöcker for details of his evolutionary models, to Dr R. Stancliffe for teaching one of us about the ramifications of the Very Late Thermal Pulse. They are indebted to the referee, Dr M. Asplund, for his careful critiques of this paper which resulted in a reappraisal of their original conclusions.
Appendix A Herbig & Boyarchuk abundance measurements
| Elem | FG Sge: [X] Cyg | FG Sge: Mean | Cyg | Sun | ||||||
|---|---|---|---|---|---|---|---|---|---|---|
| July | Sept | Sept | Aug | May | [X] Cyg | [X] | [X]Sun | |||
| 1960 | 1960 | 1962 | 1963 | 1965 | ||||||
| H | +0.50 | +0.53 | +0.23 | +0.55 | +0.43 | +0.43 | 12.43 | +0.43 | 12.00 | 12.00 |
| He | +1.48 | – | – | +0.06 | +0.77 | 11.62 | +0.69 | 10.85 | [10.93] | |
| C | +0.74 | +0.91 | +0.83 | +1.09 | +0.89 | 9.83 | +1.44 | 8.94 | 8.39 | |
| O | – | – | +0.25 | +0.74 | +0.45 | +0.48 | 9.11 | +0.45 | 8.63 | 8.66 |
| Mg | +0.29 | +0.85 | +0.10 | +0.48 | +0.06 | +0.23 | 7.74 | +0.21 | 7.51 | 7.53 |
| Si | +0.04 | +0.28 | +0.45 | +0.19 | +0.24 | 7.64 | +0.13 | 7.40 | 7.51 | |
| Ca | +0.60 | +1.61 | –0.05 | 6.74 | +0.43 | 6.79 | 6.31 | |||
| Sc | – | – | +0.36 | +0.41 | +0.16 | +0.31 | 3.26 | +0.21 | 2.95 | 3.05 |
| Ti | +0.05 | +0.15 | –0.05 | 4.96 | +0.05 | 5.00 | 4.90 | |||
| V | – | – | +0.11 | +0.49 | +0.26 | +0.29 | 4.41 | +0.41 | 4.12 | 4.00 |
| Cr | +0.17 | – | +0.03 | 0.01 | 5.73 | +0.09 | 5.72 | 5.64 | ||
| Mn | +0.29 | – | +0.15 | – | +0.11 | 5.71 | +0.32 | 5.60 | 5.39 | |
| Fe | +0.03 | –0.20 | 7.37 | –0.08 | 7.57 | 7.45 | ||||
| Co | +0.92 | – | +0.44 | +0.61 | – | +0.66 | – | – | – | 4.92 |
| Ni | – | – | +0.13 | +0.23 | +0.22 | +0.19 | 6.43 | +0.20 | 6.24 | 6.23 |
| Sr | +1.06 | – | +0.57 | +0.82 | +0.56 | +0.75 | 4.03 | +1.11 | 3.28 | 2.92 |
| Zr | – | – | +0.05 | +0.32 | +0.33 | +0.23 | 3.64 | +1.05 | 3.41 | 2.59 |
| Ba | – | – | +0.22 | +0.32 | +0.38 | +0.31 | 3.19 | +1.02 | 2.88 | 2.17 |
| Eu | – | – | +0.1 | –0.20 | 2.28 | +1.76 | 2.48 | 0.52 | ||
In order to make the abundance measurements for FG Sge presented by Herbig & Boyarchuk (Her68 (1968)) more accessible, they are presented in Table 4 in the more conventional form of the logarithm of the abundance by number relative to Cyg. Adopting a recent measurement of abundances in Cyg (Albayrak Alb00 (2000)), the mean Herbig & Boyarchuk (Her68 (1968)) abundances in FG Sge are also shown relative to the Sun. Note that Albayrak (Alb00 (2000)) gives the Cii abundance in Cyg as 8.94 from one line only. The Ci abundance is 8.21. Since the Herbig & Boyarchuk measurements were based on Cii lines, we have used the Cii value for Cyg in Table 4. The mean overabundance of C relative to the Sun between 1960 and 1965 in FG Sge would be +0.4 dex rather than +1.1 dex if the Ci value were adopted for Cyg.
References
- (1) Acker A., Jaschek M., & Gleizes F. 1982, A&AS 48, 363
- (2) Albayrak, B. 2000, A&A 364, 237
- (3) Arkhipova, V.P. 1993, Astro. Lett. 19, 235
- (4) Asplund, M., Gustafsson, B., Lambert, D.L., & Rao N.K. 1997, A&A 321, L17
- (5) Asplund, M., Grevesse, N., & Sauval A.J. 2005, In ’Cosmic Abundances as Records of Stellar Evolution and Nucleosynthesis’, ASPC 336, 25, eds. F. N. Bash & T. G. Barnes
- (6) Behara, N.T., & Jeffery, C.S. 2006, A&A, 451, 643
- (7) Blöcker, T. 1995, A&A 299, 755
- (8) Blöcker, T. 2001, Ap&SS 275, 1
- (9) Blöcker, T., & Schönberner, D. 1997, A&A 324, 991
- (10) Blöcker, T., Osterbart, R., & Weigelt, G. 2001, in Post-AGB Objects as a Phase of Stellar Evolution, ed. R. Szczerba & S.K. Gorny, Astrophysics & Space Science Library 265 (Dordrecht: Kluwer Acad. Publ.), 241
- (11) Chalonge, D., Divan, L., & Mirzoyan, L.V. 1977, Byurakan 13, 437
- (12) Clayton, G., & de Marco, O. 1997, AJ 114, 2679
- (13) Cohen, J.G., & Phillips, A.C. 1980, ApJ 237, 99
- (14) Cowley, C.R., Jaschek, M., & Acker, A. 1985, A&A 149, 224
- (15) Duerbeck, H., Hazen, M.L., Misch, A.A., & Seitter, W.C. 2002, Ap&SS, 279, 183
- (16) Gonzalez, G., Lambert, D.L., Wallerstein, G., et al. 1998, ApJS, 114, 133
- (17) Gray, R.O., Graham, P.W., & Hoyt, S.R. 2001, ApJ 121, 2159
- (18) Harrington, J.P., & Marionni, P.A. 1976, ApJ 206, 458
- (19) Hawley, S.A., & Miller, J.S. 1978, ApJ 221, 851
- (20) Herbig, G.H., & Boyarchuk, A.A. 1968, ApJ 153, 397
- (21) Herwig, F. 2001a, Ap&SS 275, 15
- (22) Herwig, F. 2001b, ApJ 554, L71
- (23) Herwig, F., Blöcker, T., Langer, N., & Driebe, T. 1999, A&A 349, L5
- (24) Herwig, F., Blöcker, T., Schönberner, D., & El Eid, M. 1997, A&A 324, l8
- (25) Hoffmeister, C., 1944, AN 274, 176
- (26) Hrivnak, B.J., & Reddy, B.E. 2003, ApJ 590, 1049
- (27) Iben, I.,Jr. 1976, ApJ 208, 165
- (28) Iben, I.,Jr. 1984, ApJ 277, 333
- (29) Iben, I.,Jr., Kaler, J.B., Truran, J.W., & Renzini, A. 1983, ApJ 264, 605
- (30) Jeffery, C.S., Woolf, V.M., & Pollacco, D. 2001. A&A 376, 497
- (31) Johnson, H. 1966, ARA&A 4, 200
- (32) Kipper, T., & Kipper, M. 1993, A&A 276, 389
- (33) Kipper, T., & Klochkova, V.G. 2001, Baltic Astronomy, 10, 393
- (34) Kupka, F., Piskunov, N., Ryabchikova, T.A., Stempels, H.C., & Weiss, W.W. 1999, A&AS 138, 119
- (35) Kurucz R.L. 1970, SAOSR, No. 309
- (36) Kurucz R.L. 1979, ApJS 40, 1
- (37) Kurucz, R. 1991, Precision Photometry: Astrophysics of the Galaxy, p.27, ed. A.G.D. Philip, A.R. Upgren and K.A. Janes. Schenectady, NY: Davis Press
- (38) Kurucz R.L., & Petryemann E. 1975, A Table of Semiempirical gf Values, SAO Special Report No. 362, Cambridge, Massachussets 02138
- (39) Kurucz, R. 1994, Kurucz CD-ROM No. 1. Cambridge, Mass.: Smithsonian Astrophysical Observatory
- (40) Langer, G.E., Kraft, R.P., & Anderson, K.S. 1974, ApJ 189, 509
- (41) Lamers, H.J.G.L.M., & Fitzpatrick, E.L. 1988, ApJ 324, 279
- (42) Lawlor, T.M., & MacDonald, J. 2003, ApJ 583, 913
- (43) Miller Bertolami, M.M., Althaus, L.G., Serenelli, A.M., Panei J.A., 2006, A&A 449, 313
- (44) Mihalas, D. 1978, ‘Stellar Atmospheres’ 2nd ed., Freeman, New York
- (45) Möller, R.U. 1990, Diplom. Thesis, Universität Kiel
- (46) Montesinos, B., Cassatella, A., González-Riestra, R., et al. 1990, ApJ 363, 245
- (47) Paczynski, B. 1971, Acta Astron. 21, 417
- (48) Papousek, J. 1992, IAUC 5604
- (49) Piskunov, N.E., Kupka, F., Ryabchikova, T.A., Weiss, W.W., & Jeffery, C.S. 1995, A&A 112, 525
- (50) Reddy, B.E., Bakker, E.J., & Hrivnak, B.J. 1999, ApJ 524, 831
- (51) Reddy, B.E., Lambert, D.L., Gonzalez, G., & Yong, D. 2002, ApJ 564, 482
- (52) Royer, R.E. 1999, JAVSO 27, 246
- (53) Sackmann, I.-J., & Despain, K.H. 1974, ApJ 189, 523
- (54) Seaton M.J. 1979, MNRAS 187, 73P
- (55) Schönberner, D. 1979, A&A 79, 108
- (56) Schönberner, D., & Jeffery, C.S. 2003, in Exotic Stars as Challenges to Evolution, ed. C.A. Tout, & W. Van Hamme, ASP Conf. Ser. 279, 173
- (57) Schönberner, D., & Wolf, R.E.A. 1974, A&A37, 87
- (58) Smolinski, J., Climenhaga, J.L., & Kipper, T. 1976, PASP 88, 67
- (59) Stone, R.P.S. 1979, PASP 91, 389
- (60) Stone, R.P.S., Kraft, R., & Prossner, C.F. 1993, PASP 105, 755
- (61) Taranova, O.G. 1987, Soviet Astron. Lett. 13, 374
- (62) van Genderen, A.M., & Gautschy, A. 1995, A&A 294, 453