Evolution of emission line activity in intermediate mass young stars
Abstract
We present optical spectra of 45 intermediate mass Herbig Ae/Be stars. Together with the multi-epoch spectroscopic and photometric data compiled for a large sample of these stars and ages estimated for individual stars by using pre-main sequence evolutionary tracks, we have studied the evolution of emission line activity in them. We find that, on average, the H emission line strength decreases with increasing stellar age in HAeBe stars, indicating that the accretion activity gradually declines during the PMS phase. This would hint at a relatively long-lived (a few Myr) process being responsible for the cessation of accretion in Herbig Ae/Be stars. We also find that the accretion activity in these stars drops substantially by 3 Myr. This is comparable to the timescale in which most intermediate mass stars are thought to lose their inner disks, suggesting that inner disks in intermediate mass stars are dissipated rapidly after the accretion activity has fallen below a certain level. We, further find a relatively tight correlation between strength of the emission line and near-infrared excess due to inner disks in HAeBe stars, indicating that the disks around Herbig Ae/Be stars cannot be entirely passive. We suggest that this correlation can be understood within the frame work of the puffed-up inner rim disk models if the radiation from the accretion shock is also responsible for the disk heating.
1 Introduction
There has been considerable interest in the evolutionary studies of circumstellar disks around young stars in the past few years. The primary motivation for such studies has been the realisation that young circumstellar disks are the potential sites of planet formation. There is now overwhelming observational evidence for the presence of circumstellar disks around a majority of young pre-main sequence (PMS) stars (e.g. Beckwith & Sargent 1996; Mannings & Sargent 1997; Weinberger et al. 2002; Eisner et al. 2003). The observed disk masses, sizes and chemical composition of young circumstellar disks are analogous to that of the protosolar nebula (e.g. Beckwith 1999; Hillenbrand 2005). How these disks evolve into planetary systems is one of the fundamental questions in astronomy.
In the early PMS phase, young stars actively accrete matter from the surrounding optically thick, gas-rich disk (e.g. Hartmann 1998) . As the star evolves, the disk accretion rate goes down and eventually the accretion is terminated. By the time the central stars reach the main sequence, young circumstellar disks surrounding them lose most of the material due to planet formation and other disk dispersal processes. Characterising this evolution of circumstellar disks, therefore, is critical to improve our understanding of the planet formation process and disk dispersal mechanisms and their associated timescales.
Temporal evolution studies of circumstellar disks use different observational diagnostics of the disks such as emission lines, continuum excess in the UV, near-infarred (NIR) excesses and millimiter and sub-mm excesses which trace different properties of the disks with varying efficacy. For example, emission lines and continuum excess in the UV trace level of accretion activity in young stars, NIR excess traces the hot inner disk and millimeter and sub-mm excesses trace cold dust in the outer disk.
Most disk evolution studies in the literature have been based on the NIR excess which traces the evolution of inner accretion disks (e.g. Strom et al. 1989; Skrutskie et al. 1990; Strom et al. 1993; Haisch et al. 2001b, a; Hillenbrand 2002, 2005). From the JHKL imaging studies of embedded and revealed clusters of different ages, Haisch et al. (2001b) have found that essentially all the stars in a cluster lose their disks in 6 Myr. Hillenbrand (2005), for a much larger sample of young clusters and associations obtained the median lifetime of the optically thick accretion disks to be 2-3 Myr, but with a large scatter, especially at young ages ( 1 Myr). All these studies are consistent with the fact that the inner disks in most young stars do not last for more than 5 Myr.
How long does emission line activity persist in young stars? Emission lines are more closely related to accretion activity than the JHKL excess (e.g. Muzerolle et al. 2004). Excesses at the NIR wavelengths can be produced even by passive disks if there is hot ( T 1000 K) dust present close to the star. Therefore the evolution of accretion is better diagnosed with emission lines. In this contribution we study the evolution of emission line activity in intermediate mass young stars. With the data compiled for a large sample of Herbig Ae/Be( hereafter HAeBe) stars, which are PMS objects of intermediate mass (), we study the evolution of emission line activity in these stars.
One of the prominent observational features of HAeBe stellar group and that which distinguishes these stars from the normal main sequence stars is the presence of emission lines in the spectra. Apart from the H line which is almost always in emission, the other emission lines that are often observed in the optical spectra of HAeBe stars are HeI ( & ), OI ( & ) and CaII triplet () (Herbig 1960; Cohen & Kuhi 1979; Finkenzeller & Mundt 1984; Hamann & Persson 1992; Böhm & Catala 1995) and forbidden emission lines such as [OI] ( and ) (Herbig 1960; Hamann 1994; Böhm & Catala 1994; Böhm & Hirth 1997; Corcoran & Ray 1998; Vieira et al. 2003; Acke et al. 2005).
In the low mass PMS T Tauri stars, the origin of emission lines is currently understood in the framework of magnetospheric accretion model where emission lines are believed to be formed in the magnetospheric accretion columns (Uchida & Shibata 1985; Koenigl 1991; Hartmann et al. 1994; Muzerolle et al. 1998, 2001). However, in HAeBe stars the situation is less clear. Nevertheless, recent high spatial resolution interferometric observations at millimeter (mm), sub-mm and NIR wavelengths have revealed the presence of gas and dust circumstellar disks with inner holes, and possibly with puffed up inner rims, around a large number of HAeBe stars (Natta et al. 2000; Mannings & Sargent 1997, 2000; Piétu et al. 2003; Ohashi & Lin 2005; Millan-Gabet et al. 2001; Eisner et al. 2003, 2004; Monnier et al. 2005). Observed disk properties are in general similar to those found for the disks surrounding T Tauri stars. Spectropolarimetric observations of linear polarization across emission lines in HAeBe stars have clearly demonstrated that the emission lines originate in a compact region close to the star (Vink et al. 2002, 2005). Magnetic fields also have been detected in a few HAeBe stars (Hubrig et al. 2004; Wade et al. 2005). Magnetospheric accretion model has now been succesfully applied to HAeBe stars (Muzerolle et al. 2004). This evidence supports the fact that emission lines in HAeBe stars are related to accretion.
We obtained optical spectra of 45 HAeBe stars in order to investigate the evolutionary trends in the emission line activity of these stars. We also compiled available photometric and spectroscopic data for a large number of these stars. Based on the multi-epoch photometric and spectroscopic data thus obtained for a sample of 91 stars, we studied the evolution of emission line activity in HAeBe stars. In Section 2 of the paper we describe our sample. Spectroscopic observations obtained are presented in Section 3. Main results of our study are presented in Section 4 and discussed in detail in Section 5. Finally, in Section 6 we summarize our conclusions.
2 Sample
Our sample of stars is taken from the catalogues of Thé et al. (1994) and Vieira et al. (2003) and consists of ‘bonafide’ HAeBe stars whose PMS status has been established and for which photometric data and reasonable distance estimates are available in the literature. We have included only B, A & F type stars in our sample. Further, stars which are known to be classical Be stars and for which there is no clear evidence for the presence of circumstellar dust (e.g. van den Ancker et al. 1998) have been excluded. Our sample consists of 91 HAeBe stars.
We compiled BVR photometric data from the literature for the stars in our sample except for 5 stars, for which R band data is not available. For 76 stars in our sample (84%) we have multi-epoch photometric data compiled from Herbst & Shevchenko (1999), de Winter et al. (2001), Oudmaijer et al. (2001) and Herbig & Bell (1988). For each star, we use a combination of magnitudes and colors measured quasi-simultaneously at a roughly mean magnitude in our analysis.
Recently, there have been attempts to accurately determine the spectral types of HAeBe stars (e.g. Hernández et al. 2004; Mora et al. 2001). We have compiled these refined spectral type estimates for the stars in our sample from Hernández et al. (2004), Mora et al. (2001) and Vieira et al. (2003). We also compiled distances for all the stars in our sample from the literature.
In Table Evolution of emission line activity in intermediate mass young stars we list the BVR magnitudes, spectral types and distances obtained from the literature for the 91 stars in our sample. All the magnitudes and colors listed in Table Evolution of emission line activity in intermediate mass young stars are in the Johnson system. Wherever the R magnitudes and/or V-R colors were listed in the Cousins system in the literature, we converted those into the Johnson system following the relation given in Bessell (1983).
3 Observations
Optical CCD spectra centered at the H line ( 6562 ) were obtained for 45 stars in our sample with the Optomechanics Research (OMR) spectrograph on the 2.34 meter Vainu Bappu Telescope (VBT) at the Vainu Bappu Observatory, Kavalur, India and with the Hanle Faint Object Spectrograph (HFOSC) on the 2 meter Himalayan Chandra Telescope at the Indian Astronomical Observatory, Hanle, India. The projected slit widths employed for the observations ranged from 1-2 resulting in resolutions (R = ) ranging from . The log of spectroscopic observations is presented in Table 2.
Spectral reduction was carried out in the standard manner using the IRAF111 IRAF is distributed by National Optical Astronomy Observatories, USA. package. All the spectra were first bias subtracted and then flat-field corrected. Thereafter, the sky subtracted spectra were extracted using the task APALL. Sky subtraction was achieved by interpolating the sky spectra on both sides of the target spectrum. The spectra were then wavelength calibrated using the FeNe comparison spectra obtained during the observing run. Spectra obtained on some nights with VBT/OMR showed strong telluric absorption lines of H2O and O2. Telluric lines from these spectra were removed using the standard stars observed on those nights and using the task TELLURIC in IRAF. Standard star spectrum was first scaled and shifted to match the intensity and wavelength of the telluric lines in the object spectra and then object spectra were divided by the standard spectrum. Removal of the telluric lines has been satisfactory for most stars although in a few spectra some residuals remain. Final reduced spectra of 45 stars are presented in Fig. 1.
4 Results
4.1 Ages of Herbig Ae/Be stars
We derived the ages of the stars in our sample by placing them in the Hertzsprung- Russel (HR) diagram and comparing with theoretical PMS evolutionary tracks. To compute the luminosities of the stars and to locate them in the HR diagram, a good estimation of the extinction towards these stars is very important. It has been shown by several authors that the value of the ratio of total-to-selective extinction RV towards HAeBe stars is higher than that for the diffuse interstellar medium (Strom et al. 1972; Herbst et al. 1982; Gorti & Bhatt 1993; Hernández et al. 2004). Recently, Hernández et al. (2004) have demonstrated that a value of RV = 5 fits the observations better than the average interstellar value of 3.1 for a large sample of HAeBe stars. This high value of RV strongly suggests that the average grain size in the circumstellar environment around HAeBe stars is larger than that in the diffuse interstellar medium. In the following we calculate RV for the stars in our sample from their B - V and V - R colors.
For the 86 stars in our sample for which we have both B - V and V - R colors, the color excesses E(B - V) and E(V - R) were calculated using the intrinsic colors for the spectral types given in Kenyon & Hartmann (1995). For 4 stars the color excesses turned out to be negative and we have called it to zero. For the remaining 82 stars we computed the ratio of total-to-selective extinction RV from the ratio of E(B - V) and E(V - R) color excesses using the following relation from Cardelli et al. (1989).
For most of the photometric data found in literature the errors in the measurements are not quoted. For measurements where errors are quoted, typical photometric errors are 1% or 0.01 mag. Taking the uncertainity in the spectral type estimation to be 2 sub-classes, rms errors in E(B - V) and E(V - R) are 0.06 and 0.05 respectively. For 77 stars in our sample the values of color excesses E(B-V) and E(V-R) are 1 error. We computed RV towards these stars using the relation above. For the remaining 14 objects we assign and RV value of 5.0. We then computed extinction AV for all the stars in our sample using the relation
(Cardelli et al. 1989).
From the mean V magnitudes and the distances listed in Table Evolution of emission line activity in intermediate mass young stars and together with the extinction computed as described above, we calculated the absolute V magnitudes of the stars. We then computed the absolute bolometric magnitudes using the values of bolometric corrections from Kenyon & Hartmann (1995). The bolometric luminosity of the star is then computed from the equation
where 4.74 is the absolute bolometric magnitude of the sun. The effective temperatures were assigned from the spectral types listed in Table Evolution of emission line activity in intermediate mass young stars and using the calibration of Kenyon & Hartmann (1995).
We thus computed the luminosities and assigned effective temperatures for all the 91 stars in our sample. Fig. 6 shows the locations of HAeBe stars in the HR diagram. Also plotted are the evolutionary tracks of Palla & Stahler (1993). We derive masses and ages for the HAeBe stars from their positions in the HR diagram and by comparing with the evolutionary tracks. For stars which fall above the birth line we quote lower limits on mass and upperlimits on age and for stars that fall below the main sequence we quote limits on ages and masses corresponding to the ZAMS value for that spectral type. Masses and ages thus derived are listed in Table 3.
4.2 Evolution of emission line activity
The most prominent emission feature in HAeBe stars is the H line. To study the temporal evolution of emission line activity in HAeBe stars, we use the equivalent width of H emission line (W(H)) as a measure of emission line activity. We measured the equivalent widths of the H line from the observed spectra. We also compiled H equivalent width W(H) measurements available from the literature for the stars in our sample. Multi-epoch measurements of W(H) obtained from our observations and compiled from the literature are tabulated in Table Evolution of emission line activity in intermediate mass young stars.
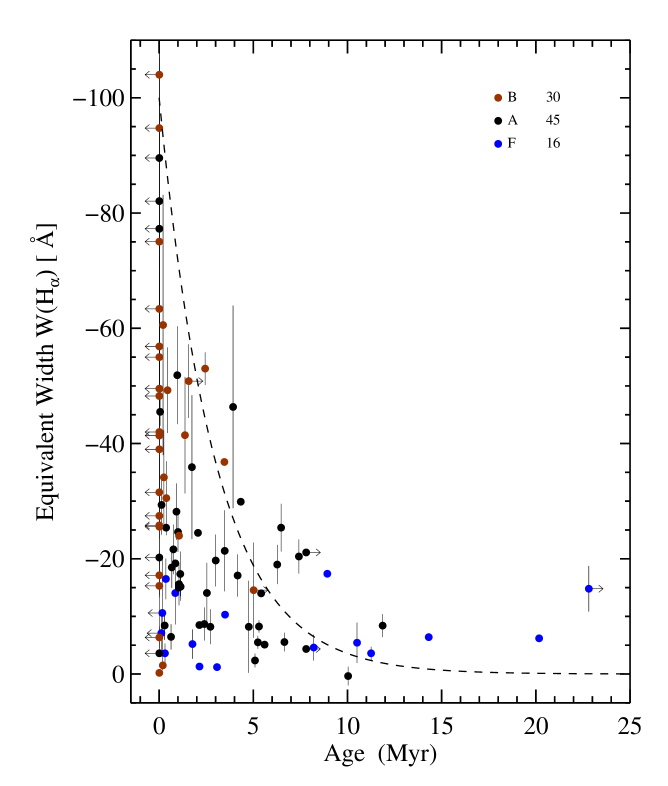
In Fig. 7 we plot the equivalent widths of H emission line W(H) for the HAeBe stars listed in Table Evolution of emission line activity in intermediate mass young stars against their ages that have been derived and listed in Table 3, to look for possible evolutionary trend. Wherever more than one measurement of W(H) are available we have plotted the mean value of those measurements. The error bars plotted for W(H) represent the dispersion in different measurements and are a measure of variability of H emission strength.
It can be seen from Fig. 7 that there is an overall decrease in the equivalent width of H emission line seen in HAeBe stars with their PMS age. Out of the 43 stars which show W(H) 20 , 84% have ages 3 Myr while 77% of the stars older than 3 Myr show W(H) 20 . The dashed line shown in the figure is an upper envelope to the distribution of W(H) with the ages of HAeBe stars and is of the functional form with and = 3 Myr. More than 83% of the data points fall below the line indicating that the strength of H emission in HAeBe stars decline relatively rapidly on a timescale of about 3 Myr.
Although there is an overall decrease in the H emission strength with age, there is a large spread in the equivalent widths at young ages ( 3 Myr). A significant fraction ( 41%) of the stars younger than 3 Myr show low H emission ( W(H) 20 ) and in 22% of these stars emission line activity appears to have weakened considerably ( W(H) 10 ) in about 3 Myr.
It is interesting to note from Fig 7 that though most stars seem to lose emission line activity by 3 - 5 Myr, there are a few relatively old stars with ages 10 Myr which show appreciable H equivalent widths (W(H) 5 ). H emission appear to persist for long ( 10 Myr) atleast in a few young stars.
In Fig 7 we have identified stars of different spectral types with solid brown circles representing B stars, black circles A stars and blue F stars. The distribution of equivalent width with age for stars of different spectral types show indications for a relatively faster evolution of emission line activity in B type stars as compared to A and F type stars. However, this could also be due to a selection effect since for a given emission line strength (assuming emission lines originate independent of the star) B type stars would have smaller equivalent widths than the late type stars because of the much stronger continuum levels in B stars.
We note here that determining the PMS age of a star by placing it on the HR diagram and comparing with the theoretical evolutionary tracks are prone to two different kinds of errors - random error introduced while converting the observables to stellar luminosity and systematic error due to the variation between the predictions of different theoretical evolutionary tracks (e.g. Hillenbrand 2005). By using a large sample for our analysis and obtaining multi-epoch photometry and best spectral type and distance estimates from the literature we have tried to minimize the random errors in the derived ages. However, systematic error mentioned above is hard to deal with and all evolutionary studies in literature suffer from this uncertainity. Nevertheless, even if we were to use different sets of PMS evolutionary tracks, the overall trend of the decline of emission line activity would still remain but the time in which the emission line activity falls significantly would be different by 20-50%.
4.3 Emission line - inner disk connection
In this section we present the results of our study on the connection between emission line activity and the inner disks of HAeBe stars. To characterise the inner disk we compiled the near-infrared (NIR) J, H, and magnitudes for our sample stars from the 2MASS All-Sky Point Source Catalogue. We have considered only those sources for which the 2MASS catalogue gives the optical association with a Tycho-2 star or an USNO star and the positional offset between the 2MASS source and the optical counterpart is 1 arcsec. Since the effective resolution of the 2MASS system is approximately 5 arcsec, only those 2MASS sources were included where the distance between the source and its nearest neighbor in the 2MASS PSC is 5 arcsec to avoid any source confiusion. Further, we picked up only those sources where the signal-to-noise ratio in J, H, and measurements is 10 and uncertainity in the magnitudes are 0.1 (2MASS photometric quality flag = A). Only those sources which are unaffected by known artifact or source confusion (Contamination and confusion flag = 0) are chosen. Also we have excluded sources which have extended source contamination flag set to non-zero values in the 2MASS catalogue. NIR J, H, and magnitudes obtained from the 2MASS catalogue for 62 HAeBe stars in our sample is listed in Table 5.
In our analysis we used H - K color excess to study the characteristics of inner disks.We computed intrinsic color excesses (H-K) due to thermal emission from the inner disk by subtracting the photospheric color and color due to interstellar and large scale circumstellar reddening from the observed colors. We used the photospheric colors corresponding to the spectral types from those given by Kenyon & Hartmann (1995). Since the NIR and optical colors in Kenyon & Hartmann (1995) are essentially in the Bessell & Brett (1988) system,all the observed colors are converted into that system. The intrinsic color excess (H-K) due to inner disks is defined as
where in calculating the reddening term we have used the relation from Cardelli et al. (1989) with the effective wavelengths for filters V, J, H & K taken from Bessell & Brett (1988). The last term on the rhs is the color contribution due to interstellar reddening. Intrinsic color excess (H-K) thus obtained and estimated error in excess are listed in Table 5.
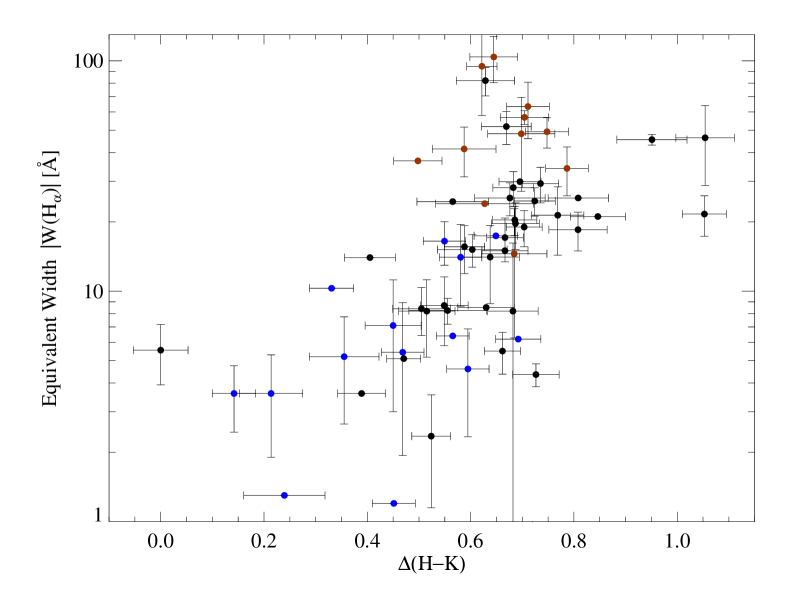
In Figure 8 we plot equivalent widths of H emission line W(H) against the color excess due to inner disk (H-K) for HAeBe stars. Clearly, W(H) is well correlated with (H-K). In general, stars with low emission line activity have smaller (H-K) excess and stars with strong emission line activity exhibit large (H-K). A Spearman’s rank test gives a of 0.6 with probabilities of being drawn from a random distribution of 1.2 10-6 implying a robust correlation between the H equivalent width and color excess due to inner disk (H-K). It is interesting to note that for most HAeBe stars (H-K) values are in a narrow range of 0.4 - 0.9 mag, quite similar to that seen in T Tauri stars (Meyer et al. 1997).
5 Discussion
We studied the evolution of emission line activity in HAeBe stars by following the evolution of the equivalent width of H emisison in them with the stellar age. Our results show that on average the emission line strength in these stars decreases with the increasing age during the PMS lifetimes of these stars. Additionally, we find that the strength of H emission falls substantially in relatively short timescales. The emission line strength decreases by a factor of more than 2 in as short a timescale as 3 Myr. However, we also find that in a few objects, emission line activity persists even at 10 Myr.
As discussed in Section 1, NIR studies of disk frequency in young clusters have shown that most young stars lose their inner disks in about 5 Myr (Haisch et al. 2001b; Hillenbrand 2005). In intermediate mass stars the inner disk dissipation is even faster with timescale as short as 3 Myr (Hernández et al. 2005; Haisch et al. 2001a). However, this is a trend for the fraction of stars still showing NIR excess. The nature of the excess itself is generally believed to be binary: either it is there, or it isn’t. Several authors have noted that there is a paucity of ‘transition’ objects with observational properties intermediate between disk-bearing young stars and disk-less ones (e.g Skrutskie et al. 1990; Hartmann et al. 2005; Andrews & Williams 2005). These results have led to the conclusion that the disks are dispersed very rapidly and that the dispersal process is stochastic in nature. Statistically, the disk dispersal time is estimated to be of the order of 105 yr (Skrutskie et al. 1990; Simon & Prato 1995; Wolk & Walter 1996). In short, these disk evolutionary studies point to a ‘two-timescale’ behaviour where the disks surrounding young stars are dispersed rapidly in 105 yr after a disk lifetime of a few Myr.
Most of the earlier disk evolution studies in the NIR (e.g. Haisch et al. 2001b; Hillenbrand 2005; Hernández et al. 2005) have concentrated on the trends in disk fractions in young clusters and associations with known ages. Our analysis is different from this in that we study the evolutionary trend among stars which have inner disks and show accretion signatures. We use the individual ages of the stars to follow the evolution of the strength of H emission, which is a measure of accretion activity. Our results indicate a gradual decrease in the strength of accretion activity with stellar age in HAeBe stars. This would hint at a relatively long-lived process being responsible for the cessation of accretion (and persumably for disk dissipation) in HAeBe stars.
Although there is an overall reduction in the strength of accretion with stellar age, our results also show that there is a large scatter at young ages with a significant fraction of stars in our sample with ages 3 Myr showing very low levels of accretion activity. In general, we find that accretion activity in most HAeBe stars has weakened considerably by 3 Myr. It is interesting to note that this timescale is quite comparable to the inner disk lifetimes derived for the intermediate mass stars from the NIR studies of disk frequencies (Hernández et al. 2005). Most intermediate mass stars lose their inner disks on a timescale similar to the one in which the accretion activity in HAeBe stars drops significantly.
It is possible to qualitatively understand our results within the framework of the ‘UV-switch’ model proposed recently to explain the ‘two-timescale’ behaviour of disk dissipation (Clarke 2001; Alexander et al. 2006a, b). This model couples photoevaporation of the outer disks to the viscous evolution of the disk. In the early phase of evolution, when the accretion rate through the disk is much larger than the mass loss rate due to photoevaporative wind, the wind has a negligible effect. At some point during the disk evolution the accretion rate falls to a level comparable to the mass-loss rate from the wind. Photoevaporation then becomes important, depriving the disk of resupply inside the gravitational radius Rg (see Alexander et al. 2006a). At this point, the inner disk drains on its own, short, viscous time-scale, giving a dispersal time much shorter than the disk life time. Thus, this model predicts that as long as accretion rate through the disks remain sufficiently high above the photoevaporative mass-loss rate, the inner disks survive around young stars. Our results show that on average accretion activity in HAeBe stars drops off steadily with increasing stellar age during the PMS evolution. This suggests that accretion is the relatively long-lived (a few Myr) mechanism which controls the disk lifetimes in young stars and that the disk dissipation is probably not stochastic in nature. We further show that the accretion activity in HAeBe stars drops siginificantly in 3 Myr. Most intermediate mass stars also appear to lose their inner disks on similar timescale (Hernández et al. 2005), supporting the idea that the rapid dispersal of the inner disk occurs when the accretion rate has dropped below the critical level.
Next, we discuss the correlation found in Figure 8. In recent years the spectral energy distributions (SEDs) of HAeBe stars have been successfully modelled as arising from passive irradiated disks with inner holes (Dullemond et al. 2001; Natta et al. 2001). In this framework, the mid- and far-IR emission arise in the flared outer regions of the disk. The inner rim of the disk, which is directly exposed to the stellar radiation, is heated very efficiently and is puffed up. Radiation from the inner surface of the rim, if located at the dust sublimation radius, can reproduce the shape and strength of the near-IR part of the SEDs (the NIR bump) of HAeBe stars. The relatively narrow range of (H-K) is supportive of such a scenario.
However, the correlation that we find between the excess color due to the inner disks (H-K) and an accretion indicator W(H) suggests that the disk is not entirely passive. The equivalent width of H is known to scale with normalized accretion luminosity (Lacc/L⋆) and (H-K) is the ratio of excess flux in K band to that in H band, ie.
The correlation found in Figure 2 then implies an increase in normalized accretion luminosity with an increase in the excess flux in the K band relative to that in the H band. The redness of NIR colors has been known to increase as the relative contribution from the NIR to the SED goes up in HAeBe and T Tauri stars (e.g. Corcoran & Ray 1998; Cabrit et al. 1990). Such a correlation between normalized accretion luminosity and excess (H-K) color is not necessarily expected if the excess emission in the NIR wavelengths is entirely due to disk irradiation. Accretion through the disks in HAeBe stars must also be responsible for the excess emission in the NIR.
However, it has been argued in literature that accretion alone cannot explain the observed SED in the NIR wavelengths. If the disk heating and thereby the excess is entirely due to the viscous dissipation in the disk, the required accretion rates to reproduce the observed NIR excess is relatively high ( ) (Hillenbrand et al. 1992; Lada & Adams 1992). Also, these accreting disks have to have an inner hole inorder to explain the lack of excess emission shortward of 2 (Hillenbrand et al. 1992). Hartmann et al. (1993) have pointed out that at such high accretion rates the innermost parts of disks will not remain optically thin as is required to explain the shape and strength of the NIR SED. Moreover, recent NIR interferometric observations of HAeBe stars have confirmed the presence of inner holes in HAeBe disks, suggesting that the accretion rates in HAeBe disks must be so as to keep the gas within the dust sublimation radius optically thin.
Our results suggests that even at the allowed low accretion rates, strength of NIR excess and level of disk accretion are related. We recall here that strong correlations between NIR colors and accretion indicators (e.g. W(H)) / outflow signatures (e.g. W([OI]) in HAeBe stars have been reported in the literature (e.g. Corcoran & Ray 1998; Ghandour et al. 1994) (albeit for smaller samples). Such correlations are difficult to explain within the framework of passive disks. Recently, passive disks with puffed up inner rim models have been invoked to explain the infrared and longer wavelength emission from T Tauri stars as well (e.g. Muzerolle et al. 2003; Cieza et al. 2005), although the correlaton between excess infrared colors and accretion luminosity is also found in these stars. This correlation is explained by adding accretion shock radiation also to the central heating source which effectively pushes the inner rim farther away from the star. Also, higher accretion rates increases the physical height of the dust rim as the vertical density structure is affected by the accretion rate (Muzerolle et al. 2004). Both these effects related to accretion increase the effective area of the surface of the inner rim from where the NIR excess emission arises. It is conceivable that such a mechanism is also acting in HAeBe stars even at relatively low accretion rates which keep the inner hole optically thin. This can explain the correlation that we find in Figure 2. However, detailed modelling and more quantitative analysis are required to confirm such a scenario.
6 Conclusions
In this paper we have studied the temporal evolution of emission line activity in intermediate mass PMS stars by compiling multi-epoch spectroscopic and photometric observations for a large sample of HAeBe stars. We find that, on average, the H emission line strength decreases with increasing stellar age in HAeBe stars, suggesting that the accretion activity gradually declines during the PMS phase. This would hint at a relatively long-lived ( a few Myr) process being responsible for the cessation of accretion in intermediate mass stars thereby implying that the evolution of accretion and disk dissipation is probably not entirely stochastic in nature. We also show that in most HAeBe stars the H emission has weakened considerably in 3 Myr, indicating that the accretion activity in them has dropped significantly. Most intermediate stars also appear to lose their inner disks on similar timescale, suggesting that inner disks dissipate rapidly after the accretion activity has fallen below certain level.
Futher, we find a relatively tight correlation between emission line strength and NIR excess due to inner disks in HAeBe stars. Such a correlation strongly suggests a physical connection between accretion activity and the strength of emission from the pufffed-up inner rim of the disks. We suggest that this correlation can be explained if the radiation from the accretion shock is also responsible for heating the inner rim of the disk. At higher accretion rates, more will be the contribution from the accretion shock radiation which will increase the effective surface area of the inner rim, thereby increasing the NIR excess emission.
References
- Acke & van den Ancker (2004) Acke, B. & van den Ancker, M. E. 2004, A&A, 426, 151
- Acke et al. (2005) Acke, B., van den Ancker, M. E., & Dullemond, C. P. 2005, A&A, 436, 209
- Alencar et al. (2003) Alencar, S. H. P., Melo, C. H. F., Dullemond, C. P., et al. 2003, A&A, 409, 1037
- Alexander et al. (2006a) Alexander, R. D., Clarke, C. J., & Pringle, J. E. 2006a, MNRAS, 369, 216
- Alexander et al. (2006b) Alexander, R. D., Clarke, C. J., & Pringle, J. E. 2006b, MNRAS, 369, 229
- Andrews & Williams (2005) Andrews, S. M. & Williams, J. P. 2005, ApJ, 631, 1134
- Baines et al. (2004) Baines, D., Oudmaijer, R. D., Mora, A., et al. 2004, MNRAS, 353, 697
- Beckwith (1999) Beckwith, S. V. W. 1999, in NATO ASIC Proc. 540: The Origin of Stars and Planetary Systems, 579
- Beckwith & Sargent (1996) Beckwith, S. V. W. & Sargent, A. I. 1996, Nature, 383, 139
- Berrilli et al. (1992) Berrilli, F., Corciulo, G., Ingrosso, G., et al. 1992, ApJ, 398, 254
- Beskrovnaya et al. (1999) Beskrovnaya, N. G., Pogodin, M. A., Miroshnichenko, A. S., et al. 1999, A&A, 343, 163
- Bessell (1983) Bessell, M. S. 1983, PASP, 95, 480
- Bessell & Brett (1988) Bessell, M. S. & Brett, J. M. 1988, PASP, 100, 1134
- Böhm & Catala (1994) Böhm, T. & Catala, C. 1994, A&A, 290, 167
- Böhm & Catala (1995) Böhm, T. & Catala, C. 1995, A&A, 301, 155
- Böhm & Hirth (1997) Böhm, T. & Hirth, G. A. 1997, A&A, 324, 177
- Cabrit et al. (1990) Cabrit, S., Edwards, S., Strom, S. E., & Strom, K. M. 1990, ApJ, 354, 687
- Calvet et al. (2004) Calvet, N., Muzerolle, J., Briceño, C., et al. 2004, AJ, 128, 1294
- Cardelli et al. (1989) Cardelli, J. A., Clayton, G. C., & Mathis, J. S. 1989, ApJ, 345, 245
- Cieza et al. (2005) Cieza, L. A., Kessler-Silacci, J. E., Jaffe, D. T., Harvey, P. M., & Evans, II, N. J. 2005, ApJ, 635, 422
- Clarke (2001) Clarke, C. J. 2001, in IAU Symposium, 346–353
- Cohen & Kuhi (1979) Cohen, M. & Kuhi, L. V. 1979, ApJS, 41, 743
- Corcoran & Ray (1998) Corcoran, M. & Ray, T. P. 1998, A&A, 331, 147
- Coulson & Walther (1995) Coulson, I. M. & Walther, D. M. 1995, MNRAS, 274, 977
- de Winter et al. (2001) de Winter, D., van den Ancker, M. E., Maira, A., et al. 2001, A&A, 380, 609
- Dullemond et al. (2001) Dullemond, C. P., Dominik, C., & Natta, A. 2001, ApJ, 560, 957
- Dunkin & Crawford (1998) Dunkin, S. K. & Crawford, I. A. 1998, MNRAS, 298, 275
- Eisner et al. (2003) Eisner, J. A., Lane, B. F., Akeson, R. L., Hillenbrand, L. A., & Sargent, A. I. 2003, ApJ, 588, 360
- Eisner et al. (2004) Eisner, J. A., Lane, B. F., Hillenbrand, L. A., Akeson, R. L., & Sargent, A. I. 2004, ApJ, 613, 1049
- ESA (1997) ESA. 1997, The Hipparcos and Tycho Catalogues (ESA 1997), 1239
- Finkenzeller & Mundt (1984) Finkenzeller, U. & Mundt, R. 1984, A&AS, 55, 109
- Fujii et al. (2002) Fujii, T., Nakada, Y., & Parthasarathy, M. 2002, A&A, 385, 884
- Ghandour et al. (1994) Ghandour, L., Strom, S., Edwards, S., & Hillenbrand, L. 1994, in ASP Conf. Ser. 62: The Nature and Evolutionary Status of Herbig Ae/Be Stars, 223
- Gorti & Bhatt (1993) Gorti, U. & Bhatt, H. C. 1993, A&A, 270, 426
- Haisch et al. (2001a) Haisch, K. E., Lada, E. A., & Lada, C. J. 2001a, AJ, 121, 2065
- Haisch et al. (2001b) Haisch, K. E., Lada, E. A., & Lada, C. J. 2001b, ApJ, 553, L153
- Hamaguchi et al. (2005) Hamaguchi, K., Yamauchi, S., & Koyama, K. 2005, ApJ, 618, 360
- Hamann (1994) Hamann, F. 1994, ApJS, 93, 485
- Hamann & Persson (1992) Hamann, F. & Persson, S. E. 1992, ApJS, 82, 285
- Hartmann (1998) Hartmann, L. 1998, Accretion processes in star formation (Cambridge, UK ; New York : Cambridge University Press, 1998. (Cambridge astrophysics series ; 32))
- Hartmann et al. (1994) Hartmann, L., Hewett, R., & Calvet, N. 1994, ApJ, 426, 669
- Hartmann et al. (1993) Hartmann, L., Kenyon, S. J., & Calvet, N. 1993, ApJ, 407, 219
- Hartmann et al. (2005) Hartmann, L., Megeath, S. T., Allen, L., et al. 2005, ApJ, 629, 881
- Herbig (1960) Herbig, G. H. 1960, ApJS, 4, 337
- Herbig & Bell (1988) Herbig, G. H. & Bell, K. R. 1988, Catalog of emission line stars of the orion population : 3 : 1988 (Lick Observatory Bulletin, Santa Cruz: Lick Observatory, —c1988)
- Herbst & Racine (1976) Herbst, W. & Racine, R. 1976, AJ, 81, 840
- Herbst & Shevchenko (1999) Herbst, W. & Shevchenko, V. S. 1999, AJ, 118, 1043
- Herbst et al. (1982) Herbst, W., Warner, J. W., Miller, D. P., & Herzog, A. 1982, AJ, 87, 98
- Hernández et al. (2004) Hernández, J., Calvet, N., Briceño, C., Hartmann, L., & Berlind, P. 2004, AJ, 127, 1682
- Hernández et al. (2005) Hernández, J., Calvet, N., Hartmann, L., et al. 2005, AJ, 129, 856
- Hillenbrand (2002) Hillenbrand, L. A. 2002, astro-ph/0210520
- Hillenbrand (2005) Hillenbrand, L. A. 2005, ArXiv Astrophysics e-prints
- Hillenbrand et al. (1992) Hillenbrand, L. A., Strom, S. E., Vrba, F. J., & Keene, J. 1992, ApJ, 397, 613
- Høg et al. (2000) Høg, E., Fabricius, C., Makarov, V. V., et al. 2000, A&A, 355, L27
- Hubrig et al. (2004) Hubrig, S., Schöller, M., & Yudin, R. V. 2004, A&A, 428, L1
- Kawamura et al. (1998) Kawamura, A., Onishi, T., Yonekura, Y., et al. 1998, ApJS, 117, 387
- Kenyon & Hartmann (1995) Kenyon, S. J. & Hartmann, L. 1995, ApJS, 101, 117
- Koenigl (1991) Koenigl, A. 1991, ApJ, 370, L39
- Kutner et al. (1980) Kutner, M. L., Machnik, D. E., Tucker, K. D., & Dickman, R. L. 1980, ApJ, 237, 734
- Lada & Adams (1992) Lada, C. J. & Adams, F. C. 1992, ApJ, 393, 278
- Lahulla (1985) Lahulla, J. F. 1985, A&AS, 61, 537
- Leinert et al. (1997) Leinert, C., Richichi, A., & Haas, M. 1997, A&A, 318, 472
- Leinert et al. (2004) Leinert, C., van Boekel, R., Waters, L. B. F. M., et al. 2004, A&A, 423, 537
- Malfait et al. (1998) Malfait, K., Bogaert, E., & Waelkens, C. 1998, A&A, 331, 211
- Mannings & Sargent (1997) Mannings, V. & Sargent, A. I. 1997, ApJ, 490, 792
- Mannings & Sargent (2000) Mannings, V. & Sargent, A. I. 2000, ApJ, 529, 391
- Meyer et al. (1997) Meyer, M. R., Calvet, N., & Hillenbrand, L. A. 1997, AJ, 114, 288
- Millan-Gabet et al. (2001) Millan-Gabet, R., Schloerb, F. P., & Traub, W. A. 2001, ApJ, 546, 358
- Miroshnichenko et al. (2001a) Miroshnichenko, A. S., Bjorkman, K. S., Chentsov, E. L., et al. 2001a, A&A, 377, 854
- Miroshnichenko et al. (2004) Miroshnichenko, A. S., Gray, R. O., Klochkova, V. G., Bjorkman, K. S., & Kuratov, K. S. 2004, A&A, 427, 937
- Miroshnichenko et al. (2001b) Miroshnichenko, A. S., Levato, H., Bjorkman, K. S., & Grosso, M. 2001b, A&A, 371, 600
- Monnier et al. (2005) Monnier, J. D., Millan-Gabet, R., Billmeier, R., et al. 2005, ApJ, 624, 832
- Mora et al. (2001) Mora, A., Merín, B., Solano, E., et al. 2001, A&A, 378, 116
- Muzerolle et al. (1998) Muzerolle, J., Calvet, N., & Hartmann, L. 1998, ApJ, 492, 743
- Muzerolle et al. (2001) Muzerolle, J., Calvet, N., & Hartmann, L. 2001, ApJ, 550, 944
- Muzerolle et al. (2003) Muzerolle, J., Calvet, N., Hartmann, L., & D’Alessio, P. 2003, ApJ, 597, L149
- Muzerolle et al. (2004) Muzerolle, J., D’Alessio, P., Calvet, N., & Hartmann, L. 2004, ApJ, 617, 406
- Natta et al. (2000) Natta, A., Grinin, V., & Mannings, V. 2000, Protostars and Planets IV, 559
- Natta et al. (2001) Natta, A., Prusti, T., Neri, R., et al. 2001, A&A, 371, 186
- Ohashi & Lin (2005) Ohashi, N. & Lin, S. 2005, in ASP Conf. Ser. 344: The Cool Universe: Observing Cosmic Dawn, 168–+
- Oudmaijer et al. (2001) Oudmaijer, R. D., Palacios, J., Eiroa, C., et al. 2001, A&A, 379, 564
- Palla & Stahler (1993) Palla, F. & Stahler, S. W. 1993, ApJ, 418, 414
- Piétu et al. (2003) Piétu, V., Dutrey, A., & Kahane, C. 2003, A&A, 398, 565
- Preibisch (2003) Preibisch, T. 2003, A&A, 401, 543
- Reipurth et al. (1996) Reipurth, B., Pedrosa, A., & Lago, M. T. V. T. 1996, A&AS, 120, 229
- Shevchenko et al. (1999) Shevchenko, V. S., Ezhkova, O. V., Ibrahimov, M. A., van den Ancker, M. E., & Tjin A Djie, H. R. E. 1999, MNRAS, 310, 210
- Shevchenko & Yakubov (1989) Shevchenko, V. S. & Yakubov, S. D. 1989, Soviet Astronomy, 33, 370
- Simon & Prato (1995) Simon, M. & Prato, L. 1995, ApJ, 450, 824
- Skrutskie et al. (1990) Skrutskie, M. F., Dutkevitch, D., Strom, S. E., et al. 1990, AJ, 99, 1187
- Strom et al. (1989) Strom, K. M., Strom, S. E., Edwards, S., Cabrit, S., & Skrutskie, M. F. 1989, AJ, 97, 1451
- Strom et al. (1993) Strom, S. E., Edwards, S., & Skrutskie, M. F. 1993, in Protostars and Planets III, 837–866
- Strom et al. (1972) Strom, S. E., Strom, K. M., Yost, J., Carrasco, L., & Grasdalen, G. 1972, ApJ, 173, 353
- Terranegra et al. (1994) Terranegra, L., Chavarria-K., C., Diaz, S., & Gonzalez-Patino, D. 1994, A&AS, 104, 557
- Testi et al. (1998) Testi, L., Palla, F., & Natta, A. 1998, A&AS, 133, 81
- Thé et al. (1994) Thé, P. S., de Winter, D., & Perez, M. R. 1994, A&AS, 104, 315
- Uchida & Shibata (1985) Uchida, Y. & Shibata, K. 1985, PASJ, 37, 515
- van Boekel et al. (2005) van Boekel, R., Min, M., Waters, L. B. F. M., et al. 2005, A&A, 437, 189
- van den Ancker et al. (2004) van den Ancker, M. E., Blondel, P. F. C., Tjin A Djie, H. R. E., et al. 2004, MNRAS, 349, 1516
- van den Ancker et al. (1998) van den Ancker, M. E., de Winter, D., & Tjin A Djie, H. R. E. 1998, A&A, 330, 145
- Vieira et al. (2003) Vieira, S. L. A., Corradi, W. J. B., Alencar, S. H. P., et al. 2003, AJ, 126, 2971
- Vink et al. (2002) Vink, J. S., Drew, J. E., Harries, T. J., & Oudmaijer, R. D. 2002, MNRAS, 337, 356
- Vink et al. (2005) Vink, J. S., Drew, J. E., Harries, T. J., Oudmaijer, R. D., & Unruh, Y. 2005, MNRAS, 359, 1049
- Wade et al. (2005) Wade, G. A., Drouin, D., Bagnulo, S., et al. 2005, A&A, 442, L31
- Weinberger et al. (2002) Weinberger, A. J., Becklin, E. E., Schneider, G., et al. 2002, ApJ, 566, 409
- Wolk & Walter (1996) Wolk, S. J. & Walter, F. M. 1996, AJ, 111, 2066
- Yonekura et al. (1997) Yonekura, Y., Dobashi, K., Mizuno, A., Ogawa, H., & Fukui, Y. 1997, ApJS, 110, 21


| Object Name | V | B-V | R | ref | Sp. Type | ref | distance | ref |
|---|---|---|---|---|---|---|---|---|
| mag | mag | mag | pc | |||||
| LkHa 198 | 14.18 | 0.95 | 13.00 | 1 | B9 | 4 | 600 | 11 |
| V376 Cas | 15.55 | 1.13 | 14.25 | 1 | B5e | 19 | 630 | 19 |
| VX Cas | 11.28 | 0.32 | 10.92 | 1 | A0 | 4 | 760 | 11 |
| BD+61 154 | 10.58 | 0.56 | 9.82 | 1 | B8 | 31 | 650 | 7 |
| HBC 334 | 14.52 | 0.57 | 13.74 | 3 | B3 | 4 | 1600 | 11 |
| IP Per | 10.47 | 0.33 | 10.14 | 14 | A6 | 4 | 350 | 31 |
| XY Per | 9.21 | 0.49 | 8.72 | 1 | A5 | 4 | 160 | 8 |
| V892 Tau | 15.17 | 1.48 | 13.06 | 1 | B8 | 4 | 160 | 11 |
| AB Aur | 7.05 | 0.12 | 6.85 | 1 | A1 | 4 | 144 | 5 |
| HD 31648 | 7.70 | 0.20 | 7.53 | 37 | A3Ve | 19 | 131 | 5 |
| UX Ori | 10.40 | 0.33 | 10.02 | 1 | A3 | 4 | 340 | 6 |
| HD 34282 | 9.89 | 0.16 | 9.74 | 37 | A0 | 25 | 164 | 5 |
| HD 35187 | 8.17 | 0.22 | 99.99 | 2 | A2e+A7 | 9 | 150 | 9 |
| CO Ori | 10.67 | 1.10 | 9.68 | 1 | F7Ve | 32 | 450 | 15 |
| HD 35929 | 8.13 | 0.42 | 7.76 | 37 | F2III | 16 | 345 | 16 |
| HD 36112 | 8.34 | 0.26 | 8.07 | 39 | A5IVe | 6 | 205 | 5 |
| HK Ori | 11.71 | 0.56 | 11.00 | 1 | A4+G1V | 36 | 460 | 35 |
| HD 244604 | 9.38 | 0.19 | 9.07 | 37 | A0Vesh | 42 | 336 | 27 |
| RY Ori | 11.89 | 0.89 | 11.00 | 37 | F7 | 4 | 460 | 4 |
| HBC 442 | 10.13 | 0.60 | 9.63 | 3 | F8 | 4 | 460 | 4 |
| HD 245185 | 9.94 | 0.10 | 9.84 | 37 | A1 | 4 | 400 | 11 |
| T Ori | 10.64 | 0.56 | 10.09 | 1 | A0 | 4 | 460 | 4 |
| HD 36910 | 10.26 | 0.79 | 9.51 | 1 | F3 | 4 | 100 | 5 |
| V380 Ori | 10.49 | 0.54 | 9.68 | 1 | A1e | 6 | 510 | 6 |
| V586 Ori | 9.75 | 0.13 | 9.55 | 1 | A0V | 27 | 510 | 27 |
| BF Ori | 10.69 | 0.35 | 10.31 | 37 | A2IVe | 32 | 430 | 17 |
| HD 245906 | 10.58 | 0.39 | 99.99 | 2 | A6 | 4 | 2000 | 18 |
| RR Tau | 12.08 | 0.75 | 11.32 | 1 | A0 | 4 | 800 | 11 |
| V350 Ori | 11.47 | 0.48 | 11.02 | 37 | A1 | 4 | 460 | 4 |
| HD 37806 | 7.95 | 0.04 | 7.84 | 37 | A2Vpe | 6 | 470 | 6 |
| HD 38120 | 9.01 | 0.06 | 8.88 | 25 | B9 | 25 | 460 | 10 |
| HD 250550 | 9.54 | 0.07 | 9.34 | 1 | B9 | 4 | 700 | 11 |
| LkHa 208 | 11.65 | 0.44 | 11.16 | 1 | A7 | 4 | 1000 | 11 |
| Lkha 338 | 15.12 | 0.94 | 99.99 | 4 | B9 | 4 | 830 | 20 |
| Lkha 339 | 13.65 | 0.84 | 12.77 | 1 | A1 | 4 | 830 | 20 |
| VY Mon | 13.47 | 1.55 | 11.74 | 1 | B8 | 11 | 800 | 11 |
| LkHa 215 | 10.54 | 0.54 | 9.87 | 1 | B6 | 4 | 800 | 22 |
| HD 259431 | 8.73 | 0.27 | 8.21 | 1 | B6 | 4 | 800 | 11 |
| R Mon | 12.14 | 0.72 | 11.13 | 1 | B8IIIe | 32 | 800 | 11 |
| HBC 217 | 11.95 | 0.56 | 11.50 | 3 | F7 | 4 | 910 | 4 |
| LkHa 25 | 12.77 | 0.20 | 12.44 | 1 | B7 | 4 | 800 | 11 |
| HBC 222 | 11.97 | 0.60 | 11.53 | 3 | F7 | 4 | 910 | 4 |
| LkHa 218 | 11.87 | 0.43 | 11.46 | 1 | A0 | 4 | 1050 | 23 |
| Z CMa | 9.47 | 1.27 | 8.32 | 1 | B0IIIe | 33 | 1050 | 23 |
| HBC 551 | 11.81 | 0.26 | 11.42 | 1 | B8 | 4 | 1050 | 23 |
| NX Pup | 9.98 | 0.47 | 9.37 | 37 | A7 | 24 | 450 | 24 |
| HD 68695 | 9.82 | 0.10 | 9.71 | 25 | A0V | 25 | 600 | 25 |
| HD 85567 | 8.54 | 0.14 | 8.22 | 37 | B2 | 26 | 1500 | 26 |
| HD 95881 | 8.23 | 0.14 | 99.99 | 2 | A0 | 25 | 118 | 6 |
| HD 97048 | 8.46 | 0.36 | 8.08 | 1 | B9.5Ve | 6 | 175 | 5 |
| HD 98922 | 6.76 | 0.05 | 6.65 | 37 | B9 | 25 | 1000 | 25 |
| HD 100453 | 7.78 | 0.29 | 7.50 | 25 | A9Ve | 6 | 112 | 5 |
| HD 100546 | 6.73 | 0.03 | 6.64 | 37 | B9Vne | 6 | 103 | 5 |
| HD 101412 | 9.25 | 0.18 | 9.06 | 37 | B9.5V | 6 | 160 | 27 |
| HD 104237 | 6.55 | 0.24 | 6.30 | 37 | A4IVe | 6 | 116 | 5 |
| HD 135344 | 8.63 | 0.51 | 8.16 | 43 | F4Ve | 6 | 140 | 6 |
| HD 139614 | 8.40 | 0.24 | 8.18 | 25 | A7Ve | 6 | 140 | 6 |
| HD 141569 | 7.10 | 0.10 | 6.98 | 37 | A0Ve | 32 | 99 | 5 |
| HD 142666 | 8.67 | 0.50 | 8.20 | 25 | A8Ve | 32 | 145 | 6 |
| HD 142527 | 8.34 | 0.71 | 99.99 | 2 | F7IIIe | 6 | 198 | 5 |
| HD 144432 | 8.17 | 0.36 | 7.81 | 37 | A9IVe | 32 | 145 | 6 |
| HR 5999 | 6.85 | 0.33 | 6.54 | 37 | A7 | 25 | 208 | 5 |
| HD 150193 | 8.64 | 0.49 | 8.14 | 1 | A2IVe | 32 | 150 | 5 |
| AK Sco | 9.00 | 0.63 | 8.48 | 1 | F5IVe | 34 | 145 | 5 |
| KK Oph | 11.45 | 0.71 | 10.51 | 1 | A8Ve | 32 | 160 | 28 |
| 51 Oph | 4.78 | 0.03 | 4.72 | 37 | B9.5IIIe | 32 | 131 | 5 |
| HD 163296 | 6.88 | 0.09 | 6.77 | 1 | A1Vep | 32 | 122 | 5 |
| HD 169142 | 8.15 | 0.28 | 7.86 | 25 | A5Ve | 6 | 145 | 6 |
| VV Ser | 11.92 | 0.93 | 10.82 | 1 | B6 | 4 | 330 | 27 |
| AS 310 | 12.45 | 1.06 | 11.30 | 1 | B1 | 4 | 2500 | 11 |
| R CrA | 12.20 | 1.09 | 10.62 | 1 | A0 | 25 | 130 | 27 |
| T CrA | 12.84 | 1.18 | 11.84 | 1 | F0 | 17 | 130 | 27 |
| HD 179218 | 7.39 | 0.08 | 7.29 | 25 | A0IVe | 32 | 244 | 5 |
| HD 344361 | 10.74 | 0.44 | 10.33 | 1 | A3 | 4 | 440 | 27 |
| PX Vul | 11.54 | 0.83 | 10.96 | 41 | F3 | 4 | 420 | 22 |
| V1295 Aql | 7.73 | 0.13 | 7.66 | 41 | A2IVe | 32 | 290 | 29 |
| BD+40 4124 | 10.69 | 0.78 | 9.64 | 1 | B3 | 4 | 980 | 4 |
| V1686 Cyg | 14.07 | 1.44 | 12.59 | 1 | F9 | 4 | 980 | 27 |
| LkHa 134 | 11.35 | 0.66 | 10.57 | 1 | B2 | 24 | 700 | 24 |
| LkHA 168 | 13.48 | 1.26 | 12.28 | 1 | F6III | 44 | 700 | 44 |
| HD 200775 | 7.37 | 0.41 | 6.86 | 1 | B3 | 4 | 429 | 5 |
| Lkha 324 | 12.65 | 1.12 | 11.58 | 1 | B8 | 4 | 780 | 4 |
| V645 Cyg | 13.47 | 1.10 | 12.29 | 1 | A0 | 24 | 3500 | 27 |
| V361 Cep | 10.18 | 0.39 | 9.64 | 1 | B4 | 4 | 1250 | 30 |
| LkHa 234 | 12.21 | 0.90 | 11.22 | 1 | B7 | 4 | 1250 | 30 |
| BD+46 3471 | 10.13 | 0.40 | 9.67 | 1 | A0 | 4 | 1200 | 27 |
| BH Cep | 11.16 | 0.65 | 10.63 | 1 | F5 | 4 | 450 | 4 |
| BO Cep | 11.60 | 0.56 | 11.06 | 1 | F4 | 4 | 400 | 4 |
| SV Cep | 10.98 | 0.39 | 10.56 | 1 | A0 | 4 | 440 | 27 |
| LkHa 233 | 13.56 | 0.84 | 12.67 | 1 | A4 | 4 | 880 | 11 |
| MWC 1080 | 11.52 | 1.34 | 9.99 | 1 | B0eq | 31 | 2200 | 27 |
References. — (1) Herbst & Shevchenko (1999); (2) Høg et al. (2000); (3) Herbig & Bell (1988); (4) Hernández et al. (2004); (5) ESA (1997); (6) van Boekel et al. (2005); (7) van den Ancker et al. (1998); (8) Berrilli et al. (1992); (9) Dunkin & Crawford (1998); (10) Hernández et al. (2005); (11) Testi et al. (1998); (12) Yonekura et al. (1997); (13) Preibisch (2003); (14) Miroshnichenko et al. (2001a); (15) Calvet et al. (2004); (16) Miroshnichenko et al. (2004); (17) Hamaguchi et al. (2005); (18) Kawamura et al. (1998); (19) Acke & van den Ancker (2004); (20) Herbst & Racine (1976) ; (21) Kutner et al. (1980); (22) Herbst et al. (1982); (23) Shevchenko et al. (1999); (24) Corcoran & Ray (1998) (25) Vieira et al. (2003); (26) Miroshnichenko et al. (2001b); (27) Acke et al. (2005); (28) Leinert et al. (2004); (29) Eisner et al. (2004); (30) Shevchenko & Yakubov (1989); (31) Hillenbrand et al. (1992); (32) Mora et al. (2001); (33) van den Ancker et al. (2004); (34) Alencar et al. (2003); (35) Leinert et al. (1997);(36) Baines et al. (2004); (37) de Winter et al. (2001); (38) Lahulla (1985); (39) Beskrovnaya et al. (1999); (40) Fujii et al. (2002); (41) Oudmaijer et al. (2001); (42) Malfait et al. (1998); (43) Coulson & Walther (1995); (44) Terranegra et al. (1994).
| Object | RA (J2000) | Dec (J2000) | Date | Spectrograph/ | UT start | Exp. time |
|---|---|---|---|---|---|---|
| hh mm ss.s | dd mm ss | (yy-mm-dd) | Telescope | (hh:mm) | (s) | |
| BD+61 154 | 00 43 18.2 | +61 54 40 | 2003-10-22 | HFOSC/HCT | 18:20 | 300 |
| IP Per | 03 40 46.9 | +32 31 53 | 2003-10-22 | HFOSC/HCT | 19:12 | 300 |
| XY Per | 03 49 36.3 | +38 58 55 | 2003-01-27 | OMR/VBT | 13:42 | 600 |
| AB Aur | 04 55 45.8 | +30 33 04 | 2003-10-24 | HFOSC/HCT | 18:38 | 30 |
| HD 31648 | 04 58 46.2 | +29 50 36 | 2002-11-29 | OMR/VBT | 18:30 | 300 |
| UX Ori | 05 04 29.9 | -03 47 14 | 2001-03-14 | OMR/VBT | 14:01 | 900 |
| HD 34282 | 05 16 00.4 | -09 48 35 | 2002-11-29 | OMR/VBT | 20:48 | 900 |
| HD 35187 | 05 24 01.1 | +24 57 37 | 2004-01-14 | HFOSC/HCT | 15:11 | 600 |
| HD 35929 | 05 27 42.7 | -08 19 38 | 2003-10-22 | HFOSC/HCT | 20:40 | 210 |
| HD 36112 | 05 30 27.5 | +25 19 57 | 2003-01-28 | OMR/VBT | 14:16 | 300 |
| HK Ori | 05 31 28.0 | +12 09 10 | 2005-02-07 | OMR/VBT | 16:23 | 1800 |
| HD 245185 | 05 35 09.6 | +10 01 51 | 2005-02-05 | OMR/VBT | 17:30 | 1800 |
| HD 37806 | 05 41 02.2 | -02 43 00 | 2003-01-28 | OMR/VBT | 15:41 | 600 |
| HD 38120 | 05 43 11.8 | -04 59 49 | 2003-10-22 | HFOSC/HCT | 21:25 | 390 |
| HD 250550 | 06 01 59.9 | +16 30 56 | 2005-02-07 | OMR/VBT | 19:36 | 1200 |
| HD 259431 | 06 33 05.1 | +10 19 19 | 2003-10-24 | HFOSC/HCT | 22:58 | 150 |
| LkHa 218 | 07 02 42.5 | -11 26 11 | 2005-02-07 | OMR/VBT | 20:18 | 1800 |
| Z CMa | 07 03 43.1 | -11 33 06 | 2003-01-27 | OMR/VBT | 18:15 | 420 |
| NX Pup | 07 19 28.2 | -44 35 11 | 2000-01-20 | OMR/VBT | 18:00 | 900 |
| HD 68695 | 08 11 44.5 | -44 05 08 | 2005-03-15 | OMR/VBT | 13:54 | 2400 |
| HD 85567 | 09 50 28.5 | -60 58 02 | 2003-01-25 | OMR/VBT | 19:50 | 900 |
| HD 98922 | 11 22 31.6 | -53 22 11 | 2002-04-09 | OMR/VBT | 16:56 | 600 |
| HD 100453 | 11 33 05.5 | -54 19 28 | 2003-01-28 | OMR/VBT | 20:34 | 900 |
| HD 101412 | 11 39 44.4 | -60 10 27 | 2005-03-15 | OMR/VBT | 17:38 | 2400 |
| HD 139614 | 15 40 46.3 | -42 29 53 | 2005-03-15 | OMR/VBT | 18:54 | 2400 |
| HD 141569 | 15 49 57.7 | -03 55 16 | 2002-05-19 | OMR/VBT | 18:19 | 300 |
| HD 142666 | 15 56 40.0 | -22 01 40 | 2005-03-15 | OMR/VBT | 20:22 | 900 |
| HD 142527 | 15 56 41.8 | -42 19 23 | 2002-04-09 | OMR/VBT | 19:45 | 900 |
| HD 144432 | 16 06 57.9 | -27 43 09 | 2002-05-19 | OMR/VBT | 18:36 | 600 |
| HR 5999 | 16 08 34.2 | -39 06 18 | 2002-05-19 | OMR/VBT | 18:59 | 600 |
| HD 150193 | 16 40 17.9 | -23 53 45 | 2002-04-11 | OMR/VBT | 21:01 | 600 |
| AK Sco | 16 54 44.8 | -36 53 18 | 2002-04-09 | OMR/VBT | 20:21 | 1800 |
| KK Oph | 17 10 08.0 | -27 15 18 | 2003-05-30 | OMR/VBT | 18:46 | 1800 |
| 51 Oph | 17 31 24.9 | -23 57 45 | 2002-05-19 | OMR/VBT | 19:22 | 180 |
| HD 163296 | 17 56 21.2 | -21 57 21 | 2002-05-19 | OMR/VBT | 20:41 | 600 |
| VV Ser | 18 28 47.8 | +00 08 40 | 2003-05-30 | OMR/VBT | 20:06 | 1800 |
| R CrA | 19 01 53.6 | -36 57 07 | 2006-05-06 | OMR/VBT | 21:05 | 1800 |
| T CrA | 19 01 58.7 | -36 57 49 | 2006-05-06 | OMR/VBT | 20:23 | 1800 |
| HD 179218 | 19 11 11.2 | +15 47 15 | 2003-10-24 | HFOSC/HCT | 15:13 | 300 |
| V1295 Aql | 20 03 02.5 | +05 44 16 | 2002-05-19 | OMR/VBT | 22:36 | 600 |
| BD+40 4124 | 20 20 28.2 | +41 21 51 | 2002-05-19 | OMR/VBT | 23:01 | 600 |
| HD 200775 | 21 01 36.9 | +68 09 47 | 2003-10-22 | HFOSC/HCT | 15:18 | 30 |
| BD+46 3471 | 21 52 34.0 | +47 13 43 | 2003-10-22 | HFOSC/HCT | 15:57 | 210 |
| BO Cep | 22 16 54.0 | +70 03 45 | 2003-10-22 | HFOSC/HCT | 16:32 | 450 |
| MWC 1080 | 23 17 25.5 | +60 50 43 | 2004-10-24 | OMR/VBT | 19:20 | 600 |
| Object Name | log Teff | E(B-V) | RV | AV | log L⋆ | Mass | Age |
|---|---|---|---|---|---|---|---|
| K | mag | mag | mag | (L⊙) | (M⊙) | Myr | |
| LkHa 198 | 4.02 | 1.01 | 6.44 | 6.27 | 2.49 | 4.25 | 0.21 |
| V376 Cas | 4.19 | 1.27 | 5.68 | 6.95 | 2.64 | 4.62 | 0.38 |
| VX Cas | 3.98 | 0.32 | 5.62 | 1.73 | 1.96 | 3.00 | 1.12 |
| BD+61 154 | 4.08 | 0.65 | 6.69 | 4.19 | 3.29 | 5.11 | 0.01 |
| HBC 334 | 4.27 | 0.76 | 6.16 | 4.51 | 3.07 | 5.99 | 0.01 |
| IP Per | 3.92 | 0.17 | 4.67 | 0.76 | 1.15 | 2.00 | 6.27 |
| XY Per | 3.91 | 0.35 | 4.68 | 1.57 | 1.31 | 2.00 | 5.24 |
| V892 Tau | 4.08 | 1.57 | 7.90 | 11.99 | 3.35 | 5.11 | 0.01 |
| AB Aur | 3.97 | 0.09 | 10.29 | 0.90 | 1.84 | 2.77 | 1.74 |
| HD 31648 | 3.94 | 0.11 | 1.56 | 0.16 | 1.18 | 1.99 | 7.42 |
| UX Ori | 3.94 | 0.24 | 6.11 | 1.41 | 1.43 | 2.09 | 4.76 |
| HD 34282 | 3.98 | 0.16 | 3.66 | 0.56 | 0.71 | 2.08 | 7.81 |
| HD 35187 | 3.95 | 0.16 | 5.00 | 0.77 | 1.37 | 2.00 | 5.60 |
| CO Ori | 3.80 | 0.60 | 4.35 | 2.51 | 2.00 | 3.58 | 0.12 |
| HD 35929 | 3.84 | 0.07 | 5.00 | 0.34 | 1.90 | 3.41 | 0.31 |
| HD 36112 | 3.91 | 0.12 | 4.48 | 0.52 | 1.45 | 2.17 | 4.17 |
| HK Ori | 3.93 | 0.44 | 7.61 | 3.23 | 1.89 | 3.01 | 0.96 |
| HD 244604 | 3.98 | 0.19 | 9.21 | 1.69 | 1.99 | 3.05 | 1.05 |
| RY Ori | 3.80 | 0.39 | 6.13 | 2.30 | 1.45 | 2.49 | 1.77 |
| HBC 442 | 3.79 | 0.08 | 5.00 | 0.38 | 1.39 | 2.41 | 2.14 |
| HD 245185 | 3.97 | 0.07 | 5.00 | 0.34 | 1.35 | 2.07 | 6.48 |
| T Ori | 3.98 | 0.56 | 4.71 | 2.54 | 2.10 | 3.34 | 0.67 |
| HD 36910 | 3.83 | 0.42 | 4.39 | 1.77 | 0.55 | 1.38 | 20.17 |
| V380 Ori | 3.97 | 0.51 | 8.93 | 4.41 | 2.97 | 4.93 | 0.01 |
| V586 Ori | 3.98 | 0.13 | 8.12 | 1.02 | 1.94 | 3.00 | 1.14 |
| BF Ori | 3.95 | 0.29 | 5.40 | 1.51 | 1.57 | 2.50 | 2.72 |
| HD 245906 | 3.92 | 0.23 | 5.00 | 1.11 | 2.76 | 4.84 | 0.01 |
| RR Tau | 3.98 | 0.75 | 5.03 | 3.62 | 2.44 | 4.26 | 0.13 |
| V350 Ori | 3.97 | 0.45 | 4.26 | 1.84 | 1.46 | 2.22 | 4.33 |
| HD 37806 | 3.95 | 0.00 | 5.00 | 0.00 | 2.14 | 3.58 | 0.37 |
| HD 38120 | 4.02 | 0.12 | 5.78 | 0.67 | 2.09 | 3.12 | 1.06 |
| HD 250550 | 4.02 | 0.13 | 9.31 | 1.17 | 2.44 | 4.13 | 0.25 |
| LkHa 208 | 3.89 | 0.25 | 6.69 | 1.61 | 1.93 | 3.24 | 0.63 |
| Lkha 338 | 4.02 | 1.00 | 5.00 | 4.81 | 1.81 | 2.60 | 2.44 |
| Lkha 339 | 3.97 | 0.81 | 5.32 | 4.15 | 2.02 | 3.18 | 0.86 |
| VY Mon | 4.08 | 1.64 | 5.65 | 8.92 | 4.20 | 5.11 | 0.01 |
| LkHa 215 | 4.15 | 0.67 | 5.83 | 3.76 | 3.47 | 5.43 | 0.01 |
| HD 259431 | 4.15 | 0.40 | 8.62 | 3.34 | 4.03 | 5.43 | 0.01 |
| R Mon | 4.08 | 0.81 | 7.24 | 5.66 | 3.43 | 5.11 | 0.01 |
| HBC 217 | 3.80 | 0.06 | 5.00 | 0.29 | 1.21 | 2.13 | 3.50 |
| LkHa 25 | 4.11 | 0.31 | 6.64 | 1.98 | 1.80 | 3.35 | 1.57 |
| HBC 222 | 3.80 | 0.10 | 5.00 | 0.48 | 1.28 | 2.23 | 3.07 |
| LkHa 218 | 3.98 | 0.43 | 4.40 | 1.82 | 2.04 | 3.16 | 0.92 |
| Z CMa | 4.48 | 1.57 | 3.69 | 5.55 | 5.63 | 6.00 | 0.01 |
| HBC 551 | 4.08 | 0.35 | 6.47 | 2.18 | 2.41 | 3.92 | 0.45 |
| NX Pup | 3.89 | 0.28 | 9.01 | 2.44 | 2.24 | 4.07 | 0.05 |
| HD 68695 | 3.98 | 0.10 | 4.35 | 0.42 | 1.81 | 2.64 | 2.14 |
| HD 85567 | 4.34 | 0.36 | 6.43 | 2.23 | 4.66 | 6.00 | 0.01 |
| HD 95881 | 3.98 | 0.14 | 5.00 | 0.67 | 1.14 | 2.08 | 7.81 |
| HD 97048 | 4.02 | 0.42 | 4.39 | 1.77 | 1.91 | 3.00 | 1.37 |
| HD 98922 | 4.02 | 0.11 | 5.13 | 0.54 | 3.61 | 4.95 | 0.01 |
| HD 100453 | 3.87 | 0.02 | 5.00 | 0.10 | 0.96 | 1.66 | 10.03 |
| HD 100546 | 4.02 | 0.09 | 5.13 | 0.44 | 1.61 | 2.50 | 3.46 |
| HD 101412 | 4.02 | 0.24 | 3.50 | 0.81 | 1.13 | 2.39 | 5.02 |
| HD 104237 | 3.93 | 0.12 | 5.13 | 0.59 | 1.71 | 2.58 | 2.06 |
| HD 135344 | 3.82 | 0.12 | 3.17 | 0.36 | 0.93 | 1.69 | 8.93 |
| HD 139614 | 3.89 | 0.05 | 5.00 | 0.24 | 0.97 | 1.75 | 11.87 |
| HD 141569 | 3.98 | 0.10 | 5.13 | 0.49 | 1.36 | 2.18 | 6.65 |
| HD 142666 | 3.88 | 0.27 | 4.26 | 1.10 | 1.23 | 2.00 | 5.09 |
| HD 142527 | 3.80 | 0.21 | 5.00 | 1.01 | 1.62 | 2.90 | 0.86 |
| HD 144432 | 3.87 | 0.09 | 5.13 | 0.44 | 1.17 | 2.00 | 5.30 |
| HR 5999 | 3.89 | 0.14 | 4.01 | 0.54 | 2.06 | 3.55 | 0.30 |
| HD 150193 | 3.95 | 0.43 | 4.95 | 2.05 | 1.69 | 2.50 | 2.40 |
| AK Sco | 3.81 | 0.21 | 1.76 | 0.35 | 0.82 | 1.50 | 10.51 |
| KK Oph | 3.88 | 0.48 | 8.85 | 4.11 | 1.41 | 2.17 | 3.93 |
| 51 Oph | 4.02 | 0.09 | 2.52 | 0.22 | 2.51 | 4.29 | 0.20 |
| HD 163296 | 3.97 | 0.06 | 5.13 | 0.30 | 1.53 | 2.49 | 3.00 |
| HD 169142 | 3.91 | 0.14 | 4.57 | 0.61 | 1.26 | 2.00 | 5.42 |
| VV Ser | 4.15 | 1.06 | 5.87 | 5.99 | 3.04 | 5.43 | 0.01 |
| AS 310 | 4.40 | 1.32 | 4.78 | 6.06 | 5.21 | 6.00 | 0.01 |
| R CrA | 3.98 | 1.09 | 8.48 | 8.94 | 2.94 | 4.94 | 0.01 |
| T CrA | 3.86 | 0.87 | 3.60 | 3.00 | 0.23 | 1.45 | 22.81 |
| HD 179218 | 3.98 | 0.08 | 5.13 | 0.39 | 1.99 | 3.04 | 1.06 |
| HD 344361 | 3.94 | 0.35 | 4.01 | 1.35 | 1.49 | 2.35 | 3.48 |
| PX Vul | 3.83 | 0.46 | 0.86 | 0.38 | 0.72 | 1.50 | 14.31 |
| V1295 Aql | 3.95 | 0.07 | 5.00 | 0.34 | 1.94 | 3.03 | 1.00 |
| BD+40 4124 | 4.27 | 0.97 | 6.42 | 6.00 | 4.78 | 5.99 | 0.01 |
| V1686 Cyg | 3.79 | 0.89 | 6.10 | 5.22 | 2.41 | 3.46 | 0.17 |
| LkHa 134 | 4.34 | 0.88 | 5.13 | 4.34 | 3.72 | 6.00 | 0.01 |
| LkHA 168 | 3.80 | 0.80 | 4.94 | 3.79 | 1.77 | 3.30 | 0.36 |
| HD 200775 | 4.27 | 0.60 | 5.00 | 2.88 | 4.14 | 5.99 | 0.01 |
| Lkha 324 | 4.08 | 1.21 | 4.36 | 5.06 | 2.96 | 5.11 | 0.01 |
| V645 Cyg | 3.98 | 1.10 | 5.56 | 5.88 | 4.07 | 4.94 | 0.01 |
| V361 Cep | 4.23 | 0.55 | 5.98 | 3.17 | 3.96 | 5.81 | 0.01 |
| LkHa 234 | 4.11 | 1.01 | 5.29 | 5.13 | 3.67 | 5.29 | 0.01 |
| BD+46 3471 | 3.98 | 0.40 | 5.91 | 2.28 | 3.03 | 4.94 | 0.01 |
| BH Cep | 3.81 | 0.23 | 1.72 | 0.38 | 0.95 | 1.73 | 8.21 |
| BO Cep | 3.82 | 0.17 | 4.67 | 0.76 | 0.82 | 1.50 | 11.25 |
| SV Cep | 3.98 | 0.39 | 5.33 | 2.00 | 1.71 | 2.50 | 2.54 |
| LkHa 233 | 3.93 | 0.72 | 5.56 | 3.85 | 1.97 | 3.19 | 0.76 |
| MWC 1080 | 4.48 | 1.64 | 5.23 | 8.24 | 6.53 | 6.00 | 0.01 |
| Object Name | H equivalent width () | |||||
|---|---|---|---|---|---|---|
| This work | HB88 | Her04 | CR98 | AVD05 | BPL96 | |
| LkHa 198 | … | -85.00 | -56.20 | -40.50 | … | … |
| V376 Cas | … | -37.00 | -22.00 | -33.40 | -29.70 | … |
| VX Cas | … | -20.00 | -19.20 | … | -12.90 | … |
| BD+61 154 | -68.00 | -78.00 | … | -44.10 | … | … |
| HBC 334 | … | … | -0.20 | … | … | … |
| IP Per | -16.60 | … | -21.40 | … | … | … |
| XY Per | -6.30 | … | -4.70 | … | … | … |
| V892 Tau | … | -13.00 | -17.80 | -20.60 | … | … |
| AB Aur | -44.00 | -27.00 | -28.20 | -26.30 | -54.00 | … |
| HD 31648 | -22.50 | … | … | … | -18.30 | … |
| UX Ori | -5.10 | -20.00 | -2.30 | … | … | -5.40 |
| HD 34282 | -4.00 | … | … | … | -4.70 | … |
| HD 35187 | -5.10 | … | … | … | … | … |
| CO Ori | … | -10.00 | … | … | … | -4.20 |
| HD 35929 | -2.40 | … | … | … | -4.80 | … |
| HD 36112 | -14.50 | … | … | … | -19.70 | … |
| HK Ori | -51.00 | -56.00 | -49.00 | -63.10 | … | -40.20 |
| HD 244604 | … | … | … | … | -15.00 | … |
| RY Ori | … | -3.40 | -7.00 | … | … | … |
| HBC 442 | … | … | -1.30 | … | … | … |
| HD 245185 | -25.50 | … | -21.20 | … | -29.50 | … |
| T Ori | … | -16.00 | -21.00 | … | … | … |
| HD 36910 | … | … | -6.20 | … | … | … |
| V380 Ori | … | -81.00 | … | -71.00 | … | -94.20 |
| V586 Ori | … | -16.00 | … | … | -17.10 | -12.40 |
| BF Ori | … | -10.00 | -6.70 | -3.70 | -9.30 | -11.30 |
| HD 245906 | … | … | -3.60 | … | … | … |
| RR Tau | … | -33.00 | -25.70 | … | … | … |
| V350 Ori | … | … | -29.90 | … | … | … |
| HD 37806 | -25.40 | … | … | … | … | … |
| HD 38120 | -24.00 | … | … | … | … | … |
| HD 250550 | -37.60 | -40.00 | -24.80 | … | … | … |
| LkHa 208 | … | -8.00 | -4.90 | … | … | … |
| Lkha 338 | … | -55.00 | -51.00 | … | … | … |
| Lkha 339 | … | -19.00 | -19.40 | … | … | … |
| VY Mon | … | -50.00 | -28.00 | … | … | … |
| LkHa 215 | … | -25.00 | -25.70 | -26.70 | … | … |
| HD 259431 | -62.00 | -55.00 | -57.50 | -52.90 | … | … |
| R Mon | … | -85.00 | … | -93.10 | … | -47.00 |
| HBC 217 | … | … | -10.30 | … | … | … |
| LkHa 25 | … | -47.00 | -47.30 | -58.20 | … | … |
| HBC 222 | … | … | -1.20 | … | … | … |
| LkHa 218 | -26.50 | -22.00 | -32.30 | -31.90 | … | … |
| Z CMa | -106.00 | -10.00 | … | -24.80 | -45.20 | -20.90 |
| HBC 551 | … | -44.00 | -54.50 | … | … | … |
| NX Pup | -44.00 | … | … | -44.20 | … | -48.30 |
| HD 68695 | -8.50 | … | … | … | … | … |
| HD 85567 | -42.00 | … | … | … | … | … |
| HD 95881 | … | … | … | … | -21.10 | … |
| HD 97048 | … | -30.00 | … | -51.10 | -36.00 | -48.70 |
| HD 98922 | -27.00 | … | … | … | -27.90 | … |
| HD 100453 | -0.80 | … | … | … | 1.50 | … |
| HD 100546 | … | … | … | … | -36.80 | … |
| HD 101412 | -8.70 | … | … | … | -20.40 | … |
| HD 104237 | … | … | … | … | -24.50 | … |
| HD 135344 | … | … | … | … | -17.40 | … |
| HD 139614 | -7.00 | … | … | … | -9.80 | … |
| HD 141569 | -4.40 | … | … | … | -6.70 | … |
| HD 142666 | -1.50 | … | … | … | -3.20 | … |
| HD 142527 | -10.20 | … | … | … | -17.90 | … |
| HD 144432 | -7.50 | … | … | … | -9.00 | … |
| HR 5999 | -5.70 | -7.00 | … | … | -11.00 | -10.00 |
| HD 150193 | -11.20 | … | … | -7.80 | -5.00 | -10.70 |
| AK Sco | -4.10 | … | … | … | -9.40 | -2.80 |
| KK Oph | -59.10 | -22.00 | -59.40 | -44.90 | … | … |
| 51 Oph | -1.50 | … | … | … | … | … |
| HD 163296 | -22.10 | … | … | -22.50 | -14.50 | … |
| HD 169142 | … | … | … | … | -14.00 | … |
| VV Ser | -46.80 | -22.00 | -61.10 | -31.80 | -81.30 | -46.50 |
| AS 310 | … | -5.00 | -7.70 | … | … | … |
| R CrA | -85.50 | … | … | … | -44.30 | -102.00 |
| T CrA | -15.10 | … | … | … | -10.70 | -18.60 |
| HD 179218 | -13.00 | … | … | … | -18.20 | … |
| HD 344361 | … | -30.00 | -14.40 | … | -24.00 | -17.10 |
| PX Vul | … | … | -6.40 | … | … | … |
| V1295 Aql | -22.20 | … | … | … | -27.10 | … |
| BD+40 4124 | -120.00 | -94.00 | -108.00 | -31.80 | -119.90 | … |
| V1686 Cyg | … | … | -3.60 | … | -17.60 | … |
| LkHa 134 | … | … | … | -31.54 | … | … |
| LkHA 168 | … | -14.00 | -19.00 | … | … | … |
| HD 200775 | -61.00 | -35.00 | -59.30 | -17.70 | -74.60 | … |
| Lkha 324 | … | … | -15.30 | … | … | … |
| V645 Cyg | … | … | … | -57.40 | -121.70 | … |
| V361 Cep | … | -36.00 | -28.00 | -12.70 | … | … |
| LkHa 234 | … | -44.00 | -68.90 | -52.10 | … | … |
| BD+46 3471 | -21.10 | -20.00 | -18.60 | -19.70 | -21.70 | … |
| BH Cep | … | -3.00 | -6.20 | … | … | … |
| BO Cep | -4.00 | -4.50 | -2.30 | … | … | … |
| SV Cep | … | -20.00 | -12.10 | … | -10.10 | … |
| LkHa 233 | … | -18.00 | -20.50 | -26.40 | … | … |
| MWC 1080 | -124.00 | -75.00 | … | -94.20 | -122.80 | … |
| Object Name | 2MASS | eΔ(H-K) | ||||
|---|---|---|---|---|---|---|
| Designation | mag | mag | mag | mag | mag | |
| BD+61 154 | 00431825+6154402 | 8.14 | 6.92 | 5.90 | 0.71 | 0.04 |
| IP Per | 03404696+3231537 | 9.14 | 8.41 | 7.59 | 0.70 | 0.03 |
| XY Per | 03493638+3858556 | 7.65 | 6.92 | 6.09 | 0.66 | 0.03 |
| HD 31648 | 04584626+2950370 | 6.87 | 6.26 | 5.53 | 0.69 | 0.04 |
| UX Ori | 05042998-0347142 | 8.71 | 8.04 | 7.21 | 0.68 | 0.05 |
| HD 34282 | 05160047-0948353 | 9.26 | 8.47 | 7.68 | 0.73 | 0.05 |
| HD 35187 | 05240118+2457370 | 6.95 | 6.48 | 5.91 | 0.47 | 0.03 |
| CO Ori | 05273833+1125389 | 7.98 | 7.21 | 6.51 | 0.45 | 0.05 |
| HD 35929 | 05274279-0819386 | 7.21 | 6.97 | 6.67 | 0.21 | 0.06 |
| HD 36112 | 05302753+2519571 | 7.22 | 6.56 | 5.80 | 0.67 | 0.04 |
| HK Ori | 05312805+1209102 | 9.41 | 8.31 | 7.34 | 0.67 | 0.05 |
| HD 244604 | 05315724+1117414 | 8.61 | 7.96 | 7.12 | 0.67 | 0.04 |
| RY Ori | 05320993-0249467 | 9.44 | 8.88 | 8.28 | 0.36 | 0.07 |
| HBC 442 | 05341416-0536542 | 8.99 | 8.63 | 8.28 | 0.24 | 0.08 |
| HD 245185 | 05350960+1001515 | 9.29 | 8.76 | 8.02 | 0.68 | 0.07 |
| T Ori | 05355043-0528349 | 8.27 | 7.24 | 6.22 | 0.81 | 0.06 |
| HD 36910 | 05355845+2444542 | 7.93 | 7.06 | 6.17 | 0.69 | 0.04 |
| V380 Ori | 05362543-0642577 | 8.11 | 6.96 | 5.95 | 0.63 | 0.06 |
| V586 Ori | 05365925-0609164 | 8.95 | 8.41 | 7.69 | 0.60 | 0.07 |
| BF Ori | 05371326-0635005 | 9.11 | 8.56 | 7.90 | 0.52 | 0.05 |
| HD 245906 | 05393048+2619552 | 9.13 | 8.51 | 7.98 | 0.39 | 0.05 |
| RR Tau | 05393051+2622269 | 9.69 | 8.42 | 7.39 | 0.74 | 0.04 |
| V350 Ori | 05401176-0942110 | 10.02 | 9.24 | 8.37 | 0.70 | 0.04 |
| HD 37806 | 05410229-0243006 | 7.12 | 6.25 | 5.40 | 0.81 | 0.06 |
| HD 38120 | 05431188-0459499 | 8.43 | 7.85 | 7.16 | 0.63 | 0.09 |
| HD 250550 | 06015998+1630567 | 8.47 | 7.53 | 6.63 | 0.79 | 0.04 |
| HD 259431 | 06330519+1019199 | 7.45 | 6.67 | 5.73 | 0.70 | 0.05 |
| HBC 217 | 06404218+0933374 | 10.76 | 10.28 | 9.84 | 0.33 | 0.04 |
| HBC 222 | 06405118+0944461 | 10.74 | 10.23 | 9.67 | 0.45 | 0.04 |
| LkHa 218 | 07024252-1126118 | 10.26 | 9.42 | 8.58 | 0.68 | 0.04 |
| HBC 551 | 07040669-1126084 | 10.76 | 10.02 | 9.12 | 0.75 | 0.04 |
| NX Pup | 07192826-4435114 | 8.58 | 7.29 | 6.08 | 0.95 | 0.07 |
| HD 68695 | 08114457-4405087 | 9.35 | 8.78 | 8.08 | 0.63 | 0.05 |
| HD 95881 | 11015764-7130484 | 7.38 | 6.66 | 5.73 | 0.85 | 0.05 |
| HD 97048 | 11080329-7739174 | 7.27 | 6.67 | 5.94 | 0.59 | 0.06 |
| HD 100453 | 11330559-5419285 | 6.95 | 6.39 | 5.60 | 0.72 | 0.05 |
| HD 100546 | 11332542-7011412 | 6.42 | 5.96 | 5.42 | 0.50 | 0.05 |
| HD 101412 | 11394445-6010278 | 8.63 | 8.22 | 7.47 | 0.68 | 0.06 |
| HD 104237 | 12000511-7811346 | 5.81 | 5.25 | 4.58 | 0.57 | 0.07 |
| HD 135344 | 15154844-3709160 | 7.28 | 6.59 | 5.84 | 0.65 | 0.04 |
| HD 139614 | 15404638-4229536 | 7.67 | 7.33 | 6.75 | 0.50 | 0.06 |
| HD 141569 | 15495775-0355162 | 6.87 | 6.86 | 6.82 | 0.00 | 0.05 |
| HD 142666 | 15564002-2201400 | 7.35 | 6.74 | 6.08 | 0.52 | 0.04 |
| HD 142527 | 15564188-4219232 | 6.50 | 5.71 | 4.98 | 0.58 | 0.04 |
| HD 144432 | 16065795-2743094 | 7.09 | 6.54 | 5.89 | 0.56 | 0.07 |
| HD 150193 | 16401792-2353452 | 6.95 | 6.21 | 5.48 | 0.55 | 0.05 |
| AK Sco | 16544485-3653185 | 7.68 | 7.06 | 6.50 | 0.47 | 0.04 |
| KK Oph | 17100811-2715190 | 9.07 | 7.23 | 5.79 | 1.05 | 0.06 |
| HD 163296 | 17562128-2157218 | 6.20 | 5.53 | 4.78 | 0.69 | 0.05 |
| HD 169142 | 18242978-2946492 | 7.31 | 6.91 | 6.41 | 0.41 | 0.05 |
| VV Ser | 18284786+0008397 | 8.67 | 7.43 | 6.32 | 0.70 | 0.07 |
| HD 179218 | 19111124+1547155 | 6.99 | 6.64 | 6.00 | 0.59 | 0.04 |
| HD 344361 | 19255874+2112313 | 9.09 | 8.18 | 7.28 | 0.77 | 0.05 |
| PX Vul | 19264025+2353508 | 9.32 | 8.55 | 7.91 | 0.57 | 0.03 |
| V1295 Aql | 20030250+0544166 | 7.19 | 6.65 | 5.86 | 0.72 | 0.04 |
| BD+40 4124 | 20202825+4121514 | 7.90 | 6.79 | 5.77 | 0.62 | 0.03 |
| LkHA 168 | 20520604+4417160 | 10.27 | 9.23 | 8.34 | 0.55 | 0.04 |
| BH Cep | 22014287+6944364 | 9.69 | 8.99 | 8.31 | 0.59 | 0.04 |
| BO Cep | 22165406+7003450 | 10.32 | 9.85 | 9.58 | 0.14 | 0.04 |
| SV Cep | 22213319+7340270 | 9.35 | 8.56 | 7.74 | 0.64 | 0.06 |
| LkHa 233 | 22344101+4040045 | 11.29 | 10.31 | 8.92 | 1.05 | 0.04 |
| MWC 1080 | 23172558+6050436 | 7.46 | 5.98 | 4.83 | 0.64 | 0.05 |