3C254: MERLIN observations of a highly asymmetric quasar
Abstract
Multifrequency, high-resolution radio observations of the quasar 3C254 using MERLIN are presented. The quasar has a highly asymmetric radio structure, with the eastern component of the double-lobed structure being much closer to the nucleus and significantly less polarized than the western one. However, the two lobes are more symmetric in their total flux densities. The observations show the detailed structure of the hotspots which are very different on opposite sides of the radio core, reveal no radio jet and suggest that the oppositely-directed jets may be intrinsically asymmetric.
keywords:
galaxies: active - galaxies: jets - galaxies: nuclei - galaxies: individual: 3C254 - radio continuum: galaxies1 Introduction
The majority of high-luminosity extragalactic radio sources selected at a low frequency tend to be symmetric in the brightness and location of the components relative to the nucleus of the parent galaxy. However, a small but significant fraction are highly asymmetric. The asymmetries of the lobes of emission are important because they could provide useful insights into the environments of sources (e.g. Pedelty et al. 1989; McCarthy, van Breugel & Kapahi 1991), the interaction of jets with external clouds or galaxies, and also provide tests of the orientation-based unified scheme for radio galaxies and quasars (Barthel 1989). For example, the structure of the highly-asymmetric double-lobed source B0500+630 appears to be inconsistent with the unified scheme and suggests that there is an intrinsic asymmetry in the oppositely-directed jets from the nucleus (Saikia et al. 1996). The most extreme form of asymmetry is when the source is completely one-sided with radio emission on only one side of the nucleus. Although most of these objects are core-dominated and their apparent asymmetry is likely to be due to bulk relativisitic motions in the extended lobes of emission, there does appear to be a number of weak-cored one-sided sources which are difficult to reconcile with the simple relativistic beaming scenario (Saikia et al. 1990).
As part of a study of highly asymmetric radio sources, the quasar 3C254 has been observed at radio wavelengths with high resolution using MERLIN. The results of these observations are presented in this paper. 3C254 is identified with a quasar at a redshift of 0.736120.00160 (NASA Extragalactic Database) so that 1 arcsec corresponds to 7.290 kpc (Ho=71 km s-1 Mpc-1, =0.27, =0.73, Spergel et al. 2003).
The radio source has an overall angular extent of 13.5 arcsec (98 kpc) with the eastern component being much closer to the nucleus. The ratio of the separations of the outer hotspots, rD, defined to be 1, is 7.1 while the flux density ratio of the corresponding lobes from the MERLIN L-band images presented here is 0.55. Earlier Very Large Array (VLA) and MERLIN observations with lower resolution have shown the highly asymmetric structure and a bridge of emission connecting the two lobes (e.g. Owen & Puschell 1984; Liu & Pooley 1991; Liu, Pooley & Riley 1992; Reid et al. 1995). The observations by Liu & Pooley have also shown that the eastern lobe is more depolarized, and has a steeper spectrum, consistent with the relationship reported by them that the more depolarized lobe tends to have a steeper radio spectrum. This relationship is significantly stronger for smaller sources, but is similar for both radio galaxies and quasars suggesting that, in addition to Doppler effects, there are intrinsic differences between the lobes on opposite sides (cf. Ishwara-Chandra et al. 2001). The large separation ratio, the distortion in the eastern lobe and the stronger depolarization all suggest that the jet on the eastern side is colliding with a dense gas cloud which is influencing the properties and appearance of the radio source.
Evidence of the gas clouds has been reported by Forbes et al. (1990) who found this steep-spectrum quasar to be embedded in a spectacular, extended, emission-line region emitting strongly in [Oii] 3727 and [Oiii] 5007. Forbes et al. have also suggested that the emitting gas is at high pressure, consistent with confinement by a hot intracluster medium. Subsequent observations have shown that the optical continuum and line emission are extended along the radio axis (Bremer 1997; Crawford & Vanderriest 1997), illustrating the so-called alignment effect which is seen in powerful radio galaxies. Bremer also shows that part of the extended emission line region which is close to the eastern lobe has a blueshift of 650 km s-1 relative to the nuclear emission along a position angle of 105∘. There is also an overdensity of galaxies within approximately 10 arcsec of the quasar, suggesting that 3C254 lies at the centre of a compact group of galaxies. High-resolution X-ray observations with the Chandra Observatory show X-ray emission from the quasar and the western hotspot, and demonstrate that the source does not lie in a hot, massive cluster (Donahue, Daly & Horner 2003).

In this paper, high-resolution MERLIN observations at L- and C-bands are presented. These observations were made to examine the structure and asymmetry of the hotspots on opposite sides and determine any possible intrinsic asymmetry in the oppositely-directed jets. The observations and analyses of the data are described in Section 2, and the results are presented in Section 3. Possible explanations for the structure are discussed in Section 4, while the conclusions are summarised in Section 5.
2 Observations and analyses
The MERLIN observations described in this section have been made at L- and C-band frequencies. The observations have been made at different frequencies within each band, and at C-band the data have also been combined with VLA data to improve the uv-coverage and thus the resulting images. The flux calibration source for the observations within both bands was 3C286, its flux densities at the differing frequencies being calculated from the values given in the VLA calibrator source catalogue, which is based on the work of Baars et al. (1977). The flux densities of the point source baseline calibrators (DA193 for the L-band observations; OQ208 for the C-band observations) have been determined from a comparison of their MERLIN short-spacing amplitudes with those of 3C286. 3C286 is assumed to have a position angle for its linear polarization of 32.4 degrees. The phase reference source used for all the observations was B1115+416. Its J2000 position, obtained from the Interferometer Phase Calibration Source list I of Patnaik et al. (1992), is 11:17:53.33390 +41:20:16.2761. The processing of the data was carried out using Jodrell Bank data editing and calibration software and the MERLIN pipeline, the latter using Astronomical Image Processing Software AIPS tasks.
2.1 L-band observations
As indicated above, in order to improve the uv coverage and also to determine the polarization properties at two neighbouring L-band frequencies, 3C254 was observed with MERLIN at 1420 MHz and 1658 MHz on 3rd March 1996. Seven MERLIN telescopes were configured in the array, which included the Wardle telescope just prior to its decommissioning and which therefore provided a minimum baseline length of 6 km in comparison with a minimum of 12 km at the present time. The observing frequency was switched between the two frequencies every 6 minutes and the observing cycle times between the target source (3C254) and its phase-reference (including telescope drive times) were in the ratio of 7.5:4.5. This resulted in 3.5 minutes on 3C254 at each frequency within the total 12 minute cycle time. 3C254 and its phase-reference were observed for a total of 17 hours in all four polarizations (LL, LR, RL and RR), resulting in 5 hours actually on source at each frequency. The flux densities of 3C286 which were used at 1658 MHz and 1420 MHz were 13.639 Jy and 14.733 Jy respectively. A final total-intensity image was produced at a mean ‘effective’ frequency of 1539 MHz after scaling both the 1658 MHz and 1420 MHz data appropriately before combination. Polarisation images were produced at the two individual frequencies of 1420 MHz and 1658 MHz.
2.2 C-band observations
3C254 was observed with MERLIN at the C-Band frequencies 4562 and 4874 MHz on 24, 25 and 26 November 2002. The total on-source integration times at the two frequencies were different and considerably less than a quarter of the total elapsed time as a result of system failures and the necessity to edit out data in which ionospherically induced, very high phase rates occurred. The observing frequency was switched every 10 minutes, with cycle times for observations of 3C254 and its phase reference at each frequency being in the ratio of 6.5 to 3.5, giving 6 minutes on 3C254 for each ten minute period. As for the L-band observations, 3C254 and its phase-reference were observed in all four polarizations and the total time on-source at each frequency was 6 hours over the total observing period. Total-intensity and polarization images were produced at the same resolution for the two frequencies. The flux densities of 3C286 which were used at 4562 MHz and 4874 MHz were 7.807 Jy and 7.494 Jy respectively, although a correction had to be made to the data to take account of the fact that 3C286 is 4% resolved even on the shortest MERLIN baseline (12 km) at C-band frequencies. The data at the lower frequency were appropriately scaled to take account of the source spectral index and combined with that at the higher frequency to produce a combined image at an effective frequency of 4874 MHz. Finally, calibrated VLA data at a frequency of 4885 MHz, kindly provided by J. Riley and G. Pooley, were re-imaged and appropriately scaled and combined with the MERLIN data to produce a MERLIN+VLA image at 4874 MHz.
3 Discussion
Some of the observational parameters and observed values from the radio observations are summarised in Table 1.
3.1 The overall radio structure
Earlier observations of 3C254 with an angular resolution of approximately 0.31 arcsec show the two prominent lobes located very asymmetrically on opposite sides of the quasar, a weak nucleus and a cigar-shaped bridge of emission connecting the two outer lobes (e.g. Owen & Pushell 1984; Liu & Pooley 1991; Reid et al. 1995). The overall structure is reminescent of 3C459, a highly asymmetric radio galaxy with a starburst which has been observed as part of this study of very asymmetric radio sources (Thomasson, Saikia & Muxlow 2003).
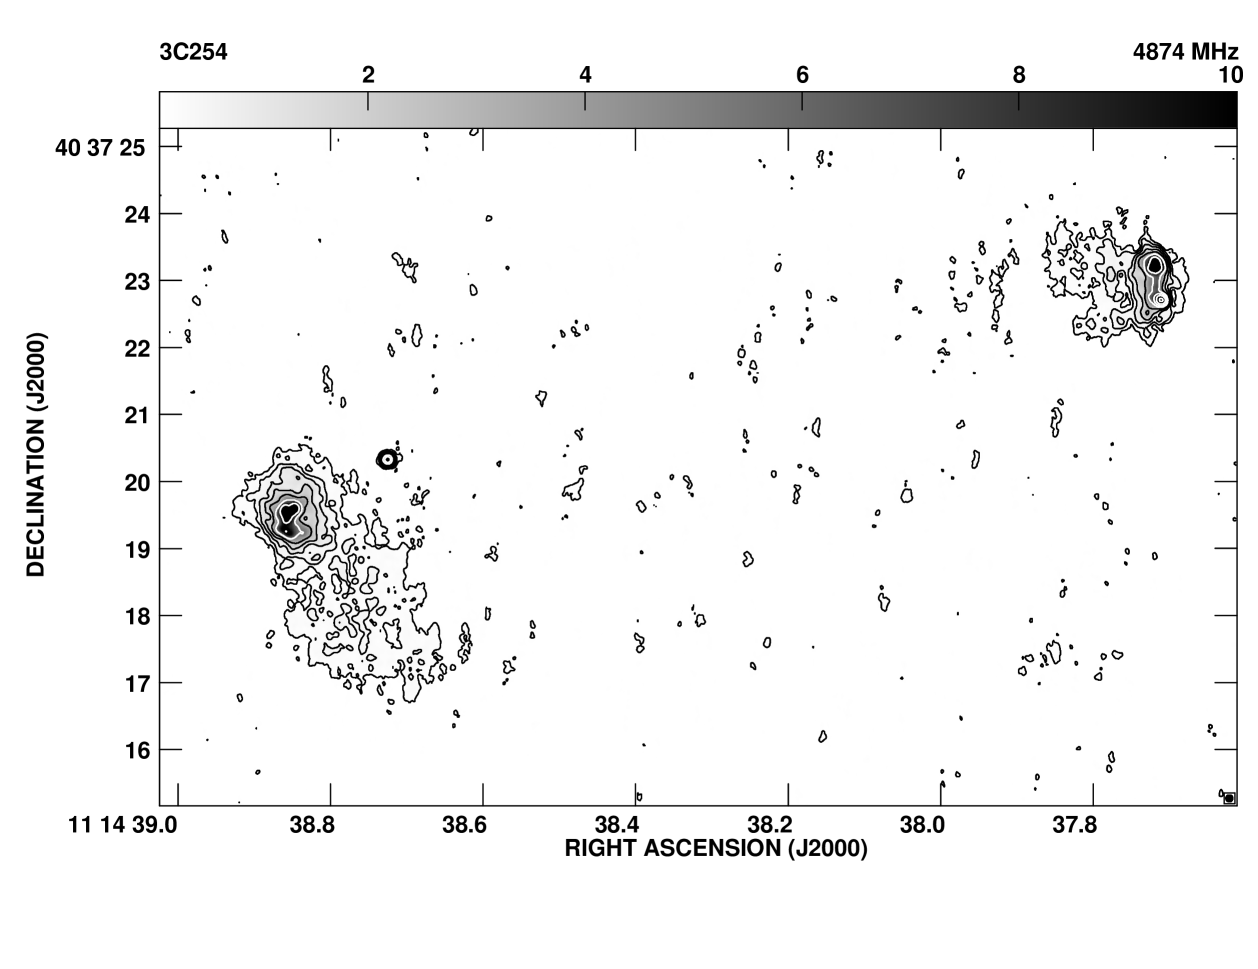
The MERLIN image of 3C254 at 1539 MHz with an angular resolution of 0.17 arcsec (Fig. 1), shows the well-known double-lobed structure and the central component. In addition, it reveals further details of the structure of the hotspots and the lobes of extended emission in both the western and eastern lobes. The western lobe consists of two hotspots, the primary and more compact one being towards the south. The secondary hotspot and the diffuse emission from the lobe lies north of the axis joining thc core to the primary hotspot. The peak of emission on the eastern lobe appears to be less compact than the primary hotspot on the western lobe, with the lobe emission being extended towards the south-west.
The western lobe is more strongly polarized with the peak in the hotspot being 20% polarized at 1420 MHz. There is no significant polarization from the peak of emission in the eastern lobe, the 3 upper limit being 0.4%, but there does appear to be polarized emission along the eastern rim of the diffuse ‘tail’. However, the magnitude of this is very uncertain as it is only just above the noise level and requires confirmation from more sensitive observations (Fig. 2). Fig. 3 shows the MERLIN images of both the lobes of emission at 1658 MHz with an angular resolution of 0.15 arcsec and with the polarization vectors superimposed on them. As in the images at 1420 MHz, the hotspots in the western lobe show significant polarization while there is no significant polarized signal from the peak of emission in the eastern lobe, the upper limit being 0.6%, although, once again, there is an indication of polarized emission along the eastern rim of the diffuse ‘tail’. The degree of polarization in the peak of emission in the western lobe is 23%.


| Observational parameters | Observed properties | |||||||||||||
| Telescope | Freq. | Resolution | Cmp | RA(J2000) | Dec(J2000) | Sp | St | |||||||
| maj. | min. | PA | ||||||||||||
| MHz | ′′ | ′′ | ∘ | mJy/b | h | m | s | ∘ | ′ | ′′ | mJy/b | mJy | ||
| (1) | (2) | (3) | (4) | (5) | (6) | (7) | (8) | (9) | ||||||
| MERLIN | 1420 | 0.186 | 0.179 | 102 | 0.20 | W | 11 | 14 | 37.71 | 40 | 37 | 22.7 | 164 | 1104 |
| Cg | 38.73 | 20.3 | 26 | 28 | ||||||||||
| E | 38.86 | 19.5 | 143 | 1985 | ||||||||||
| MERLIN | 1539 | 0.168 | 0.163 | 49 | 0.08 | W | 11 | 14 | 37.71 | 40 | 37 | 22.7 | 142 | 955 |
| Cg | 38.73 | 20.3 | 28 | 31 | ||||||||||
| E | 38.86 | 19.6 | 115 | 1747 | ||||||||||
| MERLIN | 1658 | 0.155 | 0.149 | 60 | 0.19 | W | 11 | 14 | 37.71 | 40 | 37 | 22.7 | 133 | 959 |
| Cg | 38.72 | 20.3 | 26 | 29 | ||||||||||
| E | 38.86 | 19.6 | 99 | 1784 | ||||||||||
| MERLIN | 4874 | 0.057 | 0.057 | 0.06 | W | 11 | 14 | 37.71 | 40 | 37 | 22.7 | 36 | 292 | |
| Cg | 38.73 | 20.3 | 18 | 19 | ||||||||||
| E | 38.85 | 19.6 | 8.3 | 298 | ||||||||||
| MERLIN+ | 4874 | 0.100 | 0.100 | 0.05 | W | 11 | 14 | 37.71 | 40 | 37 | 22.7 | 51 | 330 | |
| VLA | Cg | 38.72 | 20.3 | 18 | 20 | |||||||||
| E | 38.85 | 19.6 | 20 | 477 | ||||||||||
Column 1: telescope used for the observations; column 2: observing frequency in MHz; column 3: the angular resolution in arcsec and the position angle (PA) of the restoring beam in deg; column 4: the rms noise level in the image in units of mJy/beam; column 5: component designation, with a superscript indicating that the values in columns 6 to 9 have been estimated by fitting a two-dimensional Gaussian; columns 6 and 7: the right ascension and declination of the peak of emission of the component in J2000 co-ordinates; columns 8 and 9: the peak and total flux density of the component in units of mJy/beam and mJy respectively. The errors in the flux densities are approximately 10 per cent.


The MERLIN C-band image with an angular resolution of 57 mas (Fig. 4) shows the multiple hotspot structure of the western lobe in more detail with the primary hotspot being more compact with a peak brightness of 36 mJy/beam and peak polarization of 30%. The secondary hotspot is more diffuse with a peak brightness of 7 mJy/beam. For the small value of rotation measure, as discussed later in this Section, the inferred magnetic field lines at its northern edge appear to be parallel to the edge of the lobe. The brightness and field structure of the primary and secondary hotspots are similar to other known cases (e.g. Laing 1989; Hardcastle et al. 1997; Leahy et al. 1997), with the primary hotspot being identified with the position at which the beam may be deflected by collision with a cloud of dense gas. At this resolution the C-band image shows no bright hotspot on the eastern lobe amongst several peaks of emission, the peak brightness being 8.3 mJy/beam. There is no polarization detected from these features at 4874 MHz, an upper limit to the degree of polarization being 2%.
The structures of the lobes on opposite sides of the core at the highest resolutions are significantly different, with the western lobe being more typical of a hotspot in an FRII source with a tail of emission while the eastern one is much more spherical and diffuse. Hydrodynamic simulations of light, large-scale jets in a decreasing density profile, show that the jet bow shock undergoes two phases; firstly a nearly spherical one and secondly the well-known cigar-shaped one (cf. Krause 2002; Krause & Camenzind 2002; Carvalho & O’Dea 2002). The shell-like structure of the eastern lobe is suggestive of the first phase of the development of the bow-shock. In this scenario, the eastern jet has not yet entered the cigar phase and deposits its radio-emitting plasma in a large part of the bubble, almost filling the region within the bounds of the bow shock. On the other hand, the western jet appears to be in the cigar phase and should therefore have a fairly regular backflow around it, which flows back into the central parts diffusing and mixing with the shocked external gas.
Besides the asymmetry in the location and brightness of the outer components, another striking feature of this source is the polarization asymmetry (cf. Liu & Pooley 1991). Since the images presented here with radio polarization information are at very different and high resolutions, it is not possible to derive reliable values of depolarization for the lobes. However, the depolarization of the western hotspot between C- and L-bands is consistent with the measurements of Liu & Pooley, while the eastern hotspot would appear to be strongly depolarized even at 5 GHz. The rotation measure of the western hotspot between C- and L-bands is 15 rad m-2, which is consistent with values for other sources at similar Galactic co-ordinates (e.g. Simard-Normandin, Kronberg & Button 1981).
3.2 Which is the approaching side?
One of the main objectives of these observations was to detect a radio jet in order to identify the approaching component and to try to understand the extreme asymmetries observed in this source. No radio jet has been detected to a brightness limit of 0.08 mJy/beam pointing towards the western side in the best MERLIN L-band image obtained from a combination of the two L-band frequencies. It is difficult to put a similar limit on a jet to the eastern side because of confusion with the lobe emission. In order to identify whether there is a jet on the eastern side, VLA C-band data kindly provided by J. Riley and G. Pooley have been combined with the MERLIN data to achieve the best sensitivity with an adequate resolution. The combined MERLIN+VLA image (Fig. 5), which has an angular resolution of 0.1 arcsec and an rms noise of 0.05 mJy/beam, shows no evidence of any jet on either the western or eastern side.
Therefore, from jet sidedness it is difficult to identify the approaching and receding sides of the source. The blue-shifted optical emission lines, which have been interpreted as being caused by a collision of the jet with a dense cloud, have led Bremer (1997) to suggest that the eastern lobe is approaching us. This is a plausible scenario and, assuming this to be true, 3C254 is inconsistent with the Laing-Garrington effect (Laing 1988; Garrington et al. 1988). This is not surprising if the external environment is very asymmetric with the eastern jet interacting with dense gas which slows down the jet and also depolarizes the radio emission. The strong depolarisation in the eastern lobe may also be partly due to the lobe being within the associated host galaxy since its separation from the core is only 12 kpc while the western lobe is in a more tenuous medium.
3.3 Are the oppositely-directed jets symmetric?
It might be expected that the brightness of the eastern hotspot would be greater than that of the western hotspot because it is interacting with a much denser medium, which should lead to a greater dissipation of energy and higher efficiency of conversion of beam energy into radio emission (e.g. Eilek & Shore 1989; Gopal-Krishna & Wiita 1991; Jeyakumar et al. 2005). Additionally, if it is indeed on the approaching side, its brightness may be enhanced by relativistic beaming (Rees 1966). However, the ratio of the peak brightness of the hotspots on the eastern side to that on the western side at the highest resolution of 57 mas is 0.23. This is just the reverse of what might normally be expected, suggesting that the oppositely-directed beams may be intrinsically asymmetric. Evidence of intrinsically asymmetric jets have come from studies of individual sources such as B0500+630 which has a complete absence of hotspots on one side (Saikia et al. 1996). Other examples of such sources have been given by Gopal-Krishna & Wiita (2000).
4 Concluding remarks
The radio galaxy, 3C254, is one of the most asymmetric radio sources in terms of the location of the outer lobes of radio emission relative to the nucleus of the host galaxy. MERLIN observations of the source have been presented at L- and C-bands with resolutions ranging from 0.18 (1.3 kpc) to 0.057 arcsec (0.4 kpc) respectively. These sensitive, high-resolution observations do not show any evidence of a jet on either the western or eastern side of the source, making it difficult to identify the approaching side on the basis of jet sidedness. Identifying the eastern side as the approaching one on the basis of the blue-shifted emission lines being pushed outwards by interaction with the radio jet (Bremer 1997), it appears that while the large-scale asymmetries may be caused by interaction with an asymmetric external environment, the small-scale asymmetries in the hotspots are probably the result of an intrinsic asymmetry in the jets on opposite sides. The usual assumption of oppositely-directed symmetric jets does not appear to be universally applicable, but it may be possible to establish this in only the most asymmetric of sources.
Acknowledgments
We thank Julia Riley and Guy Pooley for giving us the calibrated VLA A-array data at 5 GHz, and an anonymous referee, Graham Smith and Alan Pedlar for several helpful comments. One of us (DJS) would like to thank the PPARC Visitors Programme at Jodrell Bank Observatory, Andrew Lyne, Director, for use of the facilities at the Observatory, and Peter Thomasson for hospitality while this work was done. MERLIN is a U.K. National Facility operated by the University of Manchester on behalf of PPARC. The Very Large Array is operated by the National Radio Astronomy Observatory for Associated Universities Inc. under a co-operative agreement with the National Science Foundation. This research has made use of the NASA/IPAC extragalactic database (NED) which is operated by the Jet Propulsion Laboratory, Caltech, under contract with the National Aeronautics and Space Administration.
References
- [] Baars J.W.M., Genzel R., Pauliny-Toth I.I.K., Witzel A., 1977, A&A, 61, 99
- [] Barthel P.D., 1989, ApJ, 336, 606
- [] Bremer M.N., 1997, MNRAS, 284, 126
- [] Carvalho, J.C., O’Dea C.P., 2002, ApJS, 141, 371
- [] Crawford C.S., Vanderriest C., 1997, MNRAS, 285, 580
- [] Donahue M., Daly R.A., Horner D.J., 2003, ApJ, 584, 643
- [] Eilek J.A., Shore S.N., 1989, ApJ, 342, 187
- [] Forbes D.A., Fabian A.C., Johnstone R.M., Crawford C.S, 1990, MNRAS, 244, 680
- [] Garrington S.T., Leahy J.P., Conway R.G., Laing R.A., 1988, Nature, 331, 147
- [] Gopal-Krishna, Wiita P.J., 1991, ApJ, 373, 325
- [] Gopal-Krishna, Wiita P.J., 2000, A&A, 363, 507
- [] Hardcastle M.J., Alexander P., Pooley G.G., Riley J.M., 1997, MNRAS, 288, 859
- [] Ishwara-Chandra C.H., Saikia D.J., McCarthy P.J., van Breugel W.J.M., 2001, MNRAS, 323, 460
- [] Jeyakumar S., Wiita P.J., Saikia D.J., Hooda J.S., 2005, A&A, 432, 823
- [] Krause M., 2002, A&A, 386, L1
- [] Krause M., Camenzind M., 2002, In Active Galactic Nuclei: from Central Engine to Host Galaxy, eds. S. Collin, F. Combes and I. Shlosman, ASP Conf. Sr., in press
- [] Laing R.A., 1988, Nature, 331, 149
- [] Laing R.A., 1989, in Hot spots in extragalactic radio sources, eds K. Meisenheimer, H.-J. Roeser, Springer-Verlag, Berlin, p. 27.
- [] Leahy J.P., Black A.R.S., Dennett-Thorpe J., Hardcastle M.J., Komissarov S., Perley R.A., Riley J.M., Scheuer P.A.G., 1997, MNRAS, 291, 20
- [] Liu R., Pooley G., 1991, MNRAS, 249, 343
- [] Liu R., Pooley G., Riley J.M., 1992, MNRAS, 257, 545
- [] McCarthy P.J., van Breugel W., Kapahi V.K., 1991, ApJ, 371, 478
- [] Owen F.N., Puschell J.J., 1984, AJ, 89, 932
- [] Patnaik A.R., Browne I.W.A., Wilkinson P.N., Wrobel J.M., 1992, MNRAS, 254, 655
- [] Pedelty J.A., Rudnick L., McCarthy P.J., Spinrad H., 1989, AJ, 97, 647
- [] Rees M.J., 1966, Nature, 211, 468
- [] Reid A., Shone D.L., Akujor C.E., Browne I.W.A., Murphy D.W., Pedelty J., Rudnick L., Walsh D., 1995, A&AS, 110, 213
- [] Saikia D.J., Junor W., Cornwell T.J., Muxlow T.W.B., Shastri P., 1990, MNRAS, 245, 408
- [] Saikia D.J., Thomasson P., Jackson N., Salter C.J., Junor W., 1996, MNRAS, 282, 837
- [] Simard-Normandin M., Kronberg P.P., Button S., 1981, ApJS, 45, 97
- [] Spergel D.N., et al. 2003, ApJS, 148, 175
- [] Thomasson P., Saikia D.J., Muxlow T.W.B., 2003, MNRAS, 341, 91