Using Radio Bubbles to Constrain the Matter Content of AGN Jets
Abstract
We revisit a method to obtain upper limits on the jet matter content combining synchrotron self-absorption constraints and the large scale bubble energy. We use both X-ray observations, which give limits on the jet power from the energies and timescales of bubbles found in clusters of galaxies, and radio observations, which give limits on the magnetic field in the jets. Combining the two imposes constraints on the particle number density, and hence the jet content. Out of a sample of clusters which have clear radio bubbles, there are only two which have sufficient resolution in the radio images to give significant constraints, under the assumption that the jets are fairly steady. The results for M87 and Perseus indicate that the radio emitting region of the jet is electron-positron dominated, assuming that the minimum of the electron energy distribution, .
keywords:
plasmas – galaxies: jets – galaxies: active1 Introduction
The radio synchrotron emission from jets associated with active galactic nuclei (AGN) indicate that they must contain relativistic leptons and magnetic fields. The matter content of these jets, however, is still a mystery (e.g. Homan 2005). Assuming that these jets are electrically neutral, are they electron-positron (“light”) or electron-proton (“heavy”)? This paper aims to determine whether the positively charged particles are positrons or protons, in the assumption that the magnetic field is not energetically dominant.
Previous attempts to determine the matter content of the jets have used Synchrotron Self-Absorption (SSA) arguments (e.g. Celotti & Fabian 1993; Reynolds et al. 1996). Measurements of the core radio flux and the size of the emitting region lead to constraints on the number density of the relativistic particles responsible for the emission, , and on the magnetic field present in the jet, . The effect of any protons in the jet cannot be determined from radiative information. As a result the large scale properties of the source are required to place independent estimates on the total power. In the past this has been difficult because the total energy in the radio lobes has not been known; equipartition between the energy in the magnetic field and the radio-emitting particles has been assumed in order to be able to estimate the energy present (Burbidge, 1959).
With the advent of the Chandra and XMM-Newton X-ray observatories the interaction of radio sources in the centres of clusters of galaxies with the surrounding Intra-Cluster Medium (ICM) has been observed in great detail. One of the first observed was the Perseus Cluster, where decrements in the X-ray emission from the thermal ICM were first seen by ROSAT (Böhringer et al., 1993). These have been interpreted as “bubbles” blown in the ICM by the central radio source. Strong support for this interpretation came with Chandra imaging and spectral information (Fabian et al., 2000). Subsequently many other examples of such bubbles have been found (e.g. Hydra A, McNamara et al., 2000; A2052, Blanton et al., 2001; A2199, Johnstone et al., 2002; Centaurus, Sanders & Fabian, 2002).
As these radio lobes are embedded in the ICM, their energy content can be more accurately determined using arguments of pressure balance between the thermal ICM and the relativistic plasma within the bubbles, as well as bubble dynamics. As a result, the connection between the kinetic luminosity of the jet and the energy in the bubble can be calculated. The potential of this approach is that it does not require assumptions on equipartition for the estimate of the jet power.
In this work we combine the information from X-ray and VLBI observations of radio sources embedded in clusters of galaxies, where clear bubbles are visible in the X-ray images. We apply the calculations performed for the jet in M87 by Reynolds et al. (1996) to calculate the matter content of the jet present in this and other sources. In essence the method determines the lepton content of the base of the jet from synchrotron emission and absorption, and the total particle energy content from power required to create the observed bubbles. The comparison between the two, sets constraints on the particle content.
In Section 2 we outline the models and assumptions used in the calculations. The source parameters and the results are presented in Sections 3 and 4. The assumed lepton energy distribution is discussed in Section 5, and further complications of this method and comparisons with other methods are discussed in Section 6. The implications of this work on the particle content of radio lobes is investigated in Section 7. We use throughout.
2 The Model
This section briefly summarises the calculations presented in Reynolds et al. (1996) (following Marscher 1987) in order to demonstrate the method and define the parameters.
2.1 Limits on the Magnetic Field from Synchrotron Self-Absorption
With the assumption that the relativistic leptons have a distribution of Lorentz factors , between and , the spectrum in the optically thin regime is . The corresponding relativistic lepton number density, , is given by
Therefore, for and , the lepton number density is
| (1) |
Initially we assume for the following calculations. For a discussion of the effect of varying see Section 5.
The synchrotron flux in the optically thick (self-absorbed) region is independent of the particle density, resulting in an estimate on the magnetic field of
| (2) |
where the and are the frequency (in ) and flux density (in Jy) at spectral turnover. is the angular diameter of the source in milliarcseconds (mas). As the angular diameter may be an upper limit (the core may not be fully resolved) this causes the estimate on to be an upper limit. In some cases the source is elliptical, and in these cases the average , where and are the corresponding angular diameters of the ellipse. is the relativistic Doppler factor, defined as where and are the Lorentz factor and for the bulk motion of the jet respectively and is the angle between the line of sight and the jet axis. The function, , is tabulated in Marscher (1987) and we have interpolated between the values given where appropriate.
The observation of compact radio sources with flat spectra, , has been interpreted as the superposition of different SSA components each peaking at different frequencies (Blandford & Konigl, 1979). Hence the observations at a given basically measure the flux density and the size of the component of the jet which is becoming self absorbed at (in the observer’s frame).
2.2 Limits on the Magnetic Field and Number Density
The jet becomes self-absorbed at an observed frequency, , where ; where is the synchrotron absorption coefficient, is the path length of the line of sight through the jet and the jet cross-section radius. From Reynolds et al. (1996) and references therein
| (3) |
where is the cyclotron frequency and is the product of gamma functions (of order unity for the considered range of ).
This expression for is valid for , where is the low-energy cut-off in the spectrum corresponding to the low-energy cut-off in the lepton energy distribution. In this case the self-absorption only depends on the normalisation of the relativistic lepton distribution and the magnetic field.
The path length is , using the relativistic transformations for a cylindrical geometry. Combining this with Equations 1 and 3, places a lower limit in the plane for radiation at frequency to be self-absorbed in the source,
| (4) |
2.3 Kinetic Luminosity
The kinetic luminosity of the jet depends on the type of particles present, as well as their energy and number density. In the assumption that all of the energy contained within the jet results in the creation and expansion of the radio bubbles observed within clusters, then the power required to create these bubbles is an estimator of the (average) kinetic luminosity of the jet, i.e. , where is the creation time of the bubble. The simplest estimate on the energy required is that , where is the volume of the bubble, and is the pressure of the surrounding intra-cluster gas. Taking into account any internal energy of the bubble results in
where is the ratio of specific heat capacities, which for a relativistic gas is , resulting in . Whether the energy contained within the bubble is , or some other multiple of is currently uncertain. For example, investigating the weak shock surrounding the bubbles in the Perseus cluster, Fabian et al. (2006) find that the energy of the post-shock gas is around . We use , although using does not change the results significantly.
In our analysis we assume that the radio bubbles are in pressure equilibrium with their surroundings, whereas Reynolds et al. (1996) assumed that they were over-pressured by a factor of . Using their source parameters we recover the limits they place on the matter content of the M87 jet (see their Fig. 1).
There are a number of estimates on the bubble timescales. The most appropriate one for these young bubbles which are (presumably) still being inflated by their jet is the sound speed timescale, , where is the bubble radius and is the local sound speed, following Dunn & Fabian (2004). There are no indications for strong shocks surrounding the bubbles, which implies that the bubble edges are travelling at less than the local sound speed. It is possible, however, that the bubbles do not grow smoothly, but in fits and starts (Fabian et al., 2005), and as such this timescale is not a good estimate for the age of the bubble. For further discussion on timescales relevant to the evolution of bubbles in clusters see Churazov et al. (2000); Dunn & Fabian (2004); Dunn et al. (2005).
As mentioned, we assume that the jet is particle dominated (i.e. we neglect the magnetic field contribution) and for simplicity, following other work (e.g. Sikora & Madejski 2000), assume that the protons are “cold”. Thus the jet kinetic luminosity, including the advected energy, is
| (5) |
where takes into account the effect of hadrons on the rest-mass energy (adapted from Schwartz et al. 2006). For electron-positron jets . In electron-proton jets we assume that there is one proton per electron, so . The internal energy of the leptons is expressed as for .
If then the average particle Lorentz factor is
For a more general case, where ,
3 Source Parameters
Here, as a result of the range of spectral indices measured, we assume that each SSA component has the same particle energy distribution, with and so the same (optically thin) spectral index , as this falls in the middle of the range expected for optically thin spectra ().
The core fluxes presented in this work are those which place some useful limit on the matter content of the jets. There are many other, mainly older, measurements which result in lower limits on the number densities inferred which are too low to allow any constraints to be placed on the matter content.
| Bubble | ||||
|---|---|---|---|---|
| Degrees | ||||
| M87, | ||||
| Jet | ||||
| Counter-Jet | ||||
| Average | ||||
| Perseus, | ||||
| Northern-Inner | ||||
| Southern-Inner | ||||
| Average | ||||
| Name | Date | Flux Density (Jy) | Size (mas); , | Reference | |||
| M87 | |||||||
| Reynoldsb | 0972/0373 | 5.0 | 1,2,3,4 | ||||
| Kovalev- | 050203 | 15.0 | 5,6 | ||||
| Kovalev- | 050203 | 15.0 | 5,6 | ||||
| Lister05- | 050203 | 15.0 | 6,7 | ||||
| Scott- | 201297 | 5.0 | 6,8 | ||||
| Perseus | |||||||
| Kovalev- | 010303 | 15.0 | 5,9 | ||||
Notes: All fluxes and sizes are model fits to the emission. The beam for Lister05 is mas. Date is in DDMMYY or MMYY/MMYY format. a The is for the bulk motion of the jet. b for this core flux. c The angular sizes are an upper limit for these measurements. References: 1. Pauliny-Toth et al. (1981); 2. Biretta (1993); 3. Biretta et al. (1995); 4. Reynolds et al. (1996); 5. Kovalev et al. (2005); 6. Biretta et al. (1999) 7. Lister & Homan (2005); 8. Scott et al. (2004); 9. Walker et al. (1994).
3.1 M87
We include the VLBI and parameters adopted by Reynolds et al. (1996) (using ) to allow a comparison to be made between their values and the values based on updated observations. The jet parameters used Reynolds et al. (1996) were and , based on the observations in Biretta et al. (1991) and Biretta et al. (1995).
The apparent jet speeds measured by Biretta et al. (1995) ranged from close to the core to for more distant components. Recent observations report a range of apparent speeds; Kellermann et al. (2004) measure for a component from the core; Ly et al. (2004) place lower limits of on the jet motion and Dodson et al. (2006) find little evidence for any motion of the components close () to the core. A series of HST images resulted in measurements of apparent speeds of for components between and from the core (Biretta et al., 1999), with the innermost resolved component at from the core having an apparent speed of .
Clearly the superluminal velocities measured might not be associated with the bulk flow of the jet, but correspond to pattern speeds (e.g. shocks). However, if the observed speeds do arise from the plasma bulk motion, then the above measures place strong constraints on its velocity and the angle of the jet to the line of sight. Biretta et al. (1995) found that . Assuming that the apparent speeds are then (Biretta et al., 1999) (further allowed combinations of and are shown in their Table 3). As a result we use as this encompasses a large proportion of the range of observed superluminal speeds, along with a corresponding .
Dodson et al. (2006) measure a spectral index of between 1.6 and 4.8 GHz, and between 4.8 and 15 GHz. Their calculations of the spectral turnover gives . The core flux densities used here have been measured at and . These are close to the spectral turnover frequency as estimated by Dodson et al. (2006) and are thus presumably in the self-absorbed region of the spectrum, where Equation 3 is applicable.
3.2 Perseus
Studies of the core of 3C 84 have also resulted in a range of measured apparent motions. Kellermann et al. (2004) using VLBA observations find . Walker et al. (1994) find that the jet speed and orientation angle are not tightly constrained, and . As in M87, some components appear to be much slower, (Dhawan et al., 1998), and others are faster, (Marr et al., 1989). Krichbaum et al. (1992) estimate an angle to the line of sight of and a corresponding . We use the values presented in Walker et al. (1994) as these fall towards the middle of the observed range ( corresponds to ).
The core of 3C84 in Perseus has a complicated spectral index structure with an inverted spectrum at lower frequencies (, Unwin et al. 1982; O’Dea et al. 1984), flattening towards higher frequencies (O’Dea et al. 1984). The spectra in Readhead et al. (1983) also show a decrease of flux density toward lower frequencies, though there are no measurements at less than . The spectral index varies across the core and so an exact value is difficult to obtain (e.g. Unwin et al. 1982; Readhead et al. 1983; Vermeulen et al. 1994; Krichbaum et al. 1992). Silver et al. (1998) indicate that the spectrum may indeed be flat in the range (see their Fig. 5). Our core flux for Perseus is at and so it is reasonable that Equation 3 is applicable.
4 Results
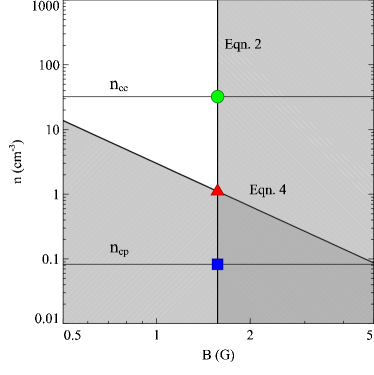
Fig. 1 shows, for a representative case, the constraints on the matter content of jets placed by Equations 2 and 4 in the plane. The lines labelled “Eqn. 2” and “Eqn. 4” exclude regions of the plane. The “intersection point” (triangle) is thus the minimum number density possible in the jet from observations, being the combination of the two above equations. The expected number densities inferred from the estimated for pure electron-positron (the circle and line labelled “”) and electron-proton (the square and line labelled “”) jets are shown. In this representative case an electron-proton jet is excluded, and hence the jet is electron-positron. Note that if the estimate on the magnetic field were to increase then the intersection point would move to the right, eventually allowing the possibility that the jet is electron-proton. When this occurs, no constraints can be placed on the matter content of the jets.
The results are shown in Fig. 2, for both M87 and Perseus. In order to compute we average the energies and timescales of the bubbles within each cluster, as the differences in the results between the different bubbles are very small.
Fig. 2 reports the intersection points corresponding to the plane for each useful set of data. In order to check the robustness of the conclusions, we also explicitly estimated errors on the inferred values. In particular, the reported uncertainties are estimated using a Monte-Carlo algorithm, assuming the input uncertainties have a Gaussian distribution which take into account range of values measured for each parameter. The source of uncertainties which have been accounted for are those parameters which have an uncertainty quoted in Tables 1 and 2. If no uncertainty has been given in the literature, we have adopted a conservative value of 10 per cent ( is assumed to have no error, but the effect of different values is discussed in Section 6.2). The error-bars shown on Fig. 2 are errors derived from this algorithm. These uncertainties are only applicable to this model for the core radio emission.
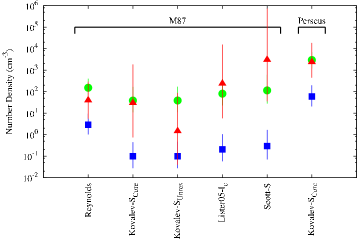
Although the different datasets imply different values of densities, globally they provide a similar result; that the relativistic jets in these two sources are likely to be electron-positron. This analysis indicates that for M87, including the core flux used in Reynolds et al. (1996), the jet is electron-positron. There is, however, only one measurement for the Perseus cluster (from Kovalev et al. 2005) which places clear limits on the matter content of the jet in 3C 84.
As a result of the large uncertainties in the measurements of the jet angles and bulk velocities and the disparity between the values for M87 and Perseus we check if the conclusions change substantially using different and . We recalculate the results for M87 with and and for Perseus with and .
Relative to the number densities required by the estimated (which themselves rise by a factor ) the intersection points (red triangles) for M87 fall. The results still favour light jets, though are less definite. In Perseus, as the jet angle and velocity were altered in the other sense, the number densities corresponding to decrease and the limits become more consistent with light jets.
Thus, even though we have chosen values for and which are drastically different from the average of the measured values the results still indicate that both jets are light, showing that the conclusions do not depend critically on these values.
Other clusters were also analysed, including A2199 (3C 338) and Hydra A, but the radio observations of the core did not have sufficient resolution (the model is very dependent on the angular size of the core). The resultant magnetic field estimates were therefore high, giving very low estimates on the number densities in the jet. Therefore no useful constraints could be placed on the matter content.
5 Limits
We have so far assumed that the low-energy cut-off in the energy distribution of leptons occurs at . Celotti & Fabian (1993), Ghisellini et al. (1992) and Reynolds et al. (1996), however, find that a low-energy cut-off at in the lepton energy spectrum is required for both heavy and light jets, consistent with polarisation measurements.
As rises then the number densities will fall as fewer particles will carry the same energy (the average energy per particle will rise). In the assumption that the protons remain cold, one can even reach the situation where the average lepton energy is close to the proton energy (i.e. ). It is clear that when approaching this value, the expected lepton number densities for the two jet types differ by a smaller and smaller factor and so, given the large uncertainties of the current measurements, by increasing the possibility of drawing any conclusions on the matter content becomes increasingly small.
5.1 Synchrotron and Synchrotron Self-Compton constraints
Upper limits on in the core, however, can be set.
A first constraint on maximum values of is set by the very same self-absorption model adopted above, as, for it to be self-consistent, the lepton distribution should extend at least to energies of the leptons responsible for the emission at . In other words, .
Further upper limits can be also obtained from synchrotron Self-Compton (SSC) constraints. Namely, the X-ray emission expected from the self-absorbing region via SSC, should not exceed the observed X-ray flux, where
| (6) |
(e.g. Reynolds et al. 1996; Marscher 1987). Here is the Thomson scattering cross-section, and is tabulated in e.g. Ghisellini et al. (1992). The break frequency/upper cut-off in the synchrotron spectrum, , is taken to lie at (Meisenheimer et al., 1996) and is the X-ray frequency. It is of course possible that the X-ray emission is not entirely the result of the SSC process. Some may be synchrotron emission (e.g. Marshall et al. 2002), in which case is an upper limit to the SSC flux.
These limits are, as for the SSA, dependent on , while the kinetic luminosity depends on . It is thus necessary to compare the above constraints in the parameter space for . Figure 3 reports the results for a representative case (referring to the dataset Kovalev- of M87), each thick line referring to the upper limit from SSC (dashed black), the lower limit from SSA (solid black), the values corresponding to the inferred for pair (green) and electron-proton (blue) jets, and the upper limit on from (magenta).
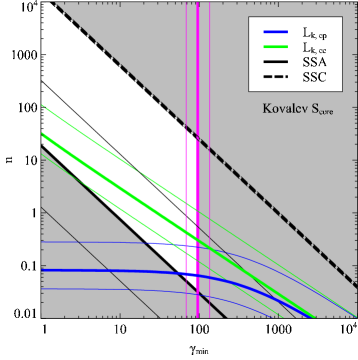
Taken at face value, the implication is that all the conditions can be satisfied by either a pair jet with or a heavy jet for the limited range . Qualitatively similar inferences can be derived for M87 in the cases of Kovalev- and Reynolds (fully in agreement with the conclusion reported by Reynolds et al. (1996)), while the Lister- is just marginally consistent with pair jets with and Scott- does not formally allow a consistent solution. These last two core flux measurements are those in which the minimum number density fell above that allowed for an electron-positron jet in Fig. 2. For all cases the SSC upper limits do not give interesting constraints. On the contrary the Perseus X–ray data (SSC) strongly constrain the possible solutions to light jets with or heavy jets with . Overall, would imply electron-positron jets. For higher values, typically both heavy and light jets are allowed by the data. These limits are, on average, not inconsistent with those put forward by Fabian et al. (2002). It should be nevertheless stressed the (in some cases implausibly) tight range of values of were the jets heavy.
The errors on the source parameters, however, limit the possibility of drawing any firm conclusion at this time. This can be seen in Fig. 3, where the errors on the above constraints, again derived via the Monte Carlo simulations, are reported as thin lines. It should also be noticed that the condition imposed by could be in principle more relaxed if the upper limit on has been overestimated because of the limited resolution of the observations, as (Equation 2).
We conclude that currently this method cannot definitely rule out electron-proton jets in favour of electron-positron jets, although the former case would require a rather narrow range of values of possible . Better quality data (angular resolution, jet speed, jet direction, contribution of SSC emission in the X-ray band) and/or other constraints on could impose firmer conclusions.
6 Discussion
In the following we will summarise and discuss the caveats of the above estimates, from both observational and modelling points of view.
At a general level, the conditions on small scales in the jet may not correspond to those on large scales, from conservation of particles, momentum and energy alone. There may be entrainment of ambient material by the jet, dissipation, turbulence or Poynting flux energy transport.
The jet of M87 has filamentary structure on all scales where it is well imaged. There is no obvious distance from the nucleus where the jet disappears. If there are any inhomogeneities on small scales in the jet, then the synchrotron self-absorption estimates could be affected.
6.1 Variability & Kinetic Luminosity
These calculations assume that the jet is of constant power, corresponding to that observed now. This is not necessarily true. As the synchrotron flux of the core has been used to determine the matter content of the jet, any flux variability would change this (both density and magnetic field), particularly so if the size of the emitting region appears the same (see Equation 2). It would, however, have no immediate effect on the bubble, and hence the inferred kinetic luminosity would remain the same.
As and (Equation 4), then (for a constant and ). So a small change in the core flux changes the minimum possible number density in the jet, even by orders of magnitude.
To see by how much the core would have to vary for the number densities in M87 to be consistent with electron-proton jets the core flux for the Kovalev- and Scott- values were decreased until the intersection point is consistent with the electron-proton values. No other values were changed except the flux. The Kovalev- core flux only has to change by a factor of 4 for the number densities to be consistent with electron-proton jets. In the case of Scott- the variability has to be around a factor of 8.
Indeed, the flux of 3C84 steadily increased between 1960 and 1989 (Marr et al., 1989; O’Dea et al., 1984), by up to a factor of 4. More recent observations in the optical and X-ray show that the nuclear flux varied by less than a factor of 3 between 2000 and 2003 (Perlman et al., 2003).
This is a major problem with the method utilised in this work. In principle, there is no temporal link between the current kinetic luminosity of the jet and that calculated from the bubble. The radio core and the jet fluxes may vary over the course of decades whereas the bubbles have timescales of . However recent work by Allen et al. (2006) found a correlation between the Bondi accretion power and the kinetic luminosity of jets in nine nearby elliptical galaxies. The bubble powers are measured over a timescale of and the inflow through the Bondi radius takes . Therefore, the resulting correlation suggests that these powers might be comparatively steady over .
Further to the discussion on the bubble powers (Section 2.3) is the issue of any energy in the form of cosmic rays and magnetic fields present at the centres of clusters. Sanders et al. (2005) show that the pressure of these components could contribute at least 30 per cent in the region of the Perseus bubbles. As a result the energy content of the radio bubbles may be larger than just what thermodynamic calculations imply, requiring a larger number density of particles in the jet. There may also be losses as the jet travels out from the central AGN into the lobe. The kinetic luminosity inferred from the bubble expansion would be an under estimate of the initial kinetic luminosity of the jet. As such the expected number densities may be lower limits. These effects could cause core fluxes which currently exclude heavy jets to become consistent with them, but only if these effects are (unexpectedly) large ().
6.2 Parameter Effects
As was presented in Sections 3.1 and 3.2 there is no clear, exact consensus on the value for all the observational parameters which are used in this model. The true jet velocity and angle to the line of sight are still uncertain, and the range in the currently inferred values is large.
The jet velocity affects the expected number densities (Equation 5), and the magnetic field estimate (Equation 2), . Therefore, if the true jet velocity were faster, then the expected number densities required to create the observed bubbles would fall. If so, the two core flux measurements for the Perseus jet not presented in the main results (from Kovalev et al. 2005 and Scott et al. 2004) could also imply electron-positron jets (see also Section 4).
The angle to the line of sight changes the magnetic field calculated in the jet, via the Doppler factor . The change (increase) in becomes greater as the angle to the line of sight decreases. As a result the upper limit on the magnetic field increases and the “intersection point” decreases, making the constraints on the matter content less restrictive. We have, however, taken into account the large uncertainties on and in our calculations of the errors associated with the estimated number densities.
The spectral index of the optically thin spectrum, , has instead very little effect on the results in the range . As such the conclusions remain unchanged over a large range in which is a parameter whose value we have assumed rather than measured.
6.3 Dimension of the Self-Absorbed Core
The angular size of the core has been taken as the diameter of the jet at the point when the jet becomes self-absorbed; however the core may not be resolved and so this may be an upper limit. Although we have used the most recent high resolution data, the actual emission region might be smaller than the size of the radio telescope beam, therefore we would have over-estimated the angular size of the source. As (Equation 2), the effect of any difference between the true and observed value would be greatly amplified in the estimates of and . Indeed, the sources with large estimates of magnetic field (e.g. A2199, Hydra A) were also those furthest away, implying the resolution may not have been high enough to fully resolve the emitting regions.
Another caveat is that the angular size of the core may also represent the entire projected length of the self-absorbed jet (Marscher, 1987). However, the most recent observations of M87 have a resolution of 0.1 milliarcsecond (Krichbaum et al., 2004), which corresponds to tens of light days. This means that at least for the closest objects the core radii are unlikely to be blends of knots of emission, masking the true core emission.
6.4 Comparison with other studies
Ghisellini et al. (1992) used spectral information and VLBI maps from 105 sources along with an SSC model to obtain estimates on the bulk Doppler factor and emitting particle number density. Upper limits on the pair number density were placed from the number expected to be able to survive annihilation from the central region where they might be produced, and lower limits from the observed synchrotron emission. They found that a low-energy cut-off of in the lepton energy distribution was required for both light and heavy jets.
Using the same sample, Celotti & Fabian (1993) found that the estimated kinetic power on parsec scales was similar to that inferred from radio lobes, concluding that energy can be efficiently transported over several orders of magnitude in length scale along the jet. Combining limits on the total kinetic power and particle number density flux, their results favoured heavy jets, also with a low-energy cut-off at around .
From X-ray observations of blazars associated with optically violent variable quasars, Sikora & Madejski (2000) place constraints on the pair content of the radio-loud quasar jets. They exclude both pure light jets, as these over-predict the soft X-ray flux, and pure heavy jets as these predict too weak non-thermal X-ray emission. Although the pair number density is larger than the proton number density, the jets would be dynamically dominated by the protons.
Circular and linear polarisation observations of jets can be used to constrain the low-energy particle distribution, the magnetic field strength and the particle content. Depending on whether this is intrinsic to the synchrotron emission or produced by Faraday conversion of linear polarisation to circular, different limits can be set on the low energy particle distribution (e.g. Homan 2005).
Wardle et al. (1998) measured circular polarisation from 3C 279 and, considering that most likely this results from Faraday conversion, set an upper limit , which would be evidence for electron-positron jets in this source. Further observations of PKS 0528+134, 3C 273 and even 3C 84, detected circular polarisation, but no limits on have been determined (Homan & Wardle, 1999, 2004). In any case, more recently Ruszkowski & Begelman (2002) showed that the observations of 3C 279 could be consistent with both types of jet, by arguing that the linear and circular polarisations observed could, depending on the field configuration, be consistent with different plasma compositions. Therefore, no strong conclusion can (yet) be drawn on such measurements.
While we have no robust explanation on the discrepancy between results supporting electron-proton dominated jets and our findings, one intriguing possibility is that jets associated with powerful sources are energetically dominated by a proton component, while low power radio sources, such as M87 and Perseus, are predominantly composed of an electron-positron pair plasma.
6.5 Magnetic Field Energy
In general, it is possible that jets are magnetically dominated, with negligible contribution to the energetics from particles (e.g. Blandford 2002). Sikora et al. (2005) argued instead that conversion from Poynting-flux dominated to matter dominated jets takes place very close to the black hole.
From arguments of energy equipartition between the emitting leptons and the magnetic field, to are estimated depending on the jet scale. Studying M87, Stawarz et al. (2005) find a lower limit in the brightest knot of the jet at from the core, concluding that it is likely that this represents a departure from equipartition, such that the knot is at least marginally magnetically dominated.
Any Poynting flux would not be easily detectable from the radiative properties of the jet (except possibly from a population of particles with a narrow energy distribution, as expected following acceleration from reconnection events) and because of that no conclusion could be drawn from the current data.
In this work we have assumed that the magnetic field does not dominate the energy content.
7 Particle content of radio lobes
The results imply that the jets in M87 and 3C 84 are light (electron-positron), at least at their base. Fabian et al. (2002) quantify the particle content of the radio bubbles in the following way. By comparing the pressure inside and outside of the bubble, any extra particles beyond those inferred from the radio emission can be determined. This method gives estimates on , where is the volume filling factor of the relativistic plasma and accounts for the extra particles. Dunn & Fabian (2004); Dunn et al. (2005) find (for M87 and for Perseus) and that the radio lobes in these clusters are not in equipartition but are particle dominated.
If the jets start as a pure electron-positron plasma, then for protons to be present in the lobes, some entrainment of material has to occur. This is likely to be a stochastic process and highly dependent on the environment surrounding the jet within the inner few . Powerful sources are unlikely to pick up much material as their jets would clear out the regions surrounding them and weaker sources would be expected to pick up more material. Entrainment may be the key reason why the latter sources appear as FR I, as indeed detailed modelling indicates (e.g. Laing & Bridle 2002). In principle, entrainment could slow down a jet to sub-relativistic speeds. The amount of entrainment, however, especially on large scales where the jets are no longer fully collimated, is uncertain. The exact shape of the low-energy lepton spectrum will also affect , as it will the matter content of the jet.
De Young (2006) suggest that the fact that (for ) in some clusters results from a population of cold protons present in the jet. This is different to the jet matter content suggested here. This solution does have problems as the accompanying relativistic electrons may cause jet to decollimate unless magnetic confinement occurs. Another solution De Young (2006) suggest are Poynting-flux dominated jets, though these also have associated difficulties, including whether they can produce the FR I morphologies observed (e.g. Komissarov 1999; Leismann et al. 2005).
The radio lobes of M87, Cygnus A and Fornax A appear very filamentary and so the filling factor of the radio emitting plasma may vary, which may have bearing on the matter content of the jet. The net effect is not obvious as it would depend on the actual structure of the relativistic component and its possible confinement. While clearly the kinetic luminosity and synchrotron emission in the optically thin regime only depends on the total particle number, the synchrotron self-absorption estimates are also affected by the density inhomogeneities along the line of sight.
8 Conclusions & Outlook
If the conditions observed at the base of the jet are typical over the timescale for bubble creation, and all the caveats discussed in the previous section hold, then the jets in M87 and Perseus are likely to be dominated by an electron-positron plasma. Other radio sources in clusters analysed are too distant to afford the resolution necessary to measure the synchrotron flux from the base of the jet.
Despite the significant potential offered by estimates of the jet power from its interaction with the ICM, this method is currently limited to determining the matter content of extra-galactic radio jets in sources in sufficiently nearby clusters of galaxies. A concerted effort in monitoring the cores of nearby AGN at a variety of frequencies will help in constraining the jet matter content. Clear identification of the cores, measurements of the jet velocity and limits on the variability will aid in improving the parameters and assumptions involved in these calculations. Future perspectives include high accuracy measurement of resolved radio cores via the space VLBI, and higher frequencies observations (though the flux should not be dominated by optically thin emission).
A definitive result on the matter content of jets remains, however, elusive for now.
Acknowledgements
We thank the anonymous referee for comments which greatly improved this manuscript and Mary Erlund and Yuri Kovalev for stimulating discussions. ACF, RJHD and AC acknowledge support from The Royal Society, PPARC and the Italian MIUR, respectively. This research was supported in part by the National Science Foundation under Grant No. PHY99-07949; AC acknowledges the KITP (Santa Barbara) for kind hospitality.
References
- Allen et al. (2006) Allen S. W., Dunn R. J. H., Fabian A. C., Taylor G. B., Reynolds C. S., 2006, MNRAS, in press astro-ph/0602549
- Biretta (1993) Biretta J. A., 1993, in Burgarella D., Livio M., O’Dea C.P., eds, Cambridge University Press, Cambridge, p. 263
- Biretta et al. (1999) Biretta J. A., Sparks W. B., Macchetto F., 1999, ApJ, 520, 621
- Biretta et al. (1991) Biretta J. A., Stern C. P., Harris D. E., 1991, AJ, 101, 1632
- Biretta et al. (1995) Biretta J. A., Zhou F., Owen F. N., 1995, ApJ, 447, 582
- Blandford (2002) Blandford R. D., 2002, in Gilfanov M., Sunyeav R., Churazov E., ed, Lighthouses of the Universe: The Most Luminous Celestial Objects and Their Use for Cosmology, p. 381
- Blandford & Konigl (1979) Blandford R. D., Konigl A., 1979, ApJ, 232, 34
- Blanton et al. (2001) Blanton E. L., Sarazin C. L., McNamara B. R., Wise M. W., 2001, ApJ, 558, L15
- Böhringer et al. (1993) Böhringer H., Voges W., Fabian A. C., Edge A. C., Neumann D. M., 1993, MNRAS, 264, L25
- Burbidge (1959) Burbidge G. R., 1959, ApJ, 129, 849
- Celotti & Fabian (1993) Celotti A., Fabian A. C., 1993, MNRAS, 264, 228
- Churazov et al. (2000) Churazov E., Forman W., Jones C., Böhringer H., 2000, A&A, 356, 788
- De Young (2006) De Young D. S., 2006, ApJ astro-ph/0605734
- Dhawan et al. (1998) Dhawan V., Kellerman K. I., Romney J. D., 1998, ApJ, 498, L111
- Dodson et al. (2006) Dodson R., Edwards P. G., Hirabayashi H., 2006, PASJ, 58, 243
- Dunn & Fabian (2004) Dunn R. J. H., Fabian A. C., 2004, MNRAS, 351, 862
- Dunn et al. (2006) Dunn R. J. H., Fabian A. C., Sanders J. S., 2006, MNRAS, 366, 758
- Dunn et al. (2005) Dunn R. J. H., Fabian A. C., Taylor G. B., 2005, MNRAS, 364, 1343
- Fabian et al. (2002) Fabian A. C., Celotti A., Blundell K. M., Kassim N. E., Perley R. A., 2002, MNRAS, 331, 369
- Fabian et al. (2005) Fabian A. C., Reynolds C. S., Taylor G. B., Dunn R. J. H., 2005, MNRAS, 363, 891
- Fabian et al. (2000) Fabian A. C. et al., 2000, MNRAS, 318, L65
- Fabian et al. (2006) Fabian A. C., Sanders J. S., Taylor G. B., Allen S. W., Crawford C. S., Johnstone R. M., Iwasawa K., 2006, MNRAS, 366, 417
- Ghisellini et al. (1992) Ghisellini G., Celotti A., George I. M., Fabian A. C., 1992, MNRAS, 258, 776
- Homan (2005) Homan D. C., 2005, in Romney J., Reid M., ed, ASP Conf. Ser. 340: Future Directions in High Resolution Astronomy, p. 133
- Homan & Wardle (1999) Homan D. C., Wardle J. F. C., 1999, AJ, 118, 1942
- Homan & Wardle (2004) Homan D. C., Wardle J. F. C., 2004, ApJ, 602, L13
- Johnstone et al. (2002) Johnstone R. M., Allen S. W., Fabian A. C., Sanders J. S., 2002, MNRAS, 336, 299
- Kellermann et al. (2004) Kellermann K. I. et al., 2004, ApJ, 609, 539
- Komissarov (1999) Komissarov S. S., 1999, MNRAS, 308, 1069
- Kovalev et al. (2005) Kovalev Y. Y. et al., 2005, AJ, 130, 2473
- Krichbaum et al. (2004) Krichbaum T. P. et al., 2004, in Bachiller R., Colomer F., Desmurs J.-F., de Vicente P., ed, European VLBI Network on New Developments in VLBI Science and Technology, p. 15
- Krichbaum et al. (1992) Krichbaum T. P. et al., 1992, A&A, 260, 33
- Laing & Bridle (2002) Laing R. A., Bridle A. H., 2002, MNRAS, 336, 1161
- Leismann et al. (2005) Leismann T., Antón L., Aloy M. A., Müller E., Martí J. M., Miralles J. A., Ibáñez J. M., 2005, A&A, 436, 503
- Lister & Homan (2005) Lister M. L., Homan D. C., 2005, AJ, 130, 1389
- Ly et al. (2004) Ly C., Walker R. C., Junor W., 2004, American Astronomical Society Meeting Abstracts, 205,
- Marr et al. (1989) Marr J. M., Backer D. C., Wright M. C. H., Readhead A. C. S., Moore R., 1989, ApJ, 337, 671
- Marscher (1987) Marscher A. P., 1987, in Zenzus J. A., Pearson T. J., ed, Superluminal Radio Sources, p. 280
- Marshall et al. (2002) Marshall H. L., Miller B. P., Davis D. S., Perlman E. S., Wise M., Canizares C. R., Harris D. E., 2002, ApJ, 564, 683
- McNamara et al. (2000) McNamara B. R. et al., 2000, ApJ, 534, L135
- Meisenheimer et al. (1996) Meisenheimer K., Röser H.-J., Schlötelburg M., 1996, A&A, 307, 61
- O’Dea et al. (1984) O’Dea C. P., Dent W. A., Balonek T. J., 1984, ApJ, 278, 89
- Pauliny-Toth et al. (1981) Pauliny-Toth I. I. K., Preuss E., Witzel A., Graham D., Kellerman K. I., Ronnang B., 1981, AJ, 86, 371
- Perlman et al. (2003) Perlman E. S., Harris D. E., Biretta J. A., Sparks W. B., Macchetto F. D., 2003, ApJ, 599, L65
- Readhead et al. (1983) Readhead A. C. S., Hough D. H., Ewing M. S., Walker R. C., Romney J. D., 1983, ApJ, 265, 107
- Reynolds et al. (1996) Reynolds C. S., Fabian A. C., Celotti A., Rees M. J., 1996, MNRAS, 283, 873
- Ruszkowski & Begelman (2002) Ruszkowski M., Begelman M. C., 2002, ApJ, 573, 485
- Sanders & Fabian (2002) Sanders J. S., Fabian A. C., 2002, MNRAS, 331, 273
- Sanders et al. (2005) Sanders J. S., Fabian A. C., Dunn R. J. H., 2005, MNRAS, 360, 133
- Schwartz et al. (2006) Schwartz D. A. et al., 2006, ApJ, 640, 592
- Scott et al. (2004) Scott W. K. et al., 2004, ApJS, 155, 33
- Sikora et al. (2005) Sikora M., Begelman M. C., Madejski G. M., Lasota J.-P., 2005, ApJ, 625, 72
- Sikora & Madejski (2000) Sikora M., Madejski G., 2000, ApJ, 534, 109
- Silver et al. (1998) Silver C. S., Taylor G. B., Vermeulen R. C., 1998, ApJ, 502, 229
- Stawarz et al. (2005) Stawarz Ł., Siemiginowska A., Ostrowski M., Sikora M., 2005, ApJ, 626, 120
- Unwin et al. (1982) Unwin S. C., Linfield R. P., Mutel R. L., Philips R. B., 1982, ApJ, 256, 83
- Vermeulen et al. (1994) Vermeulen R. C., Readhead A. C. S., Backer D. C., 1994, ApJ, 430, L41
- Walker et al. (1994) Walker R. C., Romney J. D., Benson J. M., 1994, ApJ, 430, L45
- Wardle et al. (1998) Wardle J. F. C., Homan D. C., Ojha R., Roberts D. H., 1998, Nature, 395, 457