Triggered massive-star formation on the borders of Galactic H II regions
Abstract
Context. Massive-star formation triggered by the expansion of H ii regions.
Aims. To understand if sequential star formation is taking place at the periphery of the H ii region Sh2-219.
Methods. We present 12CO line observations of this region, obtained at the IRAM 30-m telescope (Pico Veleta, Spain).
Results. In the optical, Sh2-219 is spherically symmetric around its exciting star; furthermore it is surrounded along three quarters of its periphery by a ring of atomic hydrogen. This spherical symmetry breaks down at infrared and millimetre wavelengths. A molecular cloud of about 2000 lies at the southwestern border of Sh2-219, in the H i gap. Two molecular condensations, elongated along the ionization front, probably result from the interaction between the expanding H ii region and the molecular cloud. In this region of interaction there lies a cluster containing many highly reddened stars, as well as a massive star exciting an ultracompact H ii region. More surprisingly, the brightest parts of the molecular cloud form a ‘chimney’, perpendicular to the ionization front. This chimney is closed at its south-west extremity by H walls, thus forming a cavity. The whole structure is 7.5 pc long. A luminous H emission-line star, lying at one end of the chimney near the ionization front, may be responsible for this structure. Confrontation of the observations with models of H ii region evolution shows that Sh2-219 is probably 105 yr old. The age and origin of the near-IR cluster observed on the border of Sh2-219 remain unknown.
Key Words.:
Stars: formation – Stars: early-type – ISM: H ii regions – ISM: individual: Sh2-2191 Introduction
We have previously suggested (Deharveng et al. 2003a ) that Sh2-219 is a case
of sequential star formation. Our main argument was the presence of a deeply
embedded cluster at the periphery of the H ii region, just beyond the
ionization front. However, the molecular environment of Sh2-219 was unknown. Here we
present high-angular resolution molecular observations, as well as new near-infrared
(near-IR) and radio continuum observations, followed by a discussion of the morphology of the whole region
in the light of these new data.
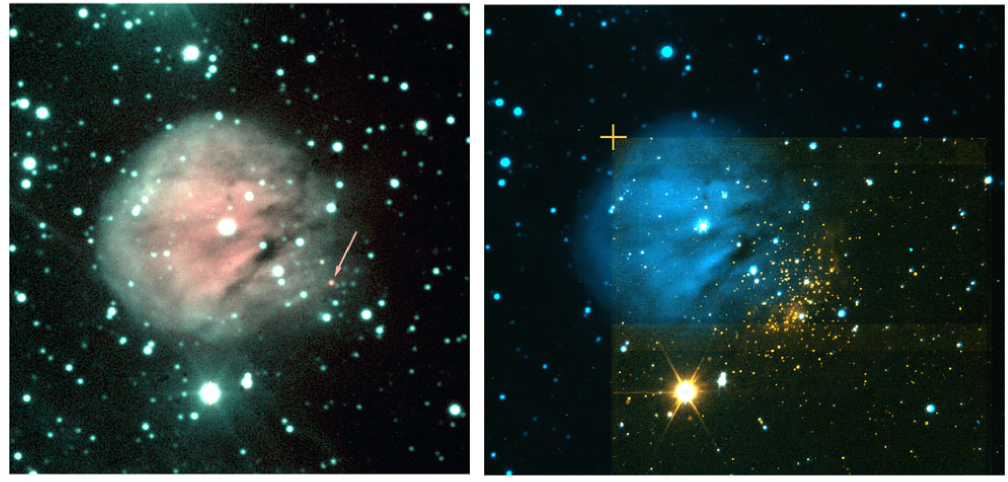
Sh2-219 is an optically-visible H ii region, of diameter 4.4 pc, lying at a distance of kpc (Deharveng et al. 2003a ), in the direction , . It is a nearly perfect Strömgren sphere around a central O9.5V exciting star (see Sect. 5). The mass of the ionized gas is 39 (Leahy lea97 (1997)). Sh2-219 is surrounded by a thick ring of atomic hydrogen, except for a gap in the southwest. This ring has a FWHM of 2–3 pc, a mean density of 9 atoms cm-3, and a mass of 97 (Roger & Leahy rog93 (1993)). We have previously reported (Deharveng et al. 2003a ) the detection in the near- and mid-IR of a cluster southwest of Sh2-219, at the border of the ionized region, and in the direction of the H i gap. This cluster contains highly-reddened objects ( up to 14 mag for objects detected in all three bands). It also contains an H emission-line star (no. 139 in Deharveng et al. 2003a ) presenting a near-IR excess, and an ultracompact (UC) H ii region (Leahy lea97 (1997)). The coordinates of these objects are given in Table 1.
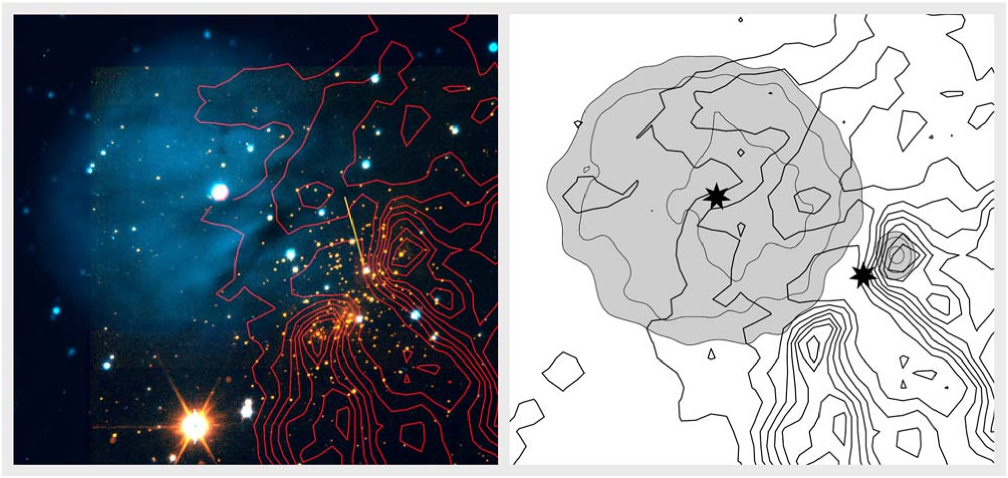
Figure 1 shows Sh2-219 as it appears in the optical and the near infrared.
| Object | RA (2000) | Dec (2000) | ||||
|---|---|---|---|---|---|---|
| h | m | s | ∘ | ′ | ′′ | |
| Exciting star of Sh2-219a | 4 | 56 | 10.61 | +47 | 23 | 35.4 |
| H emission star no. 139a | 4 | 56 | 03.76 | +47 | 22 | 58.2 |
| UC H ii regionb | 4 | 56 | 02.1 | +47 | 23 | 07.0 |
a Deharveng et al. (2003a)
b This paper
2 Observations
2.1 CO observations
In December 2002 we observed the emission of the molecular gas associated with Sh2-219, in the 12CO line (=230 GHz), using the IRAM 30-m telescope (Pico Veleta, Spain). We mapped an area of with the HERA nine-channel heterodyne array (Schuster et al. sch04 (2004)). The beam size of the telescope is at this frequency. The elements of the array are arranged in a matrix, with a separation of on the sky between adjacent elements. The data were acquired by drifting the telescope in right ascension using the standard ‘on-the-fly’ technique. A reference position was taken 10′ east of the H star. It was checked to be free of emission down to 0.15 K in antenna temperature (, in a velocity interval of ) between and . The beam pattern on the sky was rotated by 18.5 degrees with respect to the right ascension axis by means of a K-mirror mounted between the Nasmyth focal plane and the cryostat of the heterodyne array. When drifting the telescope in right ascension, two adjacent rows are separated by , which results in a slightly undersampled map in declination (the Nyquist sampling step is ). Details about the HERA array and the K-mirror can be found at http://www.iram.fr/IRAMFR/PV/veleta.htm.
A digital autocorrelator with a spectral resolution of 78 kHz was used as a spectrometer; the resolution was degraded later to obtain a velocity resolution of at 1.3 mm. The observing conditions were typical for the time of the year, with typical system temperatures of 400 to 500 K. Pointing was checked every 90 minutes by scanning across nearby quasars; it was found to be stable to better than .
Supplementary observations in the C18O and transitions at 219.560319 GHz and 109.782182 GHz, respectively, were carried out at two positions in the nebula, using the ‘standard’ heterodyne receivers at the IRAM 30-m telescope. The weather conditions were very good, with system temperatures of 145 K and 260 K at 3 mm and 1.3 mm respectively.
Given the extended size of the CO-emitting region, the antenna temperature is a satisfactory approximation to the CO line brightness. On the other hand, for the C18O emission, which is much more compact, the main-beam brightness temperature scale is a reasonable approximation to the intrinsic line brightness. We adopt values of 0.70 and 0.50 for the main-beam efficiency at the frequencies of the C18O and transitions respectively.
In all the maps presented hereafter, the coordinates are expressed in arcsecond offsets with respect to the position of the H emission-line star (Table 1).
2.2 Other molecular observations
As part of a larger observational program, we observed Sh2-219 with the Very Large Array on 2005 November 16. We searched for emission from methanol at 44 GHz, water at 22 GHz, and ammonia (in the (1,1) and (2,2) lines) at 23 GHz. The array was in its most compact configuration, providing spatial resolutions of 15 in the 7 mm band and 33 in the 1.3 cm band. The pointing center was RA (2000), Dec (2000), and the primary beam was 1′ and 2′, respectively in the 7 mm and 1.3 cm band. Further observational details will be found in Deharveng et al. (2007, in preparation). With 4 detection limits of 45, 23, and 8 mJy beam-1 for the methanol, water, and ammonia lines, respectively, we failed to detect any of these molecular transitions.
2.3 Near-IR observations
Near-IR observations were carried out through and broad-band filters, and [Fe ii] and narrow-band filters, with the NICS camera (Baffa et al. baf01 (2001)) at the 3.58-m Telescopio Nazionale Galileo (TNG, Canary Islands) on January 4, 2004. The plate scale is /pixel, yielding a field of view of . The and [Fe ii] filters are centred at 2.12 m and 1.67 m respectively. Four pairs of on-source, off-source images on a dithered pattern were acquired through the and [Fe ii] filters (total on-source integration time 10 minutes). Two series of four dithered on-source and off-source images were acquired through the filter (total on-source integration time 80 sec) and one series of on-source and off-source images through the filter (total on-source integration time 80 sec). Flat-field images were obtained from sky observations at sunset through all four filters.
Each frame was first corrected for crosstalk using the routine provided on the TNG web page (http://www.tng.iac.es). Data reduction was then performed by using standard IRAF routines. After flat-fielding all frames, the four off-source images of each series were median-combined and subtracted from each on-source image of the same series in order to remove the background emission. The sky-subtracted images thus obtained were corrected for distortion and bad pixels, and were averaged together.
Aperture photometry was done using the DAOPHOT (Stetson ste87 (1987)) package in IRAF. We selected an aperture FWHM in radius and the sky intensity was estimated from its median value in a -FWHM wide annulus, between 2 FWHM and 3 FWHM from the aperture centre (FWHM in and in ) . Stars were found using DAOFIND and the list was then corrected for false or missed detections after a visual check of the images.
Although the seeing was good, the night was barely photometric, so we calibrated our and photometry by using that performed on the same field by Deharveng et al. (2003a ). We calculated the difference in magnitudes for each coinciding source and plotted it against our derived instrumental . A colour term was present in because of the difference of the and filters. After a best-fit calibration, an rms residual of mag was present in the difference between our photometry and that of Deharveng et al. (2003a ), probably due to the different seeing, to the fact that we are comparing aperture and PSF-fitting photometry, and also possibly to the intrinsic variability of young stars. Our resulting photometry is in the same system as Deharveng et al. (2003a ). Sources brighter than 11 mag in or are in the non-linear range of the detector; in these cases, we adopted the measurements by Deharveng et al. (2003a ). The limiting detection magnitudes are in and in , much deeper than obtained by Deharveng et al. (2003a ). We estimate a completeness limit of by plotting the number of detected sources in 1-mag bins. A total of 616 near-IR sources with detection both in the and in the band and 53 with detection in only one band were found over the field.
As for the narrow-band images, we removed the continuum contribution falling in the band by scaling both the narrow-band and the corresponding broad-band frame ( for and for [Fe ii] according to the signals measured for a few stars in the field (which are line-free, pure-continuum sources) and subtracting one from the other. The resulting frame contains only line emission.
2.4 Radio continuum observations
A radio map of Sh2-219 with a resolution of 40′′, obtained at 20 cm with the VLA D array by Fich (fic93 (1993)), showed a single radio-continuum source. A later 20 cm map, obtained by Leahy (lea97 (1997)) with the VLA C array, had better resolution and showed the presence of an unresolved source south-west of Sh2-219. But no details were given in Leahy’s paper about this ultracompact component.
We used archival VLA data in order to assess the radio properties of both Sh2-219 and the UC H ii region to the south-west. The observations were made at 20 cm and 6 cm in the D and C configurations (programme AL216) and at 20 cm in the B configuration (programme AF346). The B array 20 cm data were consistent with the C array 20 cm data, and for simplicity will not be discussed further.
The AL216 observations were made in January 1991 (C array) and April 1991 (D array). For both observation dates the primary calibrator was 3C48 and the secondary calibrator was 0435+487. The adopted flux densities for 3C48 are 15.41 Jy at 20 cm (1.46 GHz) and 5.16 Jy at 6 cm (4.86 GHz). The boot-strapped flux densities for 0435+487 were 1.25 and 0.52 Jy (at 1.46 and 4.86 GHz, respectively) in January, and 1.24 and 0.51 Jy in April. Data reduction followed standard procedures for VLA continuum data.
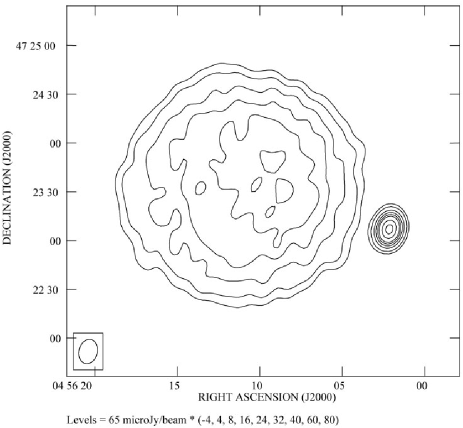
The data obtained in the C configuration at 20 cm provide a uv-coverage similar to those obtained in the D configuration at 6 cm; hence these are the appropriate datasets for comparing the flux densities at the two frequencies, for both Sh2-219 and the UC H ii region. The C configuration’s 6 cm data provide the highest angular resolution and hence give a stronger limit on the size of the UC H ii region. The angular resolutions and noise levels are and 140 Jy beam-1 (C configuration, 20 cm), and 65 Jy beam-1 (D configuration, 6 cm), and and 60 Jy beam-1 (C configuration, 6 cm). The D configuration 6 cm image is shown in Fig. 2.
In addition, a 1.3 cm (23.71 GHz) continuum image was produced from the ammonia observations mentioned in Sect. 2.2. This image has a resolution of and a noise level of 0.2 mJy beam-1.
3 The molecular gas
3.1 Distribution and kinematics
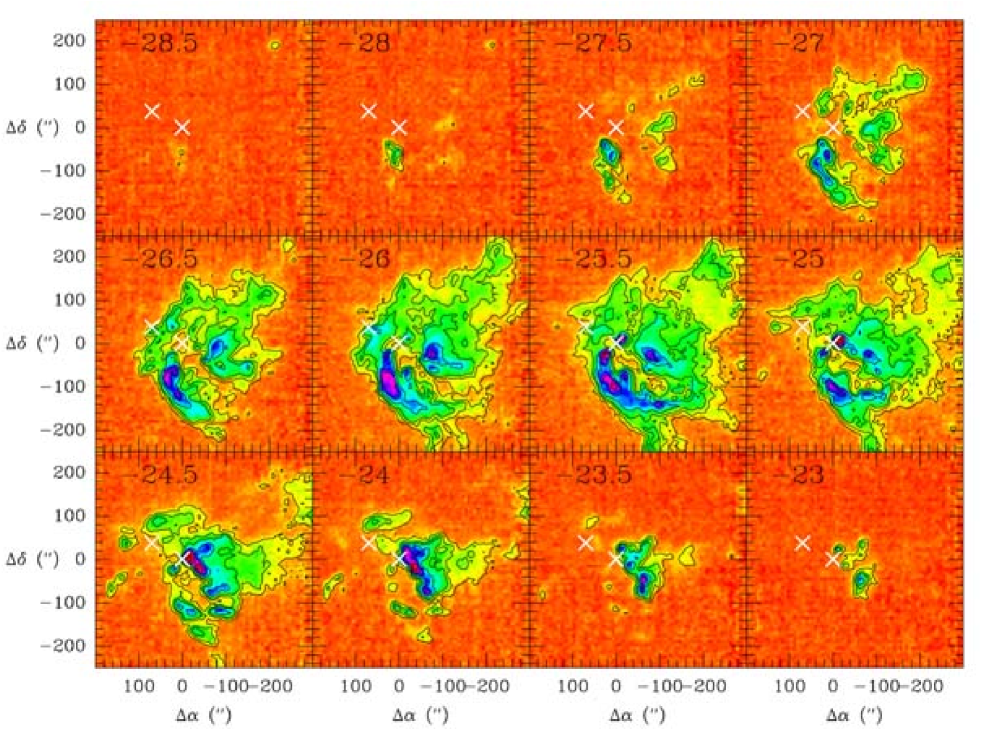
The distribution of integrated CO emission as a function of velocity is shown in Fig. 3. CO emission is detected to the southwest of Sh2-219 as a circular cloud of diameter , adjacent to the H ii region; the CO lines have typical antenna temperatures of 6–10 K. There is no molecular emission observed in the direction of the H i ring, nor is any CO associated with a possible photodissociation region surrounding the ionized gas.
The overall CO emission covers a velocity range of . The molecular emission associated with Sh2-219 is particularly bright in the range to , where the bulk of the emission is detected; the systemic velocity of the cloud is . This is in good agreement with previous velocity measurements (, Blitz et al. bli82 (1982); , Wouterloot & Brand wou89 (1989)). No emission is detected at , the velocity measured for the ionized gas by Fich et al. (fic90 (1990)). Note however that a mean velocity of was measured by Georgelin & Georgelin (geo70 (1970)) for Sh2-219, in good agreement with that of the adjacent molecular cloud.
The CO lines are relatively narrow, about . There is no evidence for a bipolar outflow which could be the signature of ongoing star formation in the cloud. However, detection of compact outflows, typical of UC H ii regions, may be hampered by the spatial undersampling of the data and the low spatial resolution (one telescope beam corresponds to at a distance of 5 kpc).
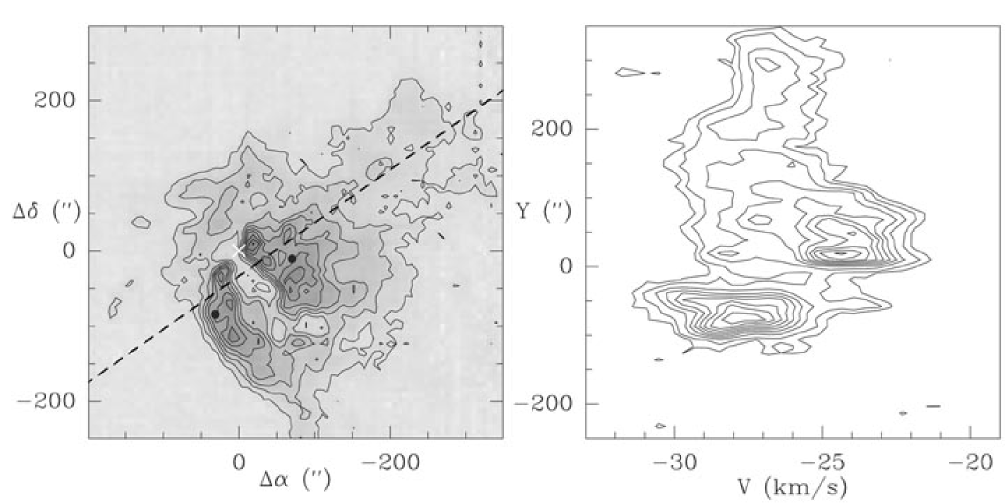
Figure 4 shows the overall distribution of the ionized gas, of the atomic hydrogen, and of the molecular gas. These components are clearly separated. Two maxima of CO emission are found at the ionization front, at offset positions and . Figure 5 shows that these condensations are elongated along the ionization front. The former peak coincides with the UC H ii region (see Sect. 5); this condensation has a beam-deconvolved FWHM of (). The latter peak coincides with some highly-reddened stars in the near-IR cluster. Its beam-deconvolved FWHM is similar (0.5 pc). Also, the CO emission map suggests the presence of a ‘chimney’ in the molecular cloud which nearly splits the cloud in two. This chimney is oriented southwest to northeast (approximate projection angle of ). It is best detected in the blueshifted and redshifted gas (see e.g. the panels at and in Fig. 3), but is nonetheless present in the ambient gas at . The H emission-line star lies near the head of the chimney, and close to its axis. This chimney has an approximate length of 5 pc and a width of 0.5–1.0 pc.
To gain more insight into the kinematics of the cloud, we have studied the profile of the CO emission along a southeast-to-northwest cut across the chimney, i.e. perpendicular to its main axis. Figure 6 shows the CO line intensity along the cut, as a function of the velocity. The gas appears to possess a small velocity gradient of from to . The cavity in the gas is visible as the region of low emissivity near . Two components, with velocities shifted with respect to that of the ambient gas, are detected near this position, one on the northern side at and one on the southern side at (Fig. 6). These components form the walls of the cavity. The southern wall reaches an extreme velocity of , and the northern wall of . This is quite puzzling: it may indicate that the inner walls of the chimney are in rotation around the chimney axis, with the northern wall receding from us and the southern wall approaching us.
Faint CO emission at is observed south of Sh2-219 (). This is most probably foreground emission, unrelated to this region.
3.2 Physical conditions
The brightest CO emission is detected at the head of the chimney, in the two condensations adjacent to the ionization front, with antenna temperatures of up to 12 K, indicating a gas kinetic temperature of K. The CO antenna temperature along the chimney is lower, typically 8–10 K.
The molecular material associated with Sh2-219 has been mapped only in 12CO (2–1), so for the mass determination we rely on the empirical relation between cloud mass and integrated emission . We use the CO to H2 conversion factor mol cm-2 (K km s-1)-1, as determined by Strong & Mattox (str96 (1996)). Including all emission above 1 K km s-1 () this yields . The equivalent radius of the cloud above that emission level is pc. The linewidth of the composite cloud spectrum is km s-1, but this reflects the fact that different parts of the cloud have different velocities (cf. Fig. 3), rather than turbulence. Using the typical profile width (1.5 km s-1; see Sect. 3.1) instead, and assuming a density profile , we find a virial mass , in good agreement with the CO mass derived above, and consistent with the cloud as a whole being in gravitational equilibrium.
Likewise, the mass of the gas associated with the chimney, corresponding to
K km s-1, is 770; the
equivalent radius of this emission region is about 2 pc (only an indicative
value of course, as the chimney emission region is elongated). The
composite CO spectrum of the chimney emission has an equivalent width
of km s-1 - wider than that of the cloud as a whole, because
the chimney gas shows the largest range in velocity (see Figs 3 and 6). Here also,
the individual profiles have a width of about 1.5 km s-1.
Two positions in the cloud, indicated in Fig. 6, were observed in the C18O and lines. The lines are narrow (1 km s-1) and weak: typically K. At offset position () – behind the northern border of the chimney – we find K and K. At this position, the CO antenna temperature is . We have estimated the physical conditions from a simple calculation in the large-velocity gradient approximation, assuming uniform density and temperature in the emitting region. Adopting a kinetic temperature of 15 K and a linewidth of 1.0 km s-1, we obtain and . Adopting a standard C18O abundance of (Frerking et al. fre82 (1982)), this corresponds to an H2 gas column density of . The C18O lines are optically thin with and . The excitation temperature of the transition is only 11 K, i.e. it is not thermalized. On the other hand, the transition is close to thermalization. We also observed the C18O emission at the offset position (), near the southern border of the cloud. The lines intensities are comparable and we derived a similar density and a similar column density in the gas traced by C18O.
If we assume that the emission detected at the two observed positions is representative of the bulk of the chimney gas, the derived , together with the 2 pc radius found from the 12CO-observations, leads to a mass of 270 for the chimney gas. This (very uncertain) value is almost three times less than what is derived from the 12CO-emission. If the two CO clumps are density enhancements (as opposed to regions with an elevated temperature), they would contain much more material than the walls of the chimney and would consequently exhibit stronger C18O lines, which would lead to a higher mass estimate. As no C18O observations were carried out towards the two clumps this cannot be confirmed.
4 The stellar population of the cluster
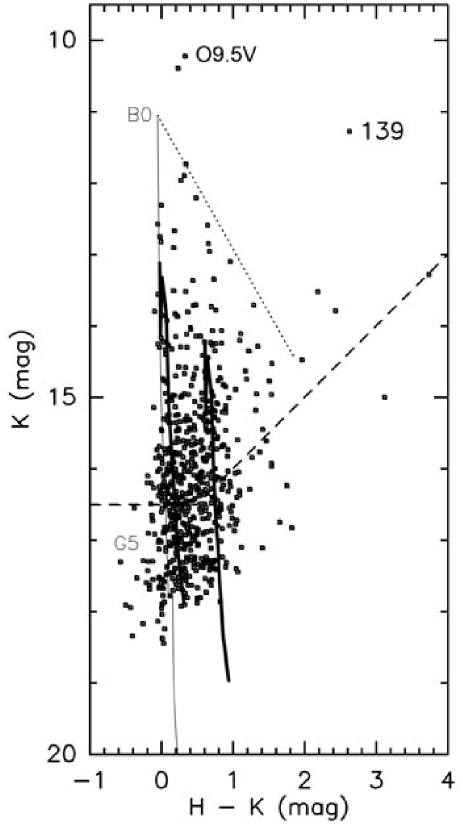
A colour-magnitude ( vs. ) diagram for all sources detected in both bands is shown in Fig. 7. Most of the stars fall in a strip within mag from the ZAMS, but a few sources exhibit larger extinctions (and, possibly, near-IR excesses). This confirms the results of Deharveng et al. (2003a ): their colour-colour diagram ( vs. ; see their fig. 4) shows that most of the sources are consistent with reddened main sequence stars (with mag), whereas only a few exhibit a near-IR excess. However, our present data unveil the presence of a larger number of near-IR sources with mag than are seen in Deharveng et al. (2003a ). These may be the youngest members of the cluster. Note that the brightest of these reddened sources is star no. 139 of Deharveng et al. (2003a ) – the H emission-line star – which is 0.6 mag brighter in than given by their photometry. This may indicate that this source is variable.
To better examine the cluster morphology, we have mapped the stellar surface density by counting all sources (above the completeness limit) in a window with sampling every both east-west and north-south. The result is shown in Fig. 8a. The locations of the sources are marked either by small filled squares () or large squares (). The surface density distribution appears slightly elongated in a direction roughly parallel to the ionization front of the H ii region. The reddened sources (presumably also the youngest stars in the cluster) are even more clearly aligned along it. Most of these sources are located towards the two most prominent CO clumps, at offsets of and .

The radial distribution of the stellar surface density can be shown by counting all sources (above the completeness limit) in -wide annuli centred at the cluster’s centre, at RA (2000), Dec (2000). The result is shown in Fig. 8b. All derived parameters for the cluster are listed in Table 2. From the radial density distribution of Fig. 8b, we have estimated the number of cluster members (down to the completeness limit) as in Testi et al. (tes97 (1997)). The cluster size is derived from the radial density distribution; Table 2 gives the radius at which the surface density falls almost to the background value (15 stars arcmin-2). The completeness limit in mass, , can be estimated from the completeness limit at by adopting a set of evolutionary tracks. From Palla & Stahler (ps99 (1999)), corresponds to a pre-main-sequence star yr old of or yr old of . Assuming an of 10 mag, these mass limits increase to and , respectively. Hence the cluster population is probably well sampled down to stars of . This means that the number of members down to is a lower limit to the total number of members; assuming a Scalo-like IMF (Scalo sca98 (1998)), the correction amounts to a factor between two (for ) and six (for ), without including unresolved companions and stars below the hydrogen burning limit.
| Number of members with | |
|---|---|
| Fraction of members with | 22% |
| Radius | 1.5 pc |
| Expected number of membersa down to 0.1 | 380 (1040) |
| Expected number of membersa with | 2 (4) |
| Total stellar massa | 280 (750) |
a assuming all the stars down to 0.4 (1) have been detected
If we knew the cluster age we could compare it with the dynamical age of the H ii region. As shown in Fig. 7, a simple overlay of pre-main-sequence isochrones indicates that the stellar population is compatible with pre-main-sequence stars yr old. However, the cluster age cannot be constrained by the magnitude-colour diagram, as any isochrones between zero and several megayears are compatible with it. Information about the age comes from the number of sources showing a near-IR excess. Deharveng et al. (2003a ) found only a few sources with a near-IR excess in the vs. diagram. Even assuming that all our sources with do exhibit a near-IR excess, this amounts to only 22% of cluster members (see Table 2). This shortage of sources with a near-IR excess may then suggest a cluster where star formation started more than yr ago (Haisch et al. hai01 (2001)).
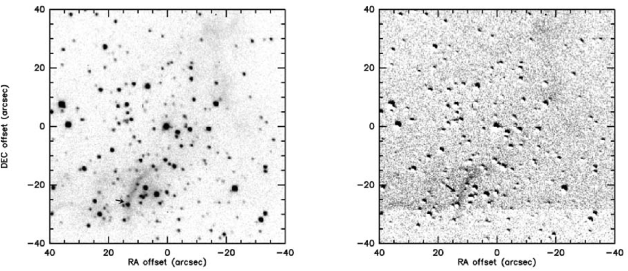
As noted above, the distribution of sources with suggests that most recent star formation occurs parallel to the ionization front, possibly in the two most prominent CO clumps. This is confirmed by the fact that the north-western clump hosts a UC H ii region and that the H emission-line star lies at its edge. As for the south-eastern clump, our image (Fig. 9) shows faint elongated line emission in its direction. This could be the signature of a jet from a young star; we have tentatively identified the driving source with the star indicated in Fig. 9 (, ). But this could be simply fluorescence emission from the surface of the molecular cloud, illuminated by UV radiation leaking from the H ii region. No other knots of H2 line emission have been found in the field and no [Fe ii] line emission has been detected.
5 The ultracompact H II region
Figure 2 gives the 6 cm radio continuum map of Sh2-219, showing the presence of an ultracompact H ii region at its southwestern border. Leahy (lea97 (1997)) showed the 20 cm counterpart of this map, i.e. the 20 cm C configuration map of VLA program AL216, while we show the 6 cm D configuration map. The focus of Leahy (lea97 (1997)) was the Sh2-219 region; that paper did not discuss the UC H ii region to the south-west.
Sh2-219 has a flux density of mJy at 20 cm and of mJy at 6 cm. These values are consistent with an optically thin H ii region, with an ionizing photon flux of log = 47.5. According to the calibration of Martins et al. (mar05 (2005)), this flux corresponds to an O9.5V exciting star, in good agreement with the magnitude of the central exciting star of Sh2-219 (Fig. 7).
The UC H ii region has a flux density of mJy at 20 cm, mJy at 6 cm, and mJy at 1.3 cm. To within the uncertainties, these flux densities are consistent with a thermal spectrum. The deconvolved source size is , corresponding to mpc 12 mpc. The minimum ionizing photon flux required to maintain ionization of the region is log , corresponding to a B0.5V or B1.5V exciting star (according to Panagia pan73 (1973) and Smith et al. smi02 (2002) respectively). Using the 6 cm flux density and the upper limit to the size, we derive a lower limit for the rms electron density in the UC HII region of cm-3. This electron density is slightly higher than the H2 density found in the molecular clumps; this is to be expected as the CO data are averaged over a much larger volume due to the lower spatial resolution.
The density and temperature of the molecular clump surrounding the UC H ii region are too low to provide a pressure high enough to confine the ionized gas. So it seems very unlikely that this UC H ii region is old and has reached pressure equilibrium with its surroundings. Furthermore, the radius of the initial Strömgren sphere of a star with log in a medium of density cm-3 is about 13 mpc – almost exactly the upper limit we report for the size of the observed UC H ii region. Thus it appears that the UC H ii region is quite young, and has not yet had time to expand from its initial size.
6 Discussion
6.1 The H emission-line star no. 139
In the following, we try to estimate the luminosity of the H emission-line star no. 139, observed at the southwestern border of Sh2-219; this star is identified in Fig. 1. This is the brightest star of the near-IR cluster.
The integrated H flux of Sh2-219, from spectrophotometric observations (Caplan et al. cap00 (2000)), is . The H flux of the emission-line star was determined as follows. First, all stars were removed from the H image using DAOPHOT, and the integrated emission of the H ii region was then measured, exempt from stellar pollution, in the instrumental units. This allowed us to calibrate the instrumental units (ADUpixels) with respect to flux units (). Next, with DAOPHOT, the stellar fluxes were measured in instrumental units from both the (original) H image and the [S ii] image. For all except the emission-line star the measured signals in these two filters were proportional (since they measure continuum emission at neighbouring wavelengths but with different filter widths). For the emission-line star, the measured H minus the H expected from the [S ii] filter measurement gave us the star’s instrumental emission-line signal corrected for its stellar continuum. Using our calibration, this difference was then converted to an H emission flux of . At a distance of 5 kpc this corresponds to an H luminosity of ().
The H emission-line star presents a strong near-IR excess which prevents us from accurately determining – and correcting for – its extinction. Assuming that its colour is not affected by the near-IR excess, and that its intrinsic is 0.0 mag, typical of early type stars, the observed of 1.6 mag indicates a visual extinction of mag. This is close to the maximum visual extinction obtained for nearby stars in the cluster from measurements in the three () bands (Deharveng et al. 2003a ). The assumption that star no. 139 has a visual extinction of 15 mag leads to an H luminosity of erg s -1 (); this is an upper limit, as its colour is probably affected by the near-IR excess. A lower limit is obtained assuming a visual extinction of 4 mag, the extinction of interstellar origin affecting Sh2-219 (Deharveng at al. 2003a ); hence an H luminosity of erg s-1 (). The H luminosity of star 139 is typical of pre-main sequence objects with mass loss and – possibly – outflows (Levreault lev88 (1988)).
The H star no. 139 is probably a high-mass Herbig Ae/Be star, similar to MCW1080 or V645Cyg (which display mass loss and are associated with outflows; Levreault lev88 (1988)). It is also similar to object 25 in the AFGL4029 cluster (Deharveng et al. deh97 (1997)), an emission-line object with an H luminosity of (uncorrected for extinction), strong extinction and a near-IR excess.
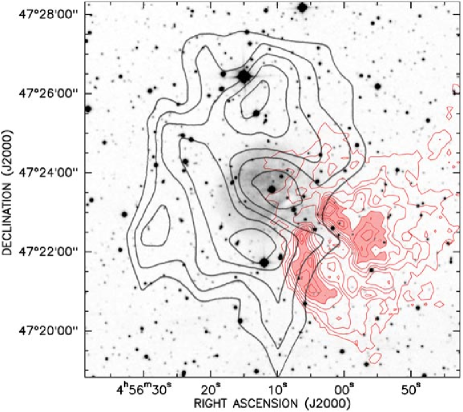
6.2 The CO chimney – H cavity
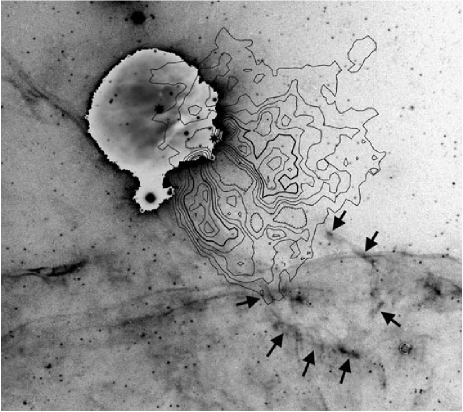
Fig. 10 is a deep H image of Sh2-219, resulting from the addition of six frames (total exposure time of one hour) obtained at the 120-cm telescope of the Observatoire de Haute-Provence. Most of the stars have been subtracted using DAOPHOT; the intensity of the filaments has been enhanced using Photoshop. This H image shows very thin low-brightness filaments south of Sh2-219. Some of these filaments are oriented east-west. They most probably belong to the foreground supernova remnant G160.9+2.6, also known as HB9 (Van den Bergh et al. van73 (1973)), whose distance is kpc (Leahy & Roger lea91 (1991)). Other filaments, indicated by arrows, are oriented north-east to south-west and seem to form the walls of a cavity, closing the molecular chimney at its south-western extremity. For comparison, Fig. 10 also shows the molecular emission superimposed on the H image. The molecular chimney and the H cavity have the same axis. The length of the cavity is 7.5 pc, from the ‘head’ of the chimney in the north-east, near star no. 139, to its southwest extremity. Large-scale Herbig-Haro jets or flows, driven by low-luminosity sources (Reipurth et al. rei97 (1997) and references therein), are known to exist. The largest of these is HH 111, which has a total extent of 7.7 pc, and is driven by a 25 class I source. Also, a few large-scale jets are driven by luminous sources. HH 80-81, for example, with a total extent of 5.3 pc, is driven by a young B star (Martí et al. mar93 (1993)). However, none of these jets or flows are associated with molecular chimneys or cavities.
The H emission-line star no. 139, located at the head of the chimney and near the axis of the cavity, is well positioned to be at the origin of such a structure. Near-IR spectra of this object are needed to ascertain its nature.
6.3 General discussion
Sh2-219 is an almost perfectly spherical H ii region around a central exciting star. Hence this region has probably evolved during most of its lifetime in a rather spherically-symmetric environment. The ionized gas is surrounded by an H i photodissociation region (PDR), except in the south-west. In Sh2-219 the density of the ionized gas is in the range 55–170 cm-3 (Deharveng et al. 2003a ), and, as in all H ii regions, the electron temperature is of the order of K. The surrounding atomic gas is of lower density, 9 cm-3, and of lower temperature, 100–500 K (Hosokawa & Inutsuka hos05 (2005)). Thus the pressure in the ionized zone is higher than in the neutral surrounding zone; the H ii region is presently still in expansion, the ionization front eating away the atomic ring from the inside. According to Roger & Leahy (rog93 (1993)) the H i ring is not expanding; thus it is probably in pressure equilibrium with a lower density and partially ionized external medium.
Using the very simple model of H ii region evolution by Dyson & Williams (dys97 (1997)), we calculate that if Sh2-219 formed and evolved in a uniform medium of density , its present radius of 2.2 pc indicates a dynamical age of yr. This age estimate is very uncertain, because the assumption of evolution in a strictly uniform medium is unrealistic. On the one hand, the exciting star was probably formed in a much denser molecular core; during that early period the region would have evolved more slowly than suggested by the simple model. But on the other hand, we know that the H ii region is expanding into a lower density medium and is therefore presently evolving more rapidly.
Sh2-219 is surrounded by a large atomic photodissociated region. Roger & Dewdney (rog92 (1992)) and Diaz-Miller et al. (dia98 (1998)) have presented models of the time-dependent evolution of photoionized and photodissociated regions formed by stars of various effective temperature embedded in molecular material of uniform density. These models do not include hydrodynamics. They show that the photodissociated region is relatively more extended with respect to the ionized region when the exciting star has an effective temperature below 30 000 K (i.e. for B0–B4 stars), and that it can persist a long time in a low-density medium. This applies well to Sh2-219. However these models are static (they assume that a dissociation equilibrium has been reached); the H2 reformation time is very long in a low density medium, much longer than the dynamical timescale. Thus, as Diaz-Miller et al. (dia98 (1998)) have strongly emphasized, these models are not adapted to regions evolving in a low density medium, as is the case of Sh2-219. We therefore cannot apply these models to Sh2-219 to estimate its age from the relative sizes and masses of the ionized and atomic regions.
Hosokawa & Inutsuka (hos05 (2005)) present new models where
the dynamical evolution of an H ii region and of its PDR is analysed by calculating the
radiation transfer and the thermal and chemical processes with a time-dependent
hydrodynamics code. They illustrate their models with the case of an
O6 star evolving in a 103 cm-3 uniform medium, which applies well
to Sh2-104 (Deharveng et al. 2003b )
but not to Sh2-219. Hosokawa et al. (in preparation) have improved these
models by considering evolution in a non-uniform medium, and by taking into account
photodissociation by the far-UV Galactic background radiation. Hosokawa et al.
have considered the case of Sh2-219. Their model assumes that its exciting star formed
in a cloud composed of a small high-density core (0.07 pc, 105 cm-3) surrounded
by a region of radially decreasing () density.
The model accounts for the size of the ionized region and of the photodissociation region,
and for the densities in the ionized and atomic material. The size of Sh2-219 implies
an age yr. The CO molecule is completely photodissociated in the PDR;
this explains why no CO emission is detected around Sh2-219 (except in the south-west).
We can imagine two widely different scenarios to account for the overall morphology of this region and its star formation history.
-
•
Scenario 1: The exciting star of Sh2-219 formed inside the near-IR cluster, and consequently has the same age. It was subsequently ejected from the cluster following dynamical interactions (for example this may result from a three body encounter implying a binary system and a third star; Kroupa kro00 (2000), kro01 (2001)). If the age of the cluster is yr ( yr), the present location of the exciting star with respect to the cluster implies an ejection velocity 20 km s-1 ( 2 km s-1). Several points argue against this scenario: i) why is it the most massive star of the cluster which has been ejected? ii) why is the present radius of the Strömgren sphere (which depends on several independent parameters) equal to the distance covered by the star since its ejection? iii) the star is presently surrounded by a spherical H ii region and by an almost spherical atomic PDR; how is this spherical symmetry compatible with an ejection (a highly non-isotropic process)? iv) the observed density of the ionized gas is higher than the observed density of the surrounding atomic material; if the star has been ejected from its dense parental molecular cloud into a low-density medium, how can we account for this? Also, it is difficult to eject a massive object from a cluster. It requires, first, mass segregation, which leads to a high density of massive objects in the very centre of the cluster. Ejection of massive objects generally happens several megayears after cluster formation, as shown by Kroupa (kro00 (2000), his fig. 6).
-
•
Scenario 2: The exciting star of Sh2-219 formed first, in a molecular condensation close to – but distinct from – the cloud presently observed. It formed an H ii region and photodissociated most of the surrounding molecular material. During its expansion the H ii region interacted with a nearby pre-existing molecular cloud, forming a layer of shocked compressed material at the surface of the cloud; this material forms the two molecular condensations presently observed at the southwestern border of the Sh2-219 H ii region. Hosowaka et al.’s model predicts that, if the average density of the molecular cloud is cm-3, the time scale of the layer fragmentation is comparable with the estimated age of Sh2-219. Therefore triggered star formation seems possible, the observed cluster being a second-generation cluster whose formation was triggered by the expansion of the Sh2-219 H ii region. It contains one massive star exciting the UC H ii region. A Herbig Be star – the H emission-line star, or another still-hidden object – subsequently modified the structure of the adjacent molecular cloud, its strong wind carving a chimney through it. Here again several points argue against this scenario: i) we are unable to prove that the cluster is younger than the exciting star of Sh2-219. Indeed, the absence of maser emission and the small fraction of stars presenting a near-IR excess seem to indicate that the cluster is possibly older than 105 years; ii) here again the spherical symmetry of the ionized region is difficult to reconcile with the interaction, in one direction, with a nearby molecular cloud.
What observations would allow us to choose between these two scenarios? A measurement of the proper motion of the exciting star of Sh2-219, to confirm or deny the ejection, would be most helpful; but this measurement is not presently possible, this region lying too far away. Deeper near- and mid-IR frames of the cluster would be helpful, allowing an estimate of its age via the fraction of objects with near-IR excesses, and via the presence or absence of deeply embedded (class 0 or class I) objects. Spitzer IRAC observations of this region would probably give this information. High resolution observations of the two CO clumps adjacent to the H ii region could confirm and give details about the interaction between the expanding H ii region and the molecular cloud.
7 Conclusions
The molecular CO observations presented here have shown the presence of a molecular cloud adjacent to the H ii region and filling a ‘gap’ in the ring of atomic hydrogen surrounding the ionized gas. This cloud has a mass of about 2000 . A most remarkable aspect of its morphology is a chimney, 5 pc long, crossing the entire cloud. The Sh2-219 H ii region lies at one extremity of this chimney. The other extremity is closed off by filamentary H walls. We suggest that a bright H emission star, located near the ionization front, may be at the origin of the strong wind or flow which has carved out this chimney.
The Sh2-219 H ii region is in interaction with this adjacent molecular cloud. Two molecular condensations are observed at the interface between the H ii region and the cloud. A near-IR cluster is observed in the direction of this interaction region. It contains highly reddened stars, a luminous H emission star which is also a near-IR excess object, and at least one early B star exciting an unresolved ultracompact H ii region. However no CO outflow and no maser emission are observed in the direction of the cluster, suggesting that it is not very young.
Sh2-219 is one of the H ii regions we proposed as candidates for the collect and collapse process of star formation (Deharveng et al. deh05 (2005)). We now know that star formation does not result from this process, as the observed molecular cloud probably pre-existed, and was not formed of material collected during the expansion of the H ii region. No completely satisfying explanation has been found to explain massive-star formation in this region.
Acknowledgements.
We gratefully thank Takashi Hosokawa for constructing a completely new model to account for the observations of Sh2-219. We also thank D. Gravallon and S. Ilovaisky for obtaining H frames of Sh2-219 in service mode at the Observatoire de Haute-Provence. The suggestions of our referee were helpful. The IRAM 30-m Observatory staff are thanked for their support during the observations. This work is partially based on observations made with the Telescopio Nazionale Galileo (TNG) operated on the island of La Palma by the Fondazione Galileo Galilei of the Istituto Nazionale di Astrofisica at the Spanish Observatorio del Roque de los Muchachos of the Instituto de Astrofisica de Canarias. Observations have been obtained with the VLA at NRAO; the National Radio Astronomy Observatory is a facility of the National Science Foundation operated under cooperative agreement by Associated Universities, Inc. This work has made use of the Simbad astronomical database operated at CDS, Strasbourg.References
- (1) Allen, C. W. 1976, Astrophysical Quantities (3rd ed.), Athlone press, London
- (2) Baffa, C., Comoretto, G., Gennari, S., et al. 2001, A&A, 378, 722
- (3) Blitz, L., Fich, M., & Stark, A. A. 1982, ApJS, 49, 183
- (4) Caplan, J., Deharveng, L., Peña, M., Costero, R., & Blondel, C. 2000, MNRAS, 311, 317
- (5) Deharveng, L., Zavagno, A., Cruz-González, I., et al. 1997, A&A, 317, 459
- (6) Deharveng, L., Zavagno, A., Salas, L., et al. 2003a, A&A, 399, 1135
- (7) Deharveng, L., Lefloch, B., Zavagno, A., et al. 2003b, A&A, 408, L25
- (8) Deharveng, L., Zavagno, A., & Caplan, J. 2005, A&A, 433,565
- (9) Diaz-Miller, R.I., Franco, J., & Shore, S. 1998, ApJ 501, 192
- (10) Dyson, J.E., & Williams, D.A. 1997, The physics of the interstellar medium, 2nd ed., eds R J Tayler & M Elvis, Published by Institute of Physics Publishing, Bristol and Philadelphia
- (11) Fich, L., Dahl, G., & Treffers, R. 1990, AJ, 99, 622
- (12) Fich, M. 1993, ApJS, 86, 475
- (13) Frerking, M.A., Langer, W.D., & Wilson, R.W. 1982, ApJ, 262, 590
- (14) Georgelin, Y.P., & Georgelin, Y.M. 1970, A&A, 6, 349
- (15) Haisch, K.E., Lada, E.A., & Lada, C.J. 2001, ApJ, 553, L153
- (16) Hosokawa, T., & Inutsuka, S.-I. 2005, ApJ, 623, 917H
- (17) Koornneef, J. 1983, A&A, 128, 84
- (18) Kroupa, P. 2000, Massive Stellar Clusters, ASP Conference Series, Vol. 211, p. 233, eds A. Lancon, C. Boily
- (19) Kroupa, P. 2001, The Formation of Binary Stars, IAU Symposium, Vol. 200, p 199, eds H. Zinnecker, R. Mathieu
- (20) Leahy, D.A. 1997, JRASC, 91, 127
- (21) Leahy, D.A., & Roger, R.S. 1991, AJ, 101, 1033
- (22) Levreault, R. 1988, ApJ, 330, 897
- (23) Martí, J., Rodríguez, L.F., & Reipurth, B. 1993, ApJ, 416, 208
- (24) Martins, F., Schaerer, D., & Hillier, D.J. 2005, A&A, 436, 1049
- (25) Palla, F., & Stahler, S. W. 1999, ApJ, 525, 772
- (26) Panagia, N. 1973, ApJ, 78, 929
- (27) Reipurth, B., Bally, J., & Devine, D. 1997, AJ, 114, 2708
- (28) Rieke, G. H., & Lebofsky, M. J. 1985, ApJ, 288, 618
- (29) Roger, R.S., & Dewdney, P.E. 1992, ApJ 385, 536
- (30) Roger, R.S., & Leahy, D.A. 1993, AJ, 106,31
- (31) Scalo, J. 1998, The IMF Revisited: A Case for Variations. In: The Stellar Initial Mass Function, Proc. of the 38th Herstmonceux Conf., Gilmore G., Howell D. (eds.), ASP Conf. Ser., Vol. 142, 201
- (32) Schuster, K.-F., Boucher, C., Brunswig, W., et al. 2004, A&A, 423, 1171
- (33) Smith, L.J., Norris, R.P.F., & Crowther, P.A. 2002, MNRAS, 337, 1309
- (34) Stetson, P.B. 1987, PASP, 99, 191
- (35) Strong, A., & Mattox, J.R. 1996, A&A, 308, L21
- (36) Testi, L., Palla, F., Prusti T., Natta, A., & Maltagliati, S. 1997, A&A, 320, 159
- (37) Van den Bergh, S., Marscher, A., & Terzian, Y. 1973, ApJS, 26, 19
- (38) Wouterloot, J.G.A., & Brand, J. 1989, A&AS, 80, 149