AEGIS: Infrared Spectroscopy of An Infrared Luminous Lyman Break Galaxy at
Abstract
We report the detection of rest–frame 6.2 and 7.7 µm emission features arising from Polycyclic Aromatic Hydrocarbons (PAH) in the Spitzer/IRS spectrum of an infrared-luminous Lyman break galaxy at z=3.01. This is currently the highest redshift galaxy where these PAH emission features have been detected. The total infrared luminosity inferred from the MIPS 24 µm and radio flux density is 21013 L⊙, which qualifies this object as a so–called hyperluminous infrared galaxy (HyLIRG). However, unlike local HyLIRGs which are generally associated with QSO/AGNs and have weak or absent PAH emission features, this HyLIRG has very strong 6.2 and 7.7 µm PAH emission. We argue that intense star formation dominates the infrared emission of this source, although we cannot rule out the presence of a deeply obscured AGN. This LBG appears to be a distorted system in the HST ACS F606W and F814W images, possibly indicating that a significant merger or interaction is driving the large IR luminosity.
1 Introduction
Intensive star formation is a very common phenomenon in galaxies at high redshifts. Most high redshift galaxies are detected because of their high star formation rates, revealed by either the rest–frame UV luminosity in Lyman break galaxies (LBGs, Steidel et al. 2003) or at far–infrared wavelengths in, for example, submillimeter–selected galaxies (SMGs, Chapman et al. 2003). It was long debated if LBGs and SMGs constituted different coeval populations. Recently Chapman et al. (2005) found that some SMGs have similar and colors as LBGs. The Spitzer Space Telescope permits exploration of the rest-frame IR properties of LBGs. For example, Reddy et al. (2006) studied the 24 µm properties of LBGs and considered their relation to other galaxies at that epoch, including SMGs. Huang et al. (2005) reported that 5% of the LBGs at in the sample of Steidel et al. (2003) are detected at 24 µm and they defined this sub-population as Infrared Luminous Lyman Break Galaxies (ILLBG). ILLBGs have infrared properties very similar to sub–mm selected sources (Egami et al., 2004; Huang et al., 2005; Pope et al., 2006). Huang et al. used Spitzer [3.6]–[8.0] and [8.0]–[24] colors to argue that the 24 µm emission from the majority of ILLBGs is powered by intensive star formation.
Observation of high redshift galaxies with the Infrared Spectrograph (IRS, Houck et al. 2004) on board Spitzer permits the study of their 24 µm emission mechanism. Early IRS studies (Houck et al., 2005; Yan et al., 2005) have focused on 24 µm luminous (f1 mJy) and optically faint sources. Most of the objects in both samples of Houck et al. (2005) and Yan et al. (2005) are identified as dusty AGNs at whose spectra show power-law continua and strong silicate absorption but weak or absent emission features arising from the polycyclic aromatic hydrocarbon (PAH) molecules. Lutz et al. (2005) observed two lensed SCUBA sources at with the IRS. Both sources are so–called Hyper–luminous IR galaxies (HyLIRGs, L L⊙) with strong PAH features.
For galaxies at , the Spitzer MIPS 24 µm band detects rest-frame mid–IR continuum emission. At and , the 6.2 and 7.7µm PAH emission features respectively enter into the 24 µm band. Thus, a high redshift, 24 µmselected-sample may preferentially select objects with strong emission-line features in the mid–IR bands. We have been studying just such a sample of LBGs, which have a redshift distribution centered at z=3.0 (Steidel et al., 2003).
This letter presents the IRS spectrum and multiwavelength properties of one ILLBG at detected in the Extended Groth Strip (EGS) area. The multi–wavelength data set from All-wavelength Extended Groth Strip International Survey (AEGIS, Davis et al. 2006) including ACS images permits the study of Spectral Energy Distribution (SED) and morphology of this source. We adopt , , and km s-1 Mpc-1.
2 Multi-Wavelength photometry and Infrared Spectroscopy of an ILLBG
Most ILLBGs in the Huang et al. (2005) sample have 24 µm flux densities of 0.1 mJy, too faint to permit efficient IRS observations.111see http://ssc.spitzer.caltech.edu/irs/documents/irs_ultradeep_memo.pdf Ashby et al. (2006) performed a wide-field deep u’ and g’ imaging survey with the MEGACAM on the MMT, covering the whole EGS and overlapping with deep Subaru R-band imaging and Spitzer/MIPS data. The goal of the MMT/Megacam survey is to obtain an ILLBG sample with higher 24 µm flux density for IRS spectroscopic follow–up. Huang et al. (2006) gave a detailed description of this sample. Objects with strong AGN activity such as QSOs are excluded from the sample using combinations of [3.6][8.0] and [8.0][24] colors (Ivison et al., 2004; Huang et al., 2005). Spectroscopic redshifts for this sample are not yet available. We selected the object that is the subject of this letter, EGS20 J1418+5236 (hereafter as E21, the 21st in the IRS target list) as a LBG with u’-g’1.4, g’-R=0.39, and R=24.30, and with very strong 24 µm emission, mJy.
We obtained a spectrum for E21 with the IRS using the Low-resolution Long-wavelength (LL1) in staring mode, covering 20–39 µm. We observed the source for 24 cycles of 120 s duration. The total on-source integration time was 5851 s. We combined the reduced frames, subtracted residual background counts, and used the SMART package (Higdon et al., 2004) to extract calibrated one-dimensional spectra for both positive and negative beams. The final IRS spectrum is an average of both beams. The spectrum shows a significant detection of 6.2 and 7.7µm PAH emission features at . This is consistent with a typical redshift for –dropout–selected LBGs. Given the presence of multiple emission features in the IRS spectrum here, the redshift accuracy is significantly better than that reported for other sources in the literature. Spectra of other objects often have low S/N, only a single emission feature, or featureless spectrum (e.g., Houck et al. 2005; Yan et al. 2005).
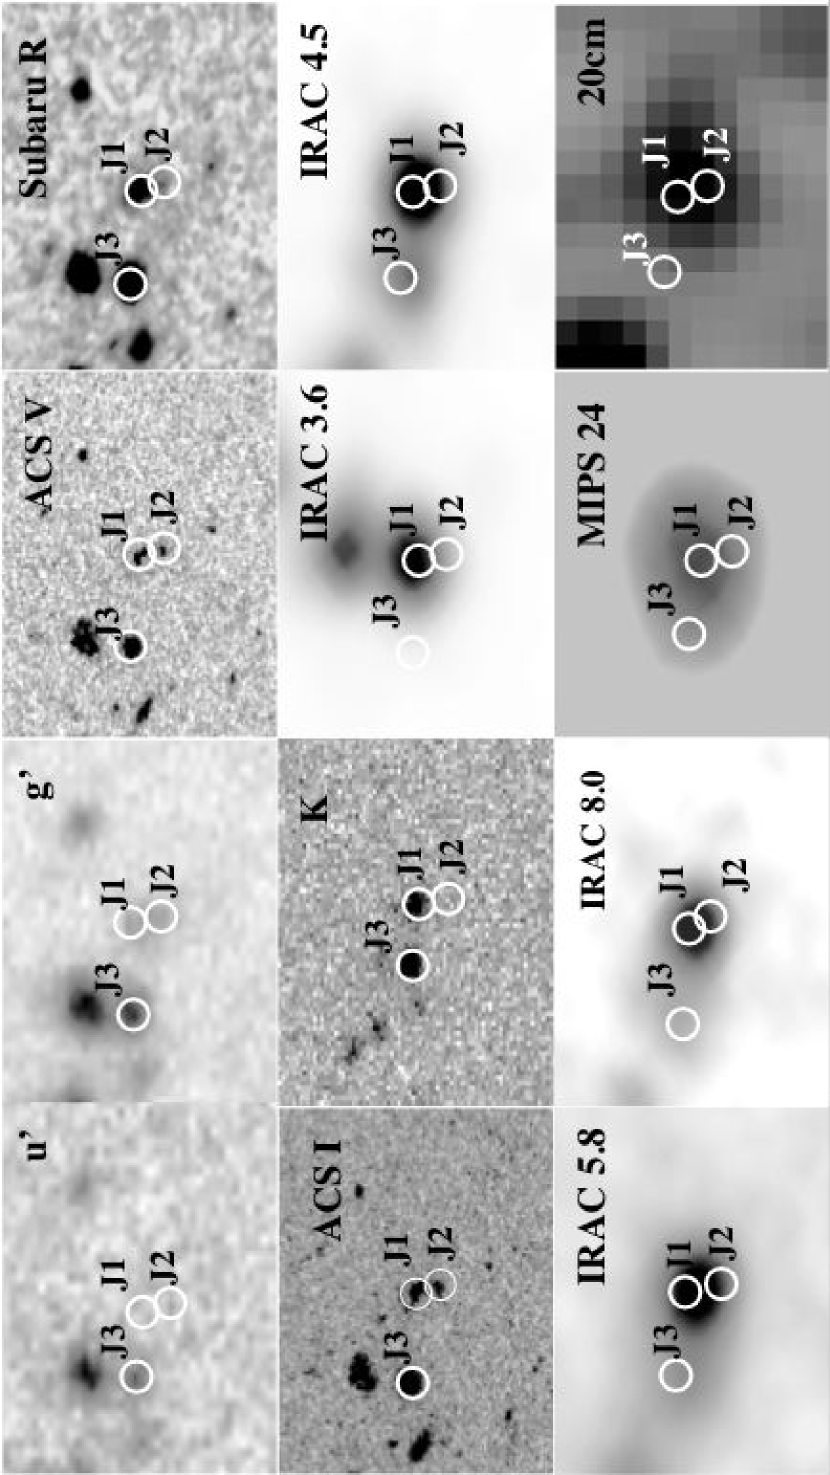
The AEGIS multi-wavelength data set permits the study of E14 from X-ray to 20 cm radio band. While there is a single source in the MMT u’, g’, and Subaru R images, the HST/ACS images resolve this galaxy into two components, which we refer to as J1 and J2 (Figure 2). In addition, another object, called J3, resides 3″ to the east of J1 and J2, and could contaminate the Spitzer IR emission. Strong emission at u’ from J3 suggests that it is at a much lower redshift, and using the full dataset we derive a photometric redshift of . J3 is not detected at 20 cm (5 limit of 42 Jy, compared to the 10 detection of the J1+J2 component with 82 Jy, Ivison et al. 2006). Therefore, we conclude that the J3 component does not contribute to the 24 µm flux density or the emission in the IRS spectrum.
Both J1 and J2 are so–called u’ dropouts (e.g., Steidel et al. 2003) and show low surface–brightness features that connect to J1 and J2 in the ACS V and I band images. The two components are separated by 0″8 or 6.24 kpc at z=3.01. These facts suggest that J1 and J2 belong to an interacting/merging system. The two components have different colors: J1 is red (=0.97), and J2 is blue (=0.65). J1 is detected in both the J and K’ bands, but J2 is not detected to . J1 has =0.88 (or 1.9 in the Vega system). We argue that J1 is mainly responsible for the IRAC, MIPS 24 µm, and radio flux densities and for the emission in the IRS spectrum. With =20.89 for J1 and for J2, J2 may contribute less than 11% of the infrared emission of this system (see Figure 3) .
3 The Infrared Properties of E21
Both the continuum and the 6.2 µm PAH emission feature contribute to the 24 µm flux density (=0.62 mJy) of E21. We measure the continuum emission as 0.55 mJy in the observed wavelength range of 2032.5 µm, thus the contribution of the 6.2 µm PAH emission to the MIPS 24 µm flux density is 0.07 mJy. Most ILLBGs have 24 µm flux densities of 0.06–0.1 mJy (Huang et al., 2005). If other ILLBGs have comparable emission line fluxes, then this line would contribute significantly to their 24 µm flux densities.
The power mechanism for the mid-infrared emission of ILLBGs remains unclear. PAH emission features are associated with intensive star formation (Rigopoulou et al., 1999; Lu et al., 2003; Lutz et al., 2005). Rigopoulou et al. (1999) suggest that the 7.7µm feature-to-continuum ratio, L/C, can be used to classify AGNs and starburst galaxies in ULIRG samples: L/C1 for starburst galaxies and L/C1 for AGNs. Though a few AGN dominated ULIRGs and most type-II AGN could have L/C1 (Lu et al., 2003), a large 7.7µm L/C value does at least suggest that intensive star formation is the dominant energy source. Peeters et al. (2004) argued that the 6.2µm PAH emission feature is a better indicator to separate starbursts and AGNs: QSO and type-I AGNs have typical feature-to-continuum ratio of 0.1, and starburst ULIRGs and type-II AGNs have a lower value in range of . The 6.2 and 7.7µm feature-to-continuum ratios for E21 are 0.40 and 1.8 respectively, consistent with values of starburst ULIRGs. Furthermore, the limit on X-ray emission from E21 in the 200ks Chandra observation (Nandra et al., 2006) is , suggesting the absence of strong AGN activity. Two other high redshift SMGs with IRS spectroscopy are identified as AGN dominated ULIRGs with similar IR luminosities and strong X-ray emission: SMM J02399-0136 at z=2.8 (Lutz et al., 2005), which much like this source has rather strong PAH emission; and CXO J141741.9+582823 at z=1.15 (Le Floc’h et al., 2006), which has no PAH emission features. Furthermore, even when AGN are detected in high–redshift SMGs based on their X–ray emission, Alexander et al. (2005) argue that substantial ongoing star formation dominates the IR emission in these objects. Thus, we argue that intensive star formation is the dominant energy source for the infrared emission of E21. The different types of IR–luminous, high–redshift sources may represent different stages of HyLIRGs: starburst dominated E21 with strong PAH and no X-ray emission; intermediate type SMM J02399-0136 and other SMGs with both PAH and detected X-ray emission; AGN dominated CXO J141741.9+582823 with no PAH but strong X-ray emission.
Currently there is no sub-millimeter observation of this source. We use the 20cm radio flux and -redshift relation (Carilli & Yun, 2000; Dunne et al., 2000; Wang et al., 2004a) to predict that E21 has an 850µm flux density of mJy. Similarity, we derive the rest-frame far-infrared luminosity using the FIR-radio luminosity relation (Condon, 1992; Carilli & Yun, 2000):
| (1) |
| (2) |
where q=log()=2.34, and the radio spectral index . For mJy at z=3.01, is equal to 21013 L⊙, qualifying this source as a HyLIRG.
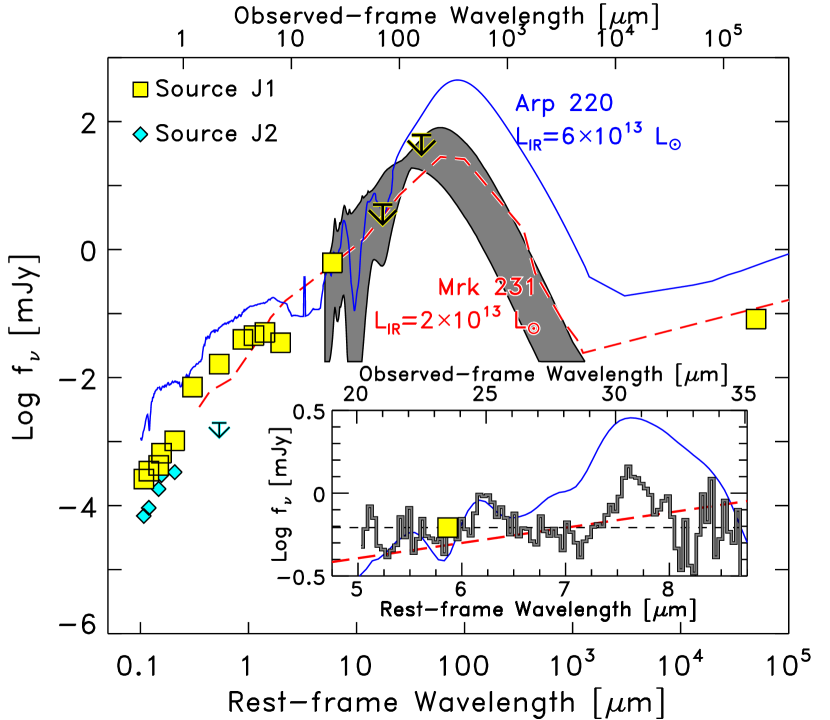
Fitting the SED with various galaxy templates yields a similar IR luminosity. We normalize the SEDs of two local ULIRGs, Arp 220 and Mrk 231, to the 24 µm flux density to predict the total infrared luminosity for this source: 61013 L⊙ and 21013 L⊙ respectively. (Fig. 3). The Arp 220 SED model predicts a much higher far–IR and radio flux density than observed. The Mrk231 SED provides a consistent interpretation to both the 24 µm and radio flux densities, as well as the 70 and 160 µm flux limits. Similarly, figure 3 also compares the observed SED to models with IR luminosity L8-1000μm=1013.2-13.3 L⊙ (i.e., consistent with that derived from the radio emission) from Siebenmorgen & Kruegel (2006). The models broadly agree with the 24 µm flux density (and the limits at 70 and 160 µm) and provide further evidence that the SED is dominated by emission from hot dust. This is also consistent with strong continuum emission in the IRS spectrum. Therefore, given the constraints from the empirical and theoretical models, we conclude that hot dust dominates the far–IR emission in this object.
This source is very unlikely to be amplified due to gravitational lensing. Gravitational lensing is very inefficient for J3 being a lensing galaxy at z=0.79. There are also no clusters or groups found in the area. Furthermore, the galaxy morphologies in the ACS image and color difference of J1 and J2 do not support strong lensing for this source.
The morphology of E21 is reminiscent of those of local ULIRGs. Locally, about one third of ULIRGs have double nuclei with a mean linear separation of 6.2 kpc (e.g., Rigopoulou et al., 1999; Surace & Sanders, 2000). E21 appears to have multiple components in the ACS images, see figure 2. The projected separation of J1 and J2 is 6.75 kpc. UV luminosity is a direct measurement for the relatively unobscured massive star formation in ULIRGs. Though ULIRGs are dusty, they typically have strong UV emission (e.g., Surace & Sanders, 2000), although this emission often stems from separate star–forming regions rather than those that dominate the IR (and bolometric) emission (e.g., Zhang et al. 2001; Wang et al. 2004b). The U (=3414Å) luminosities, , for ULIRGs (Surace & Sanders, 2000) cover a large range from 109 L⊙ to 51011 L⊙ with an average of 21010 L⊙. At z3, the observed J-band probes roughly the rest-frame U band. We use the J-band magnitude to estimate the rest-frame U luminosity for EGS20 J1418+5236, , roughly 1–2% of the bolometric emission. This is consistent with its local IR–luminous galxay counterparts.
4 Conclusions
IRS spectra of EGS20 J1418+5236, a , u–dropout LBG in AEGIS show the 6.2 and 7.7µm PAH emission features. This is currently the highest redshift galaxy where the PAH emission features have been detected. This source has a total infrared luminosity of L8-1000μm=21013 L⊙ inferred from both the 24 µm and radio flux densities. Nearby galaxies with these IR luminosities that are predominantly QSO/AGN, but given the presence of strong PAH emission features and the lack of any evidence for an AGN, we conclude that star–formation dominates the emission from this z=3 ILLBG.
The 24 µm-to-radio flux ratio, strong IRS continuum emission, and upper limits on the flux density at 70 and 160 µm implies that hot dust dominates the far–IR emission in this object, very similar to Mrk 231 and model SEDs of HyLIRGs. Interestingly, the theoretical models that best describe the shape and relative strength of the mid–IR SED require very high extinction values ( mag). Because this object has strong UV emission, we suggest that this LBG contains a deeply embedded starburst in addition to the relatively unobscured stars that dominate the rest–frame UV optical emission. This scenario may explain the general UV–IR properties of the ILLBG population. This example suggests that HyLIRGs at high redshifts can appear as either ILLBGs, or SMGs, or both. Larger samples of galaxies with IRS spectroscopy and measurements of their far-IR SED are clearly needed to confirm these hypotheses.
References
- Alexander et al. (2005) Alexander, D. M., et al. 2005, ApJ, 632, 736
- Ashby et al. (2006) Ashby, M., et al. 2006, in preparation
- Bautz et al. (2000) Bautz, M. W., et al. 2000, ApJ, 543, 119
- Bell et al. (2005) Bell, E., et al. 2005, ApJ,
- Carilli & Yun (2000) Carilli, C. L., & Yun, M., 2000, ApJ, 539, 1024
- Chary & Elbaz (2000) Chary, R. & Elbaz, D., 2000,
- Chapman et al. (2003) Chapman, S., et al., 2003, Nature, 422, 695
- Chapman et al. (2005) Chapman, S., et al., 2005, ApJ, 622, 772
- Colbert et al. (1999) Colbert, J. W., et al., 1999, ApJ, 511,721
- Condon (1992) Condon, J. J., 1992, ARA&A, 30, 575
- Dale & Helou (2000) Dale, D., & Helou, G. 2000, ApJ,
- Davis et al. (2006) Davis, M., et al., 2006, in preparing
- Dunne et al. (2000) Dunne, L., et al., 2000, MNRAS, 319, 813
- Egami et al. (2004) Egami, E. et al. 2004, ApJS, 154, 130
- Förster Schreiber, N., et al. (2003) Förster Schreiber, N., et al., 2003, A&A, 399, 833
- Franx et al. (2003) Franx, M. 2003, ApJ,587, 79
- Genzel et al. (1998) Genzel, R., et al. 1998, ApJ, 498,579
- Higdon et al. (2004) Higdon, S. J. U., et al. 2004, PASP, 116, 975
- Houck et al. (2004) Houck, J., et al. 2004,ApJS, 154, 18
- Houck et al. (2005) Houck, J., et al. 2005,ApJ, 622, L105
- Huang et al. (2005) Huang, J.-S., et al. 2005, ApJ, 634, 137
- Huang et al. (2006) Huang, J.-S., et al. 2006, in preparation
- Ivison et al. (1998) Ivison, R., et al. 1998, MNRAS, 298, 583
- Ivison et al. (2004) Ivison, R., et al. 2004, ApJS, 154, 124
- Ivison et al. (2006) Ivison, R., et al. 2006, in preparation
- Le Floc’h et al. (2006) Le Floc’h, E., et al. 2006, ApJ, this issue
- Lu et al. (2003) lu, N., et al. 2003, ApJ, 588, 199
- Lutz et al. (2005) Lutz, D., et al. 2005, ApJ, 625, 83
- Nandra et al. (2006) Nandra, P. et al. 2006, in preparation
- Papovich et al. (2005) Papovich, C., et al. 2005, ApJ, 631, 101
- Papovich et al. (2006) Papovich, C., et al. 2006, ApJ, 640, 29
- Pope et al. (2006) Pope, A., et al. 2006, MNRAS, in press (astro-ph/0605573)
- Peeters et al. (2004) Peeters, E., et al. 2004, ApJ,613, 986
- Reddy et al. (2006) Reddy, N. A., et al. 2006, ApJ, in press (astro-ph/0602596)
- Rigopoulou et al. (1999) Rigopoulou, D., et al. 1999, AJ, 118, 2625
- Siebenmorgen & Kruegel (2006) Siebenmorgen, R., & Kruegel, E., 2006, A&A, submitted (astro–ph/0606444)
- Steidel et al. (2003) Steidel, C, et al. 2003, ApJ, 592, 728
- Surace & Sanders (2000) Surace, J., & Sanders, D., 2000, ApJ, 120, 604
- Wang et al. (2004a) Wang, W.-H., et al., 2004, ApJ, 613, 655
- Wang et al. (2004b) Wang, Z., et al., 2004, ApJ, 154, 193
- Yan et al. (2005) Yan, L., et al. 2005,ApJ, 628, 604
- Zhang et al. (2001) Zhang, Q., Fall, S. M., & Whitmore, B. C. 2001, ApJ, 561, 727