Spitzer IRAC confirmation of -dropout galaxies in the Hubble Ultra Deep Field:
stellar masses and ages at 11affiliation: Based on observations with the Spitzer Space Telescope, which is
operated by the Jet Propulsion Laboratory, California Institute of Technology under
NASA contract 1407. Support for this work was provided by NASA through contract
125790 issued by JPL/Caltech. Based on observations with the
NASA/ESA Hubble Space Telescope, obtained at the Space
Telescope Science Institute which is operated by AURA, Inc.,
under NASA contract NAS5-26555. Based on service mode observations collected at
the European Southern Observatory, Paranal, Chile (ESO Program 073.A-0764A).
Abstract
Using Spitzer IRAC mid-infrared imaging from the Great Observatories Origins Deep Survey, we study -dropout sources in the Hubble Ultra Deep Field. After carefully removing contaminating flux from foreground sources, we clearly detect two -dropouts at m and m, while two others are marginally detected. The mid-infrared fluxes strongly support their interpretation as galaxies at , seen when the Universe was only 750 Myr old. The IRAC observations allow us for the first time to constrain the rest-frame optical colors, stellar masses, and ages of the highest redshift galaxies. Fitting stellar population models to the spectral energy distributions, we find photometric redshifts in the range , rest-frame colors , -band luminosities , stellar masses , stellar ages Myr, star formation rates up to yr-1, and low reddening . Overall, the galaxies appear substantially less massive and evolved than Lyman break galaxies or Distant Red Galaxies at , but fairly similar to recently identified systems at . The stellar mass density inferred from our sample is Mpc-3 (to 0.3), in apparent agreement with recent cosmological hydrodynamic simulations, but we note that incompleteness and sample variance may introduce larger uncertainties. The ages of the two most massive galaxies suggest they formed at , during the era of cosmic reionization, but the star formation rate density derived from their stellar masses and ages is not nearly sufficient to reionize the universe. The simplest explanation for this deficiency is that lower-mass galaxies beyond our detection limit reionized the universe.
Subject headings:
galaxies: evolution — galaxies: high redshift — infrared: galaxies1. Introduction
Observations of massive galaxies at high redshift with the Hubble Space Telescope and the Spitzer Space Telescope are revolutionizing our knowledge of the early formation history of stars and galaxies. Blue star forming galaxies at with stellar masses are routinely identified from optical imaging (Steidel et al. 1996a,b,2004), and have been studied in detail (e.g., Papovich, Dickinson, & Ferguson, 2001, Shapley et al. 2001,2005), while near-infrared surveys at have uncovered substantial numbers of redder, more evolved galaxies with larger stellar masses (Franx et al., 2003; Yan et al., 2004; Daddi et al., 2005). Some of these red galaxies appear to have stellar ages Gyr, implying that they formed most of their stars before (Labbé et al., 2005), and suggesting that massive galaxies should exist well beyond these redshifts. Direct detection of such galaxies would place strong constraints on galaxy formation models (e.g., Somerville et al. 2001; Nagamine et al. 2005).
Tantalizingly, the most recent surveys with the Advanced Camera for Surveys (ACS) and the Near-Infrared Camera and Multiobject Spectrograph (NICMOS) on the Hubble Space Telescope have identified sources at with fairly evolved stars and stellar masses of (e.g., Yan et al., 2005; Eyles et al., 2005; Dow-Hygelund et al., 2005) or perhaps more (Mobasher et al., 2005). Critical for these results was access to the rest-frame wavelengths longward of the Balmer/4000 Å break offered by the InfraRed Array Camera (IRAC; Fazio et al. 2004) on Spitzer. Without mid-infrared photometry to very faint magnitudes the stellar ages and masses of galaxies are poorly constrained.
In this Letter, we extend mass estimates to by analyzing the mid-infrared fluxes of 6 -dropout candidates found in the Hubble Ultra Deep Field (UDF) by Bouwens et al. (2004, hereafter B04). These candidates were selected from exceptionally deep optical ACS (Beckwith et al. in prep) and near-infrared NICMOS imaging (Thompson et al., 2005), and when combined with the ultradeep IRAC data available there, offer us an ideal opportunity to verify their reality and to study their stellar populations. The stellar masses and ages of -dropout galaxies would provide us with the first direct look at galaxy formation at , building on the comprehensive study (Bouwens et al. 2006b). Where necessary, we assume an cosmology with km s-1Mpc-1. Magnitudes are expressed in the AB photometric system.
2. Observations
The Great Observatories Origins Deep Survey (GOODS; Dickinson et al., in prep) observed the UDF with IRAC in two epochs, each time integrating for hours in the , and m channels.111This paper uses data release DR3 of epoch 1 and data release DR2 of epoch 2, available from http://data.spitzer.caltech.edu/popular/goods/ We estimate limiting depths in the combined IRAC images by measuring the effective flux variation in random apertures on empty background regions. The limits for point sources are 27.7, 27.2, 25.1, and 24.9 in the four channels (1, total, 25 diameter aperture). We supplement the observations with deep -band data from the Very Large Telescope and Magellan (Labbé et al. in prep) and we use an independent reduction of UDF NICMOS data with improved noise properties and fewer artifacts (Bouwens & Illingworth, 2006, hereafter B06). The new NICMOS images revealed that 2 of the original 6 -dropouts were electronic ghosts of nearby bright stars; hence we removed them from the sample.
Matching ACS/NICMOS and IRAC photometry is challenging because of the much larger size and extended wings of the IRAC point-spread functions (PSFs) resulting in flux contamination by nearby foreground sources. Visual inspection shows that 2 -dropouts are substantially blended and all 4 are likely to contain at least some flux from nearby objects. We have developed a technique to robustly subtract the contaminating flux (Labbé et al., in prep). Briefly, we first detect sources with SExtractor (Bertin & Arnouts, 1996) in a summed NICMOS image to determine the light distributions at high resolution using the pixels in the “segmentation” maps. We then convolve these template images individually with a carefully constructed kernel to match it to the IRAC PSF. Third, we fit all detected sources, including neighbors, simultaneously to the registered IRAC image, leaving only the flux scalings as free parameters. Finally, we subtract the best-fit images of all neighboring sources.
| ID | 3.6m | 4.5m | ||||
|---|---|---|---|---|---|---|
| 964 | 26.80.2 | 26.80.2 | 27.00.9 | 26.10.2 | 26.40.5 | |
| 1417 | 28.00.2 | 26.70.2 | 26.30.2 | 26.10.3 | 25.30.1 | 25.50.2 |
| 950 | 26.90.2 | 26.60.2 | 27.00.5 | 26.40.5 | ||
| 1125 | 29.20.7 | 27.30.4 | 27.20.3 | 26.90.4 |
After cleaning the IRAC images, we performed conventional aperture photometry in , and m bands in 25 diameter apertures. Photometry in the ACS , NICMOS , and bands was done in 09 diameter apertures and we obtained magnitudes and limits consistent with B04. We summarize the photometry in Table 1.
3. Mid-Infrared Fluxes of -dropout sources
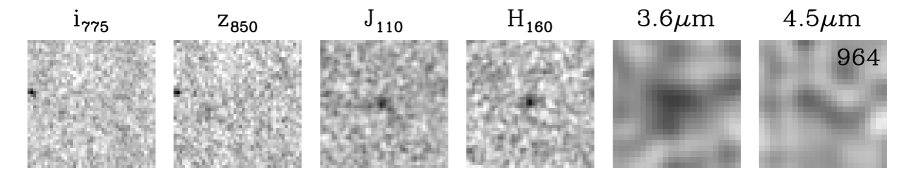
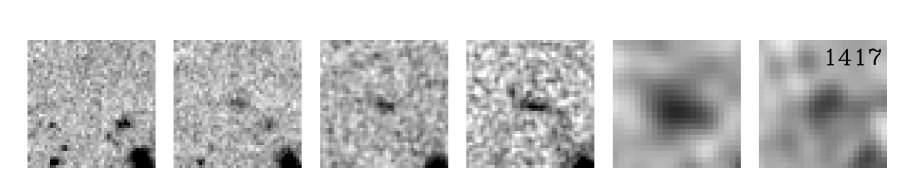
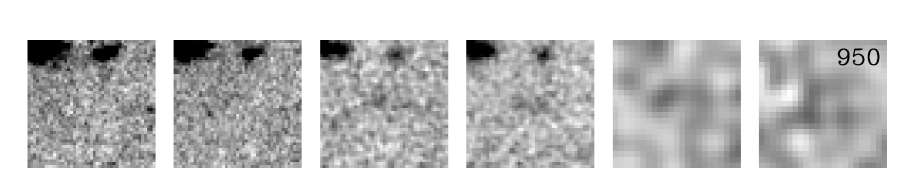
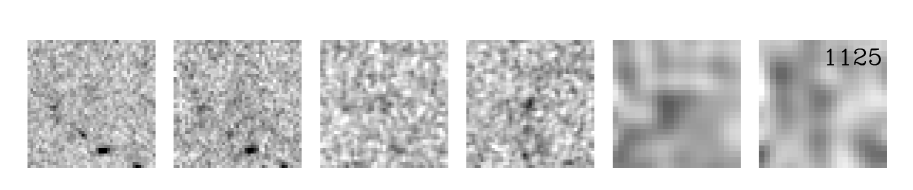
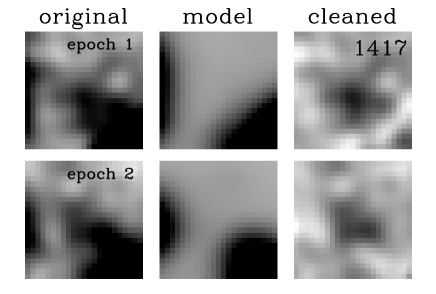
Figure 1 shows the HST/ACS+NICMOS and the combined Spitzer/IRAC images of the dropouts. Two objects (ID 964 and 1417) are unambiguously detected in m () and in the slightly shallower m (. Two others (ID 950 and 1125) are only marginally detected, but are probably real as the sum of their and m images reveals a visible source. Unfortunately, the IRAC observations are not deep enough to definitively confirm or reject the reality of the undetected sources. None of the candidates are visible at and m. To evaluate the robustness of the deblending photometry, we performed the procedure independently on the first and second epoch IRAC data (see Figure 2). Reassuringly, we measure consistent fluxes and we detect the brightest, most promising sources 964 and 1417 in each dataset individually.
The m magnitudes are faint, ranging from 25.3 to 27.0, with m colors in the range -0.4 to 1.0. The IRAC detected objects 964 and 1417 are the reddest, showing a factor of rise in flux densities between and m, while the SEDs are flatter at m and m (see Table 1). The rise at m is similar in strength to what is found in spectroscopically confirmed galaxies at (Yan et al., 2005; Eyles et al., 2005), and suggests the presence of a substantial redshifted Balmer break, indicative of evolved stellar populations.
4. Stellar Populations of galaxies
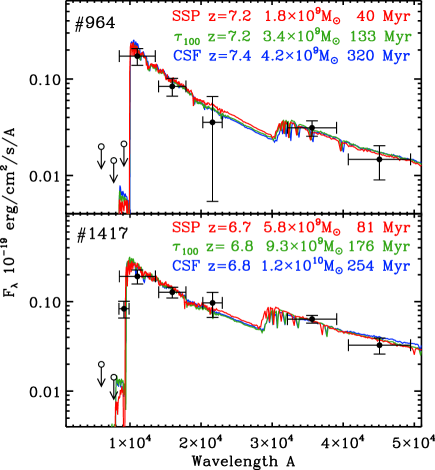
We fit stellar population synthesis models of Bruzual & Charlot (2003) and a Calzetti et al. (2000) obscuration law to the broadband fluxes to constrain the stellar populations. The models assume Solar metallicity and a Salpeter initial mass function (IMF) between 0.1 and 100 . We explore three different star formation histories (SFHs): a single age burst (SSP), an exponentially declining star formation rate (SFR) with a timescale of 100 Myr (), and constant star formation (CSF). We leave the redshift, mass, age, and extinction as free parameters.
We find acceptable fits for all sources (see Table 2 and Figure 3) and obtain confidence intervals on the parameters with Monte Carlo simulations. The best-fit redshifts vary from 6.7 to 7.4 and most Monte Carlo solutions are in a narrow range around the best fit indicating that the redshift is well constrained. Old stellar populations at fit the data poorly as they do not reproduce the strong break across the , and bands and the blue near-infrared continuum. Even so, we note that 3% and 11% of the solutions for object 1417 and 1125, allowed a redshift of when the random flux variations “conspired” to suppress the break. The best-fit models have average rest-frame optical colors of and band luminosities for the IRAC-detected (undetected) sources.
| Solar metallicity | ||||||
| ID | Mass | Agew | SFR | |||
| (Myr) | ( yr-1) | |||||
| Single Age Burst (SSP) | ||||||
| 964 | 7.2 | 1.8 | 40 | 0.0 | 0.0 | 1.5 |
| 1417 | 6.7 | 5.8 | 81 | 0.1 | 0.0 | 0.8 |
| 950 | 7.2 | 1.0 | 25 | 0.0 | 0.0 | 1.4 |
| 1125 | 7.0 | 0.7 | 32 | 0.0 | 0.0 | 0.9 |
| Exponentially Declining SFR (e-folding time Myr; ) | ||||||
| 964 | 7.2 | 3.4 | 133 | 0.0 | 5.2 | 1.2 |
| 1417 | 6.8 | 9.3 | 176 | 0.2 | 10.7 | 0.7 |
| 950 | 7.3 | 0.6 | 35 | 0.0 | 9.4 | 1.1 |
| 1125 | 7.1 | 0.9 | 77 | 0.0 | 4.4 | 0.8 |
| Constant Star Formation (CSF) | ||||||
| 964 | 7.4 | 4.2 | 320 | 0.0 | 7.3 | 1.3 |
| 1417 | 6.8 | 11.5 | 254 | 0.4 | 25.5 | 0.9 |
| 950 | 7.3 | 0.7 | 40 | 0.0 | 9.9 | 1.1 |
| 1125 | 7.0 | 1.0 | 127 | 0.0 | 4.5 | 0.8 |
Determinations of the stellar population age and mass depend on the assumed star formation history and metallicity. For the whole sample, models fit the best, with ages of Myr and instantaneous SFRs of yr-1. Converting the rest-frame Å luminosities directly into (absorption-corrected) SFRs (Madau et al., 1998) results in similar values. Nevertheless, the degeneracy between age and dust prevents us from placing firm limits on the ages and SFRs. The stellar masses are generally better constrained. As expected, the IRAC-detected galaxies 964 () and 1417 () are the reddest, most massive, and oldest in the sample. The average uncertainties on the masses are approximately a factor of .
The extreme SSP and CSF models set lower and upper boundaries to the masses, ages, and SFRs, whereas assuming sub-Solar metallicities () instead of Solar results in 30% higher ages and 20% higher masses. Because all SFHs and metallicities provide equally acceptable fits to the data, we will hereafter adopt the mean of the SSP and CSF models and both metallicities as our fiducial values. We then find ages of Myr, masses of , low reddening , and star formation rates of yr-1.
5. Discussion
Using the GOODS dataset (Dickinson et al. in prep), we have estimated and analyzed the Spitzer/IRAC mid-infrared fluxes of 4 -dropouts candidates, which were identified in the UDF by B04 and remeasured more accurately in B06. The sources are rare, with a surface density of 0.7 arcmin-2, and very faint, with observed magnitudes of and , placing them well beyond the spectroscopic capabilities of current telescopes, but in reach of future facilities such as JWST and ALMA. IRAC directly confirms the reality of two sources, while two others are marginally detected. Modeling of the broadband fluxes strongly supports their interpretation as galaxies with substantial stellar masses and ages Myr.
Using the redshift selection function for the -dropout sample (B04), we obtain an effective volume of 9000 Mpc3 to and we infer a stellar mass density of Mpc-3. Comparing to the stellar mass density at lower redshifts, computed using similar techniques to similar luminosities, we find a continuing decrease where the density at is 95%, 22% of that at (Yan et al., 2006; Stark et al., 2006). Recent Smooth Particle Hydrodynamics (SPH) simulations in a CDM universe predict stellar mass- and number densities for massive (M☉) galaxies of Mpc-3 and Mpc-3 (SPH G6 run, Nagamine et al. 2005), remarkably close to the minimum estimates for our sample ( Mpc-3 and Mpc-3 to the same mass limit). However, we cannot exclude additional stellar mass residing in massive non-starforming or dust-enshrouded galaxies, which the -dropout criteria would have missed.
The ages of the two most massive (IRAC-detected) -dropouts suggest that the bulk of their stellar mass formed at even higher redshifts , during the epoch of cosmic reionization (Spergel et al., 2006). We can place a simple upper limit on the contribution of high-mass galaxies to reionization, by calculating the maximum SFR densities implied by the observed stellar masses and ages for these objects. Taking the maximum masses and dividing it by the minimum ages (Myr), we infer a substantial SFR density 0.04 M☉yr-1 Mpc-3. This is higher than calculated directly from the rest-frame UV luminosities at to the same limits (Bouwens et al., 2006b), but still more than times too small to reionize the universe at the lowest probable redshift (Spergel et al., 2006) for canonical assumptions (Madau et al., 1999; Bouwens et al., 2006b, see also Yan et al. 2006).
The simplest explanation for the lack of ionizing photons provided by high-mass galaxies at is that low-mass galaxies beyond our current detection limits were primarily responsible for reionization (Lehnert & Bremer, 2003; Yan & Windhorst, 2004; Bouwens et al., 2006b). Other possibilities are that massive galaxies are missing from current surveys and are unaccounted for in the models, or that the observed galaxies had a top heavy IMF, which would increase the ionizing efficiency per unit stellar mass. Obviously, incompleteness, sample variance, and large scale structure dominate the uncertainties in our results. Larger, very deep near-infrared surveys from the ground and from space will address this issue in more detail.
References
- Bertin & Arnouts (1996) Bertin, E. & Arnouts, S. 1996, A&AS, 117, 393
- Bouwens et al. (2004) Bouwens, R. J., et al. 2004, ApJ, 616, L79 (B04)
-
Bouwens & Illingworth (2006)
Bouwens, R. J., & Illingworth, G. D., 2006, Nature, in press
astro-ph/0607087 (B06) - Bouwens et al. (2006b) Bouwens et al. 2006b, ApJ, in press, astro-ph/0509641
- Bruzual & Charlot (2003) Bruzual, G. & Charlot, S. 2003, MNRAS, 344, 1000 (BC03)
- Calzetti et al. (2000) Calzetti, D., et al. 2000, ApJ, 533, 682
- Daddi et al. (2005) Daddi, E., et al. 2005, ApJ, 626, 680
- Dow-Hygelund et al. (2005) Dow-Hygelund, C. C., et al. 2005, ApJ, 630, L137
- de Jong et al. (2006) de Jong, R. S., et al. 2006, NICMOS ISR 2006-001
- Eyles et al. (2005) Eyles, L. P., et al. 2005, MNRAS, 364, 443
- Fazio et al. (2004) Fazio, G. G., et al. 2004, ApJS, 154, 10
- Förster Schreiber et al. (2004) Förster Schreiber, N. M., et al. 2004, ApJ, 616, 40
- Franx et al. (2003) Franx, M. et al. 2003, ApJ, 587, L79
- Labbé et al. (2005) Labbé, I., et al. 2005, ApJ, 624, L81
- Lehnert & Bremer (2003) Lehnert, M. D., & Bremer, M. 2003, ApJ, 593, 630
- Madau et al. (1998) Madau, P., Pozzetti, L., & Dickinson, M. 1998, ApJ, 498, 106
- Madau et al. (1999) Madau, P., Haardt, F., & Rees, M. J. 1999, ApJ, 514, 648
- Mobasher et al. (2005) Mobasher, B., et al. 2005, ApJ, 635, 832
- Nagamine et al. (2005) Nagamine, K., et al. 2005, ApJ, 627, 608
- Papovich, Dickinson, & Ferguson (2001) Papovich, C., Dickinson, M., & Ferguson, H. C. 2001, ApJ, 559, 620
- Stark et al. (2006) Stark et al., 2006, submitted to ApJ, astro-ph/0604250
- Steidel et al. (1996a) Steidel, C. C., et al. 1996, AJ, 112, 352
- Steidel et al. (1996b) Steidel, C. C., et al. 1996b, ApJ, 462, L17
- Steidel et al. (2004) Steidel, C. C., et al. 2004, ApJ, 604, 534
- Somerville et al. (2001) Somerville, R. S., Primack, J. R., & Faber, S. M. 2001, MNRAS, 320, 504
- Shapley et al. (2001) Shapley, A. E., et al. 2001, ApJ, 562, 95
- Shapley et al. (2005) Shapley, A. E., et al. 2005, ApJ, 626, 698
- Spergel et al. (2006) Spergel et al., 2006, submitted to ApJ
- Thompson et al. (2005) Thompson, R. I., et al. 2005, AJ, 130, 1
- Yan et al. (2004) Yan, H., et al. 2004, ApJ, 616, 63
- Yan & Windhorst (2004) Yan, H., & Windhorst, R. A. 2004, ApJ, 600, L1
- Yan et al. (2005) Yan, H., et al. 2005, ApJ, 634, 109
- Yan et al. (2006) Yan, H., et al. 2006, ApJ, in press