22email: pmelchior@ita.uni-heidelberg.de
Reliable Shapelet Image Analysis
Abstract
Aims. We discuss the applicability and reliability of the shapelet technique for scientific image analysis.
Methods. We quantify the effects of non-orthogonality of sampled shapelet basis functions and misestimation of shapelet parameters. We perform the shapelet decomposition on artificial galaxy images with underlying shapelet models and galaxy images from the GOODS survey, comparing the publicly available IDL implementation with our new C++ implementation.
Results. Non-orthogonality of the sampled basis functions and misestimation of the shapelet parameters can cause substantial misinterpretation of the physical properties of the decomposed objects. Additional constraints, image preprocessing and enhanced precision have to be incorporated in order to achieve reliable decomposition results.
Key Words.:
methods: data analysis – techniques: image processing – surveys1 Introduction
Image analysis is the crucial technique and the prime objective in all observational sciences. Computer-based image analysis is supposed to provide us with information that human perception is not or only hardly capable of extracting, due to either the vast amount of data or the required accuracy. The decomposition of imaged objects into an orthogonal function set and analysis of the expansion coefficients is the preferred way of conducting image analysis since sufficient computer power is available.
Refregier (2003) proposed the ’shapelets’ function set, composed of a scalable version of the eigenfunctions of the harmonic oscillator in quantum mechanics. They form an orthonormal basis set of Gauss-Hermite polynomials. Because of their continuity, finite extent and their smooth peaks, they offer themselves for decomposing galaxy images or the like. In particular, they were proposed as an image processing and analysis technique for weak-lensing studies (Refregier & Bacon 2003; Chang et al. 2004; Massey et al. 2005; Goldberg & Bacon 2005; Kuijken 2005; Heymans et al. 2006; Massey et al. 2006), morphological classification of galaxies (Kelly & McKay 2004) and Sun spots (Young et al. 2005), and also in the field of medical computer tomography (Weissman et al. 2004).
So far, the shapelet technique has proven to reconstruct the decomposed objects from the set of expansion coefficients in a way which looks visually good; i.e. differences to the originals are marginal (Refregier 2003). Massey & Refregier (2005) defined a goodness-of-fit measure to quantify, what a good reconstruction means: the residuals have to be at noise level. For achieving that, the decomposition has to be optimized with respect to a set of parameters. As the parameters space is highly degenerate, additional constraints are necessary to choose a particular point in this space. But it is yet unknown, if the selection of these constraints or the accuracy with which their fulfillment is verified introduces an uncertainty in or even a bias on the expansion coefficients. In fact, every study of object properties derived from shapelet coefficients might be affected by a yet unclear error contribution.
Another object of concern is the computational complexity. Since the shapelet method is known to be slow compared to other image analysis techniques, it is important to find ways to speed up the execution.
This paper is organized as follows: In sect. 2, we summarize the basic relations for the shapelet function set and describe the procedure for finding optimal decomposition parameters. In sect. 3, we discuss potential problems that can arise from the optimized decomposition procedure. In sect. 4, we show how these problems can be remedied by means of additional constraints and image preprocessing. In sect. 5, we compare the design choices, the decomposition results (of artificial and observed galaxy images), the errors made by and the computational performance of two shapelet implementations, the publicly available IDL code and our independently developed C++ code. We conclude in sect. 6.
2 Shapelet basics
Following the work by Refregier (2003), the shapelet decomposition allows us to approximate a two-dimensional object (for example a galaxy image whose brightness distribution is given by , centered at ) by a finite series
| (1) |
where and . The two-dimensional shapelet basis functions
| (2) |
are related to the one-dimensional Gauss-Hermite polynomials
| (3) |
with being the Hermite polynomial of order .
These definitions imply that the shapelets’ operating range is limited by
| (4) |
denoting the maximal and minimal size of features in the images that can be faithfully described by a decomposition using and .
After the decomposition, one can derive all information that depends on the brightness distribution of an object in the much smaller shapelet space instead of the real space, thus saving memory and computation time. The equation relating the shapelet coefficients to the flux (or other quantities such as the centroid position) is given by Refregier (2003),
| (5) |
Appropriate relations for the quadrupole moments have been published by Bergé (2005),
| (6) |
from which we can derive a complex ellipticity measure following (Bartelmann & Schneider 2001),
| (7) |
See (Refregier 2003) for further details about the shapelet method.
Optimized decomposition procedure
Equation (1) shows that a shapelet decomposition depends on four external parameters: the scale size , the maximum shapelet order and the two components of the centroid position . The essential task for achieving a faithful shapelet decomposition is finding optimal values for these parameters, such that the residual between the original image and its reconstruction from shapelet coefficients is minimized.
Massey & Refregier (2005) defined a goodness-of-fit function
| (8) |
where is a pixel vector of the residual between the actual image brightness and its reconstruction by a shapelet model , and is the covariance matrix of the pixels. In the case of Gaussian noise with standard deviation , .
The number of coefficients is related to via Eq. (1):
| (9) |
is normalized to the number of degrees of freedom and is equal to unity when the residual reaches the noise level. In this case, the decomposition procedure was able to extract all significant physical information present in the image.
Since Eq. (8) is linear in the unknown shapelet coefficients , we can solve analytically for their values when is minimal (e.g. Frieden 1983),
| (10) |
where the matrix gives the value of the th shapelet basis function sampled at pixel , and is a pixelized version of the brightness distribution .
Thus, optimizing the decomposition means finding the set of parameters for which becomes unity. One has to consider, though, that is a discrete parameter, which forbids using minimization algorithms for continuous parameters, but in turn restricts the parameter space severely. In addition, one must investigate whether the parameter set can be determined uniquely.
Massey & Refregier (2005) suggested the following procedure: Starting with , the value of is searched where
| (11) |
using a one-dimensional simplex minimizer111See for example Press et al. (2002) for a description of the method.. From the shapelet coefficients, the deviation of the shapelet model from the given is computed, which is then subtracted from such that this deviation disappears. Then, with constant , is increased until becomes unity or flattens (i.e. changes less with than the uncertainty in ). At this new , an optimal value for is searched with the simplex minimizer, again readjusting after each iteration. is then reset to 2 and increased again, using the already optimized values of and , to possibly find a point in the parameter space with lower . If this succeeds, is optimized further. The procedure terminates if either or converges.
3 Potential shapelet problems
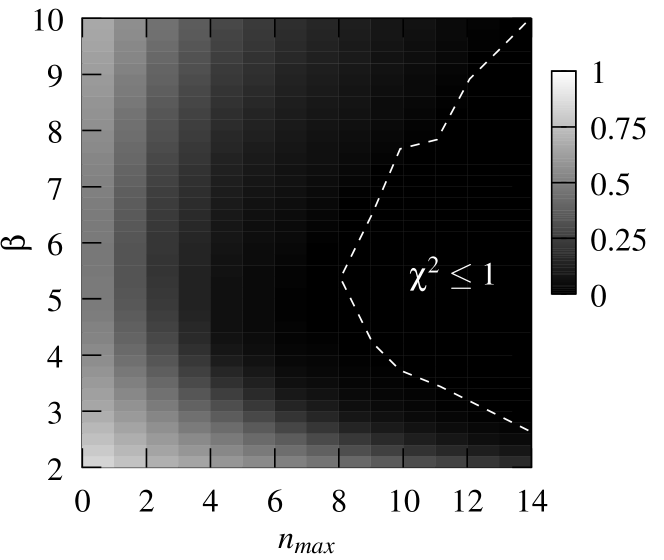
as defined in Eq. (8) is a slowly varying continuous function for the majority of images (see Fig. 4). This allows an easy and fast decomposition of objects, yielding reconstructions that look visually good and have low . The question arises if the decomposition is in all cases able to extract the physical information correctly. We show two classes of potential problems, where physical properties of the decomposed objects are indeed incorrectly measured. One class is related to the violation of the orthonormality condition of the shapelet basis functions, the other one regards misestimation of the shapelet parameters.
3.1 Orthonormality
The matrix is the covariance matrix of the expansion coefficients, which in case of a complete orthonormal basis set is equal to the identity matrix. As pointed out by Berry et al. (2004), the covariance matrix can well differ from the identity matrix and can lose the diagonal form or even its full rank. This happens just because a set of discrete basis vectors – derived from a continuous complete orthonormal basis set by sampling the continuous functions at points of a (regular) grid – can lose orthonormality, orthogonality or even completeness depending on the definition of the grid. Loss of orthogonality introduces covariances among the expansion coefficients; losing completeness eliminates the possibility of inverting the covariance matrix in Eq. (10), so that the approach is not applicable anymore.
Adopting the methodology of Berry et al. (2004), we explore the domains of non-orthonormality by inspecting the diagonal and non-diagonal entries of the covariance matrix.
3.1.1 Undersampling
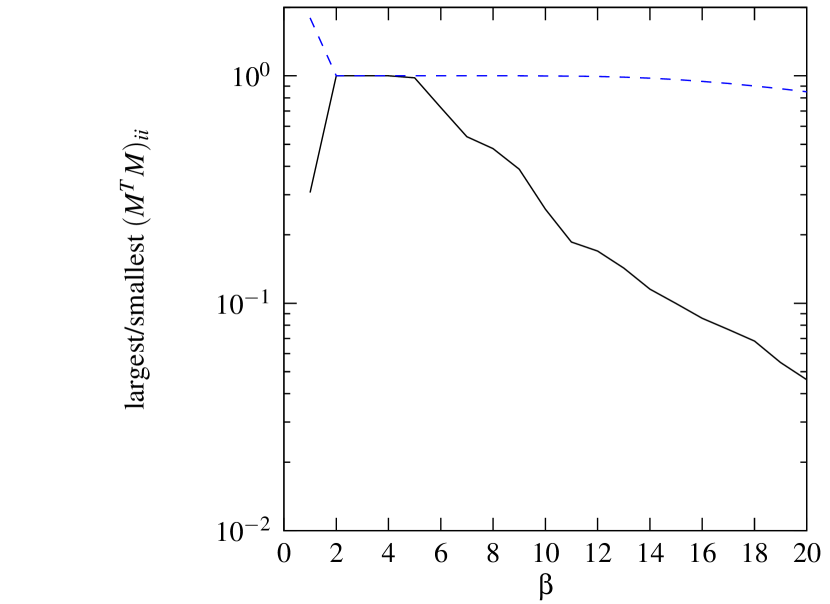
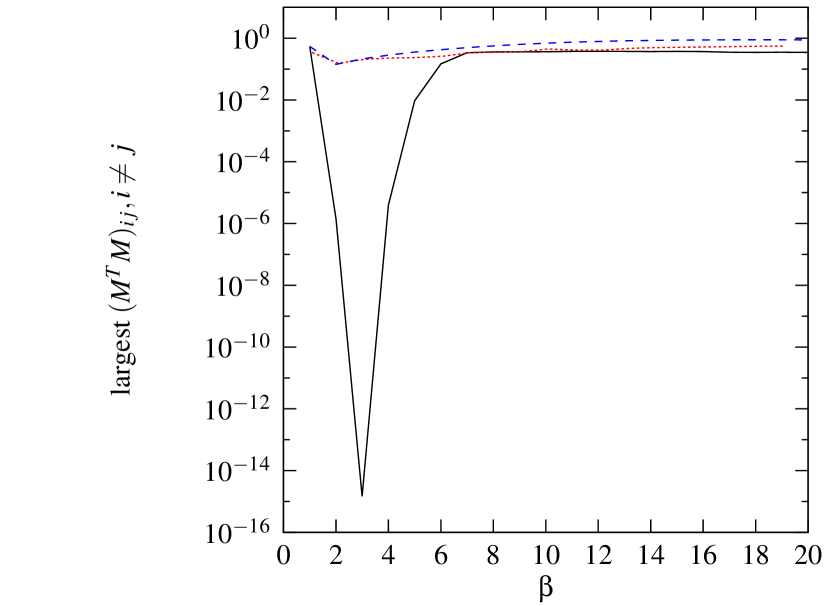
In Fig. 1, the largest and the smallest diagonal elements of the covariance matrix diverge at because the cell-size of the grid (1 pixel) is too large to represent the variations of the continuous shapelet basis function with and . As can be seen in Fig. 2, the basis set also loses orthogonality in that domain, since the largest non-diagonal element of the covariance matrix is of the same order as the diagonal elements.
To make things worse, undersampling is essentially equivalent to random sampling (Berry et al. 2004). Since oscillations of the basis functions appear on smaller scales than the grid spacing, small shifts of the grid points can lead to arbitrary differences in the function values.
Massey & Refregier (2005) suggested a way of dealing with undersampling: instead of using vectors sampled at certain grid points, the value from integrating the basis functions within each pixel should be used. But this approach also leads to non-orthogonal basis vectors, independent of the scale size (see dotted curve in Fig. 2).
3.1.2 Boundary effects
Another problem arises when the scale size is too large for the shapelet basis functions to be contained inside the image. Since the shapelets need infinite support for their orthonormality, power will be lost due to truncation at the image boundaries, as shown by the lower curve in Fig. 1 at high . Again, also the orthogonality is violated in this domain (see. Fig. 2).
3.1.3 Non-orthogonal elements
Massey & Refregier (2005) mention the possibility of fitting the sky background brightness by adding a constant function to the set of the shapelet basis functions. As can be seen from the dashed curve in Fig. 2, this again violates orthogonality globally. This means, it introduces covariances between the coefficients even in such domains of where the shapelet basis functions themselves remain orthogonal.
3.2 External parameters
As mentioned in sect. 2, the set of external shapelet parameters will not be uniquely defined (see the degeneracy region with in Fig. 4). We need to specify which set should be chosen. This choice will affect the shapelet coefficients and the quantities derived from them. Quantifying the impact of parameter misestimation on the results of the shapelet decomposition is the aim of this section.
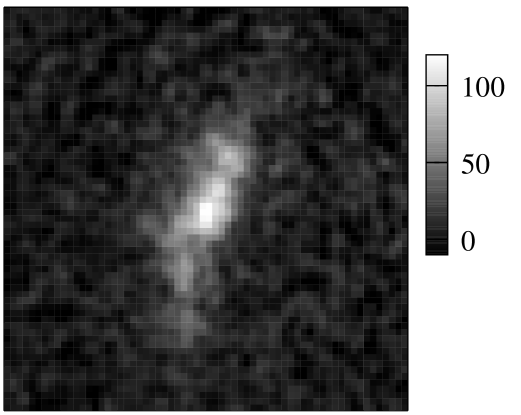
For this purpose, a visually selected galaxy from the GOODS CDF South (Fig. 3) was decomposed until was compatible with unity (with minimal ). Then, starting from the optimal values ( fixed from the image; cf. Fig. 4), the decomposition was repeated with varied external parameters. For each decomposition, the flux and the ellipticity (defined by Eq. (7)) were derived from the shapelet coefficients together with the of the fit.
3.2.1 Variation of
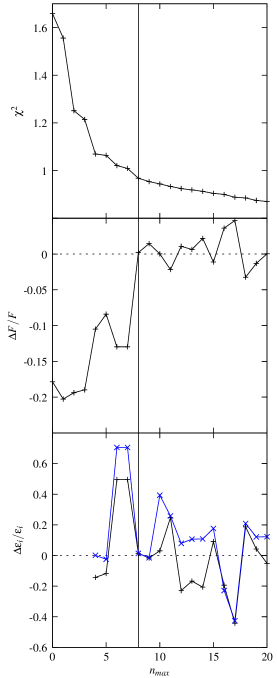
The maximum order was varied between 0 and 20. In each case, the centroid was fixed, and was chosen to minimize at the given according to Eq. (11). As expected, the fit improves with increasing (top panel of Fig. 5).
As can be seen in the middle panel of Fig. 5, the flux will be underestimated for low due to the lack of substructures represented in the reconstruction. On the other hand, the reconstruction tends to pick up smaller noise features farther away from the center when exceeds the preferred value . Thus the flux and especially the ellipticity (bottom panel of Fig. 5) become noisy at high . The correlation of the two components of the ellipticity originates from the orientation of the galaxy along the top-right to bottom-left direction.
Obviously, setting the maximum order to an arbitrary value will cause a misestimation of the coefficients and the derived quantities if the selected was too low to represent the entire object or too high to remain unbiased by surrounding noise.
3.2.2 Variation of
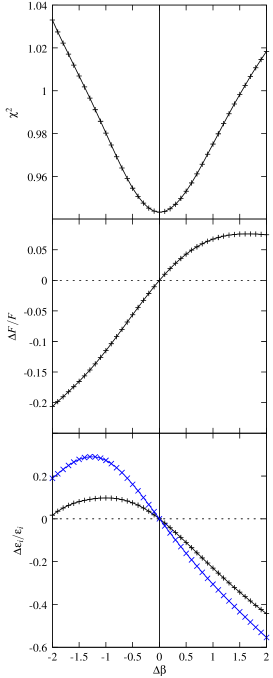
In order to see how the accuracy of the minimizer (for finding the optimal ) or an arbitrary choice of the scale size influences the coefficients, the scale size was varied within , corresponding to a change of 40%. The other parameters were kept fixed.
From the top panel of Fig. 6, one can conclude that is not strongly affected by a change in : The largest values are . The shapelet decomposition is obviously able to cope with a mispredicted scale size and yet provides visually good-looking reconstructions. Minimizing w.r.t. is fortunately simple due to the lack of local minima and the smoothness of the curve, but crucial because of the non-trivial dependence of the other quantities on .
The misestimation of the flux (middle panel of Fig. 6) for is easily understood: Since the central peak is most significant, the peak height is essentially fixed for each reconstruction. If , the reconstruction peaks sharply, falls off too fast and misses the outer parts of the object, thus the flux is underestimated. If , the central peak becomes broader and the outer regions of the reconstructions are too bright, thus the flux is overestimated.
The variation of the ellipticity estimator (bottom panel of Fig. 6) is also problematic. Since increasing at constant increases (cf. Eq. (4)), we see a similar behavior as before in the bottom panel of Fig. 5, where was increased: Due to the intrinsic orientation of the galaxy, both components of the ellipticity are correlated. With , the model is more compact and the ellipticity is dominated by the galactic core which has excess flux top-right of the center. With , the outer parts become more important; because of excess flux far below the center the flip sign but remain correlated.
3.2.3 Variation of
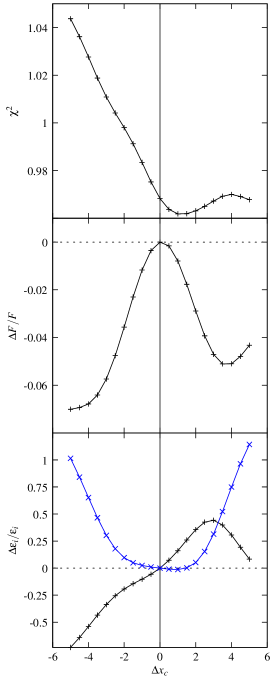
In order to clarify if the determination of the centroid can safely be done during the iterations of the optimized decomposition without biasing the outcome, both components were varied by 5 pixels, thus moving the centroid along a straight line from to . The other parameters were kept fixed.
As the top panel of Fig. 7 shows, the goodness-of-fit is not affected very much; largest values are . Interestingly, the minimum is not at the optimal value (determined by calculating the centroid in real space), but rather shifted by roughly one pixel towards the top right corner of the image. This indicates that the optimized decomposition procedure (suggested by Massey & Refregier (2005) and outlined in sect. 2) tends to converge to a slightly different centroid. In this case, the fit improves (lower ), but it no longer represents the imaged object because the centroid is readjusted under the assumption that the object (without noise) can be perfectly represented by the employed shapelet model. This assumption is not satisfied in general.
The underestimation of the flux is 8% (middle panel of Fig. 7). If the center is misaligned, the flux is underestimated due the loss of regions in the reconstruction far away from the new center. The rise of at high indicates a positive flux region on the top-right side of the galaxy, which can be confirmed by inspecting Fig. 3.
The ellipticity estimator is highly problematic and rather unpredictable (bottom panel of Fig. 7), because its deviation depends on the orientation of the object w.r.t. the image borders.
4 Solutions
In this section, we show that none of the problems mentioned above is fundamental. They can all be remedied by introducing additional constraints or image preprocessing. The general idea is that a more careful way of dealing with the shapelet decomposition, knowing its subtleties, will yield more reliable results.
The first three solutions tackle problems related to the non-orthogonality of the basis functions, the last three show how optimal shapelet parameters can be found and how a realistic error estimate for the shapelet coefficients can be performed.
4.1 Singular Value Decomposition
Berry et al. (2004) suggested to use a Singular Value Decomposition (SVD) of the matrix to derive the shapelet coefficients:
| (12) |
where, if is an matrix, and are orthogonal matrices with the dimensions and , respectively. is an matrix whose diagonal elements are the non-negative singular values; all other entries are zero. contains only the inverses of the non-zero diagonal elements of .
This approach accounts for the non-orthogonality of the basis set, caused by e.g. severe truncation at the image boundary or inclusion of a non-orthogonal element. The drawback of the SVD approach is its memory consumption: Since is a matrix with dimensions , the matrix has the dimensions . For typically sized images this amounts to matrices sized of the order of 100 MB, rendering the implementation inacceptably slow for most purposes.
4.2 Noise subtraction & image segmentation
Most images in astronomy and other fields are contaminated by noise. If the noise has zero mean, the shapelet decomposition can readily be used. If not, the additional noise background should be subtracted before the decomposition instead of being fit by a constant function. SExtractor or similar software can be used to estimate the statistical noise measures for the image (they will be needed for calculating anyway) and subtract the noise mean from the image brightness.
Since potentially more than one object is contained in the image, the overall image has to be segmented in a next step such that each frame contains only one object. SExtractor or equivalents accomplish this by grouping pixels above certain brightness thresholds. If other objects overlap with this frame, they have to be masked with noise whose features were determined in the previous step. Otherwise the locality condition for the shapelet decomposition – meaning that the decomposed object is centered at and has a limited extent – will be violated and the physical information obtained from this ’combined’ object will be corrupted by the appearance of the other objects.
Note that no noise-removal step has to (and should) be done by arbitrarily discriminating between the object of interest and the surrounding noise. The great benefit of the shapelet technique is that the optimized decomposition itself will provide this discrimination better than any simple object-finding algorithm, since it reproduces the actual shape of the object instead of e.g. convolving the image with predefined kernels. In fact, procedures similar to the shapelet decomposition (e.g. wavelet decomposition) have been proposed to tackle this problem in a more quantitative way (Bertin 2005).
4.3 Geometrical constraints
Although the method for finding the shapelet coefficients (Eq. (10)) works also in the case of a non-orthogonal set of basis vectors (then introducing covariances among the coefficients), the cleanest way of dealing with the problems of undersampling and boundary truncation is to avoid them.
Very faint and small objects that are decomposed with very low and must be rejected. Fortunately, these objects carry little physical information.
The decomposition of objects with high must use large . Since the oscillations of the basis functions can then appear on sub-pixel scales, their sampling becomes essentially random. As Massey & Refregier (2005) suggested, one can get rid of this by applying the additional constraint
| (13) |
meaning that the oscillation ’wavelength’ should be larger than the grid spacings (1 pixel). If is unrestricted, this effectively limits via Eq. (4).
The opposite case of becoming large compared to the image dimensions can easily be prevented by placing the object inside a frame that is large enough. This can simply be done during the image segmentation step. The additional border size should be proportional to the object’s extent, have a lower bound of the order of 10 pixels and be made such that the frame becomes square, since the extent of the shapelets is identical along both dimensions. If the object is close to the image boundary such that the frame border cannot be created from the image pixels alone, the missing pixels should be set according to the local noise characteristics. The inclusion of the additional frame border also helps to remedy the degree-of-freedom singularity: The form of Eq. (8) demands the additional constraint
| (14) |
which again limits via Eq. (9).
4.4 Centroid independence
As shown in sect. 3.2.3, leaving as a free parameter of the decomposition can lead to deviations of the preferred shapelet centroid from the centroid of the object. Since the reconstruction should represent the object as closely as possible, the centroid should be fixed to the value calculated from the object in real (pixel) space, instead of the one derived from shapelet coefficients, which will only yield an approximation of the centroid under the assumption that the true galaxy morphology is correctly represented by the employed shapelet model. In general this assumption does not hold, e.g. galaxy profiles often have steeper cusps than the best fit shapelet model.
Apart from the fact that fixing the centroid does not assume a particular galaxy model, it eases the minimization of w.r.t. because any recentering induces distortions the simplex algorithm has to compensate in order to converge.
4.5 Convergence of the optimizer
As described in sect. 3.2.1, the minimization should not be stopped before it reaches a residual at noise level
| (15) |
with being as small as possible (for the sake of uniqueness of the parameter set).
This can be easily realized by not applying any limit on . Unfortunately, the two constraints (Eqs. (13) & (14)) impose such a limit in special cases, leaving . The reconstruction can well be visually good, but not all physical information can be extracted or trusted. These objects should therefore be classified as ’silver’, in contrast to the ’golden’ ones which obey Eq. (15). For a follow-up analysis, one could then decide whether the ’silver’ sample should be used or the selection should be restricted to the ’gold’ sample.
Equation (15) also states that has to be minimal. It is thus insufficient to find a point in parameter space with , but one has to ensure that this parameter set is also the one with the lowest possible . In practice this requires additional iterations at lower . Condition (15) thus also prefers Eq. (11) to be fulfilled, but this has to be ensured separately.
A flattening condition for limiting when does not improve significantly should not be used because it would lead to an incomplete optimization when is not strictly monotonically decreasing with , e.g. due to a faint satellite at the object’s boundary.
4.6 Extended error estimation
So far, the only source of errors mentioned to give rise to coefficient errors was the pixel noise (via in Eq. (10)). If the basis set remains orthogonal, there will be no additional uncertainty coming from the method.
Additional – fortunately independent – errors are introduced by the lack of knowledge on the optimal parameter set. If the centroid position is fixed, one can assume its error to vanish (which is not exactly true, see sect. 5.3). The same is true for the error of when the minimizer converged, obeying condition (15). The simplex minimizer for finding (fulfilling Eq. (11)) stops when it has localized within a previously defined interval. Therefore, will only be known up to an uncertainty that should, of course, be very small, maybe on the order of 1%. Additional uncertainty in is introduced by pixel noise and pixelization, so that we expect the actual to be somewhat larger.
The question then arises how can be translated into an uncertainty in the shapelet coefficients. The answer to this question can be obtained by using the rescaling operation, given in appendix A of (Refregier 2003), which describes the change of the shapelet coefficients due to a change of the scale size. Assuming will for sure be within a 10% interval (this assumption will be justified in sect. 5.3), one could identify the change of each individual coefficient by corresponding rescaling with a 3- error. In contrast to the error introduced by uncorrelated pixel noise, the uncertainty in will in general affect coefficients differently. As we will also show in sect. 5.3, this error will be the dominant contribution to the coefficient error.
5 Implementation comparison
All of the above mentioned weaknesses may become important, but it is
not a priori clear in which cases they may play
a decisive role. We thus proceed from a description of the
problems to a comparison of the decomposition results of the
publicly available shapelet
implementation222http://www.astro.caltech.edu/~rjm/shapelets/.
We used the most recent stable version 2.1., written in the
interpreted programming language IDL, and our independent
implementation in C++.
We also compare errors made during the decomposition and
the performance of the two codes.
5.1 Design choices
The publicly available implementation of the shapelet technique, which has already been used for a considerable number of studies (see sect. 1), is written in IDL, which implies several drawbacks: it is not efficient in dealing with large numerical problems, and licenses are quite expensive. Thus, we decided to reimplement the shapelet decomposition independently, in C++ using Open Source Software only. Since C++ is not full-featured for numerical computations – in contrast to IDL – our implementation links with very powerful external libraries: GNU Scientific Library333http://www.gnu.org/software/gsl/, ATLAS444http://math-atlas.sourceforge.net, LAPACK555http://www.netlib.org/lapack/ and Boost666http://www.boost.org. The dependence on external libraries has the minor disadvantage that they have to be compiled and installed before our code can run, but takes full advantage of the development and improvement effort spent on these libraries. Using C++ and the numerical libraries, our code is roughly one order of magnitude faster than the IDL implementation (see sect. 5.4 for the performance comparison).
Furthermore, we decided to define our implementation as a C++ library, such that other codes that need the shapelet method can easily link with it. This approach is not possible with IDL because IDL scripts are interpreted and therefore not executables in their own right.
In particular, our implementation performs the following steps to decompose images, employing the solutions pointed out in sect. 4. For the task of estimating the noise characteristics and segmenting the image into frames, SExtractor is the standard choice in astronomy. Unfortunately, it is not available as library, only as standalone executable. Since we did not want our library to use system calls, we decided to implement algorithms similar to those in SExtractor in our library. Thus, the whole image preprocessing (noise estimation and subtraction, image segmentation and removal of overlapping objects) is done internally in our code, before the object’s frame is passed to the shapelet decomposition. Also, the centroid of the object is directly computed from the cleaned frame.
For the determination of the shapelet coefficients, we use the method (see sect. 2); the SVD method is also implemented, but not used as default. We optimize the parameters and , which have to fulfill the constraints given by Eqs. (11) and (13) – (15). We pay particular attention to find the lowest possible . remains fixed at the value derived from the cleaned frame. After the convergence of the minimizer, the errors on the shapelet coefficients are computed from the pixel noise and the uncertainty in (see sect. 4.6). If the decomposition violates condition (15), the object is classified as ’silver’ so that it can be excluded from the further analysis. A flattening condition is not employed.
5.2 Decomposition results
We now investigate the first decomposition results from 1,000 simulated images with underlying shapelet models, and then the results derived from the decomposition of 2,660 galaxies from the GOODS survey.
In both cases, in order to guarantee the comparability of the implementations, the images were cut to contain the object of interest in a square frame, large enough not to run into the problem of boundary truncation – the IDL code was modified such that it does not further cut the frame. The noise characteristics were estimated using our noise algorithm and then passed to both shapelet codes. We can thus focus on the optimization procedure employed by the different codes.
5.2.1 Simulated images
Kelly & McKay (2004) identified the ten most powerful (i.e. largest on average) shapelet coefficients of galaxy images from SDSS. Using these coefficients and their variances, we defined a multivariate Gaussian probability distribution. To create more individual galaxy shapes, we included minor coefficients, whose variance was chosen to be smaller than of the major ones; their mean was set to zero. Sampling from this probability distribution, we generated 1,000 flux-normalized galaxy images with and . To each of these shapelet models, we applied a moderate level of Gaussian noise with zero mean and constant standard deviation of .
We then decomposed these images into shapelets using the IDL code and our C++ implementation with and . These restrictions are quite loose, but helpful to constrain the parameter space for this comparison.
Generally speaking, both implementations are able to decompose the given images with a near unity as required (see Fig. 8). The IDL version typically needs higher orders to achieve the same goodness-of-fit: The mean for C++ is 9.79, but 11.97 for IDL (see Fig. 9). Both implementations tend to higher than the underlying shapelet model because noise can obscure the smallest features of the model most effectively, requiring higher additional shapelet modes to correct for that.
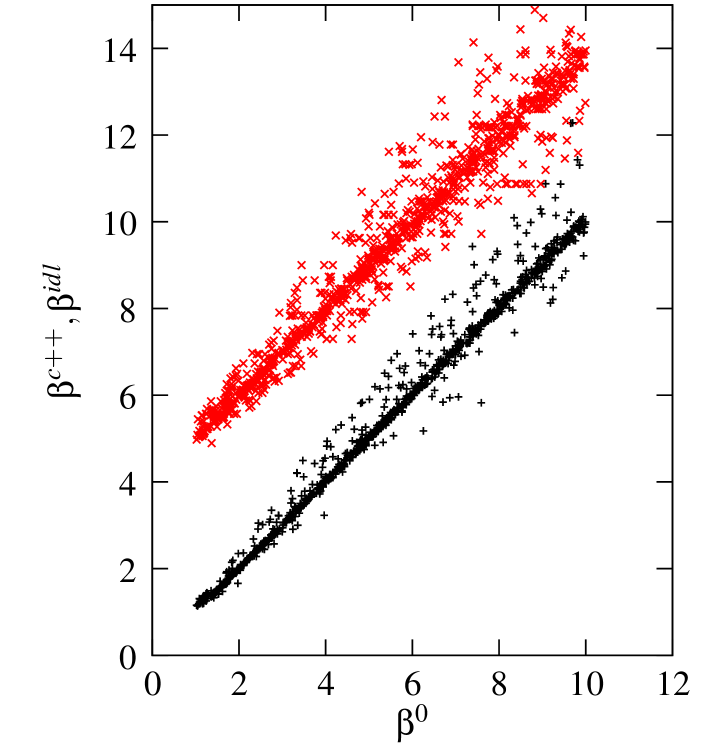
The other optimized shapelet parameter is the scale size . In Fig. 10, the scale size of the decomposition results is compared to the one of the underlying shapelet model. For both implementations one can clearly see a correlation, with significantly larger scatter in the IDL case. Interestingly, the images for which the IDL decomposition misestimates the scale size considerably form the group of images with , the maximum allowed order. This shows that a misprediction of the scale size is compensated by using higher shapelet orders.
To quantify the overall quality of the decomposition, we computed the mean and the Pearson correlation coefficient for several quantities of the model with the decomposition output (see Table 1). It becomes obvious from these numbers that the decomposition results are more reliable in the C++ than in the IDL implementation, regarding both the value of the external shapelet parameters and the quantities derived from the shapelet coefficients.


5.2.2 GOODS images


We selected 2,660 galaxies from GOODS subject to the constraint that the object frame does not contain more than 10,000 pixels. The reason for this selection is twofold: The speed of the code scales at least linearly with the number of pixels, so we wanted to keep the procedure reasonably fast, and the typical objects for shapelet decomposition (e.g. in weak lensing studies) are faint and rather small.
The noise mean and variance were estimated using our noise algorithm. The noise mean was subtracted from the images before decomposition; the noise variance was passed to the shapelet codes.
As can be seen from Fig. 11, both implementations are able to achieve a reconstruction with . There is a clear cutoff at for the C++ code that is less prominent for the IDL code. This could be due to the use of a flattening condition during the optimization procedure in the IDL code, which allows higher if the residuals do not reduce significantly when increasing .
The comparison of the maximal orders shows a clear correlation which has to be expected from the two implementations, since it shows that both use low order for small and faint objects and higher order for brighter and bigger objects (see Fig. 12). Again, with IDL there is a larger fraction of objects at the limit, but the trend is not as clear as with the simulated images.
The most surprising comparison is the one of the final scale sizes (see Fig. 13). We can see the expected spread, but there is an alignment of data points along constant . For some reason, the IDL optimization procedure prefers some values of , although this is a free and continuous parameter. This effect could explain the generally larger scatter of for the simulated images, too. As we have discussed in sect. 3.2, the result of such an inconsistency will affect the whole optimization outcome and therefore the quality and reliability of any follow-up analysis based on shapelet coefficients.
5.3 Decomposition errors
With the simulated galaxy images and the decomposition results of the two codes at hand (cf. section 5.2.1), we can investigate which effect gives rise to what kind of error.
It seems reasonable to assume that the uncertainty in the shapelet parameters percolates through the decomposition process and creates the scatter in the quantities derived from shapelet coefficients. But the misestimation of the shapelet parameters can also create systematic biases: Figs. 6 & 7 clearly show that it is quite likely to underestimate the flux if is underestimated or the centroid is shifted away from its optimal value; exactly this behavior is conspicuous in the IDL results.
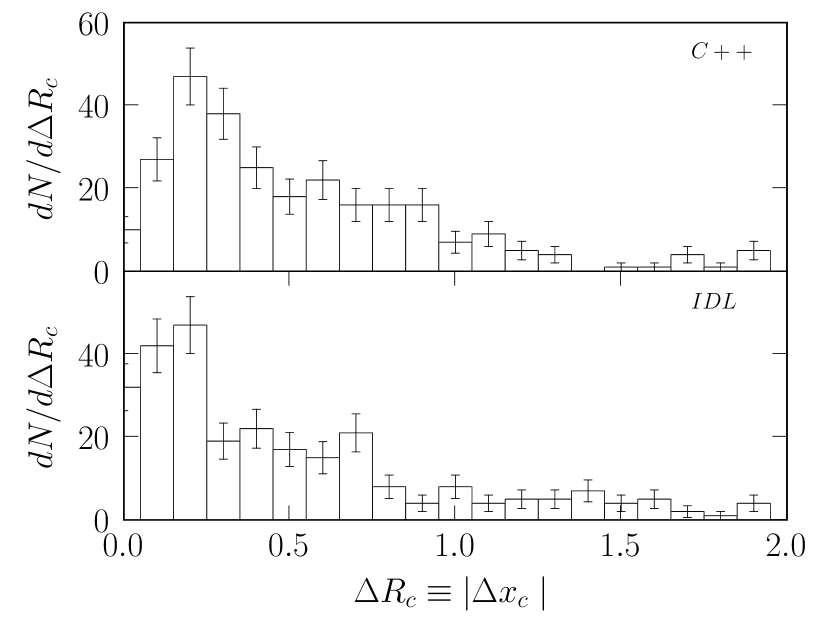
When we compare the distribution of centroid determination errors (see Fig. 14 and last line of Table 1), we can clearly see that both codes are affected by a mean uncertainty of pixels, which is compatible with the expected impact of pixelization. It shows that the procedure of fixing the centroid from the pixel data (as suggested in sect. 4.4) produces errors which are not significantly larger than when the centroid is an optimized parameter, even when the galaxy model is a shapelet model.
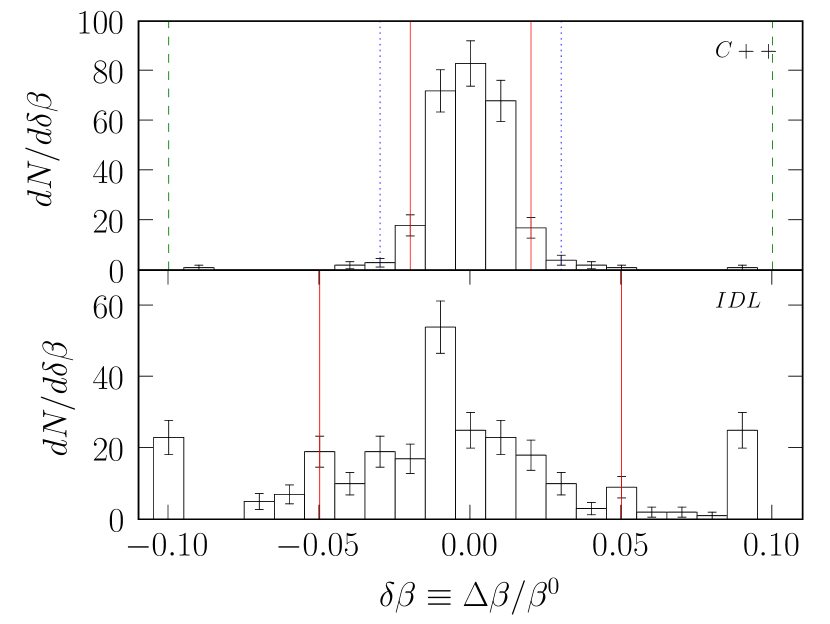
Thus, the underestimation of in the IDL results must have different reasons. The distribution of the relative error in Fig. 15 shows again the larger scatter for but also reveals its slight underestimation, e.g. the maximum bin is at , which could give rise to an underestimated .
The distribution of in the C++ results has roughly a Gaussian shape in the center but broad wings at both sides. When we set the intervals such that they correspond to 68%, 95% and 99% confidence limits, we obtain and . is the value we employed for the estimation of in sect. 4.6.
Since we know the coefficients of the underlying shapelet model , we can quantify the error of the obtained shapelet coefficients in shapelet space by the simple Euclidean metric
| (16) |
where we regard any uncertainty in the external parameters as error of the coefficients. Two important conclusions can be drawn from the corresponding numbers listed in Table 1: The goodness-of-fit in real space does not tell much about the goodness-of-fit in shapelet space (as all galaxies considered have ); and the dominant source of coefficient error is not the pixel noise, otherwise the mean distance should be close to the noise rms times the number of coefficients, . The realistic error estimate (which takes the additional uncertainty in into account, cf. sect. 4.6) can reproduce such values of .
| Model | C++ | IDL | |
|---|---|---|---|
| 8 | 9.791 | 11.969 | |
| 1 | 0.984 | 0.949 | |
| 8.478 | 8.478 | 8.406 | |
| 1 | 0.999 | 0.811 | |
| 1 | 0.999 | 0.894 | |
| 1 | 0.999 | 0.976 | |
| 1 | 0.989 | 0.771 | |
| 0 | 0.025 | 0.040 | |
| 0 | 0.580 | 0.549 |
5.4 Performance
We ran the code on different machines. Our C++ implementation ran on an ordinary desktop machine (Intel Pentium 4, 3 GHz), whereas the IDL implementation ran on a more powerful machine (Intel Xeon™, 2.8 GHz). To see how the platform impacts the runtime, we performed the easy-to-use BYTEmark benchmark777http://www.byte.com/bmark/bmark.htm – a collection of realistic integer, floating point and memory problems – which indicates that the Xeon™ machine has an performance gain of factor 1.15 for floating point operations; memory access and integer operations are equivalent on both machines.
After calibrating the strength of the different machines, it was interesting to see what performance benefit could be gained by the use of C++ (see Table 2).
Although our code tests more strictly whether the set of shapelet parameters used for the decomposition actually obeys Eq. (15) and thus needs more iterations, it outperforms the IDL code significantly, showing speedup factors between 5 and 14. Most of the performance gain is probably due to the fact that, in terms of computation time, IDL is not well suited for moderate to large numerical problems.
| Job | C++ | IDL | IDL (normalized) |
|---|---|---|---|
| Simulated images | 112 min | 528 min | 607 min |
| GOODS images | 55 min | 664 min | 764 min |
6 Conclusions
The shapelet technique provides a very powerful tool to describe intrinsically smooth, compact objects. It incorporates the effects of noise such that it is able to extract all significant physical information from the object. Quantities like the flux or the ellipticity can then be computed efficiently in the much reduced shapelet space.
However, the trust in the estimators of the physical properties relies on the assumption that there is a single decomposition result. Since the shapelet decomposition depends on four external parameters (the scale size , the maximum decomposition order and the components of the centroid ), it is inevitable to choose appropriate parameters. Unfortunately, it is not sufficient for finding a reliable parameter set that the reconstruction has residuals at noise level, i.e. . In fact, increasing makes it more and more likely to find a continuous and growing range of parameters obeying . This degeneracy has to be broken by ensuring that both conditions (11) and (15) are fulfilled. If this is not the case, deviations of the shapelet parameters from the optimal values will introduce arbitrary errors on the shapelet coefficients and therefore on all quantities derived from them, even though .
In addition, the sampled shapelet basis vectors have to remain orthonormal to guarantee the correctness of the decomposition results. The orthonormality can be violated by undersampling, boundary truncation and introduction of non-orthogonal elements. There is no way to avoid undersampling, but the use of suitably large frames and the subtraction of noise before the decomposition can remedy the other reasons for non-orthonormality.
We showed that the proposed solutions do indeed result in a faithful representation of the decomposed objects, not only at the visual level but also concerning their physical properties. By comparing the results of our C++ implementation with the publicly available IDL code, we found that our code is both more reliable and has considerable performance benefits.
Acknowledgments
The authors thank Catherine Heymans, Sergey E. Koposov and Marco Barden, the GOODS and COMBO-17 team for providing the GOODS galaxy images used for the presented work.
References
- Bartelmann & Schneider (2001) Bartelmann, M. & Schneider, P. 2001, Phys. Rep, 340, 291
- Bergé (2005) Bergé, J. 2005, An introduction to shapelets based weak lensing image processing, 1st edn.
- Berry et al. (2004) Berry, R. H., Hobson, M. P., & Withington, S. 2004, MNRAS, 354, 199
- Bertin (2005) Bertin, E. 2005, SExtractor User’s manual, version 2.4 edn.
- Chang et al. (2004) Chang, T.-C., Refregier, A., & Helfand, D. J. 2004, ApJ, 617, 794
- Frieden (1983) Frieden, B. R. 1983, Probability, Statistical Optics, and Data Testing (Springer, Berlin)
- Goldberg & Bacon (2005) Goldberg, D. M. & Bacon, D. J. 2005, ApJ, 619, 741
- Heymans et al. (2006) Heymans, C., Van Waerbeke, L., Bacon, D., et al. 2006, MNRAS, 368, 1323
- Kelly & McKay (2004) Kelly, B. C. & McKay, T. A. 2004, AJ, 127, 625
- Kuijken (2005) Kuijken, K. 2005, arXiv:astro-ph/0601011
- Massey et al. (2006) Massey, R., Heymans, C., Berge, J., et al. 2006, arXiv:astro-ph/0608643
- Massey & Refregier (2005) Massey, R. & Refregier, A. 2005, MNRAS, 363, 197
- Massey et al. (2005) Massey, R., Refregier, A., Bacon, D. J., Ellis, R., & Brown, M. L. 2005, MNRAS, 359, 1277
- Press et al. (2002) Press, W. H., Teukolsky, S. A., Vetterling, W. T., & Flanner, B. P. 2002, Numerical Recipes in C++, 2nd edn. (Cambridge University Press)
- Refregier (2003) Refregier, A. 2003, MNRAS, 338, 35
- Refregier & Bacon (2003) Refregier, A. & Bacon, D. 2003, MNRAS, 338, 48
- Weissman et al. (2004) Weissman, J., Hancewicz, T., & Kaplan, P. 2004, Optics Express, 12, 5760
- Young et al. (2005) Young, C., Gallagher, P. T., Ireland, J., & McAteer, R. 2005, AGU Spring Meeting Abstracts, A7+