Submillimetre emission from Carinae
Abstract
We present critical, long-wavelength observations of Carinae in the submillimetre using SCUBA on the JCMT at 850 and 450 m to confirm the presence of a large mass of warm dust around the central star. We fit a two-component blackbody to the IR-submm spectral energy distribution (SED) and estimate between of dust exists in the nebula depending on the dust absorption properties and the extent of contamination from free-free emission at the SCUBA wavelengths. These results provide further evidence that Carinae’s circumstellar nebula contains of gas, although this may have been ejected on a longer timescale than previously thought.
keywords:
circumstellar matter–stars: individual: Carinae–submillimetre1 Introduction
Carinae is one of the most luminous objects in our Galaxy () and is well known for dramatic outbursts in which material is ejected outwards from the star. Its most famous mass ejection is thought to have occurred in the early 19th Century, where a few solar masses of gas was expelled in a few decades. This feature is clearly seen in observations as a bipolar nebula, known as the Homunculus (Gaviola 1946). The origin of the shape of the Homunculus is unknown, but could occur due to ejection of mass in a non-uniform interstellar medium i.e. if the ambient medium was denser in the equatorial plane, the nebula would preferentially expand along the poles. Surrounding the Homunculus is a larger, less dense nebula, known as the ‘outer ejecta’ (e.g. Weis 2005) which contains numerous filaments and dense condensates not dissimilar to those seen around the young supernova remnant Cassiopeia A (e.g. Smith & Morse 2004, Fesen et al 2001). The central star is hidden from view by this structure but is thought to be a luminous blue variable (LBV) star with mass (Pittard 1999; Smith et al. 2003). LBV stars are well known for large luminosities, violent instabilities and periods of large mass loss. The presence of a binary companion (e.g. Pittard 2003) would provide an explanation for the catastrophic mass ejections and the strong variabilities seen in the radio and X-ray (Cox et al. 1995; Duncan & White 2003). The cycle of periodicity suggests that any exisiting binary would have a highly eccentric orbit, leading to strong wind-wind collisions such as those seen in WR binaries (Marchenko et al. 2002; Pittard 1999). The evolutionary phase of an LBV star can last more than yrs and hence in this phase alone, a single star could lose roughly of gas. Episodic eruptions will increase the mass loss further. It is therefore not unreasonable to assume that the dust mass loss rate could be . For the lifetime of the average LBV phase, we could expect LBV stars to inject of dust into the interstellar medium and could be responsible for the dust emission seen around the young supernova remnants Cas A (Dunne et al. 2003, Wilson & Bartla 2005), Kepler (Morgan et al. 2003), SN1998J (Pozzo et al. 2004), the Crab (Green, Tuffs & Pospescu 2004), SN2002 (Barlow et al. 2005) and more recently SN2003gd (Sugerman et al. 2006).
The structure of Car is revealed in the many multiwavelength observations, yet there are issues surrounding the origin of the Homunculus. IR observations at 12 - 17 m revealed a small structure within the Homunculus which appeared to be concentrated around the ‘waist’ of the nebula (Morris et al. 1999; hereafter M99). They found a small bright core a few arcsecs across which they interpreted as a disk/torus of dust with two components at 200 K and 110 K with of dust. They suggested (with a normal gas-to-dust ratio of 100) that the gas within this small torus could therefore be . This argument is flawed since estimating the 110 K dust mass relied on observations at the longer infrared wavelengths where resolution is limited to greater than 1 arcminute, so the precise location of the 110K dust component cannot be determined from the mid-IR images alone.
Davidson & Smith (2000) also argued against the IR emission in a small torus, proposing instead that this was too small to account for the large luminosities radiated at 100 m. The visual image provides further evidence for this argument since there is no evidence of an opaque dusty disk on such a small scale. Hony et al. (2001) then used high resolution images at 8 - 20 m to suggest that the observed IR dust is not warm dust at 110 K, but actually hot dust at 200 K with a strange overlapping ring structure in the middle of the nebula. They argue that these rings are similar to those seen in SN1987A and are at different polar axes to each other. If this scenario is correct, the total dust mass in Car decreases to due to the strong dependence of dust mass with temperature; the gas mass ejected in the Homonculus would then be and the evolution of Car would not be as violent as currently thought. This claim has been disputed in Smith et al. (2000; 2003) who propose that the strange smooth loop structure seen in the Hony et al. observations are simply due to a disrupted torus. They point to compact knots and hotspots in the IR with filaments and arcs which could be due to a toroidal distribution of dust which has been disrupted by subsequent mass loss. They also use temperature maps from ISO data to show that cooler ‘hidden’ dust may exist in the outer polar lobes of the Homunculus and not in a compact torus.
M99, Davidson & Smith (2000) & Smith et al. (2002) have all argued that there is missing mass which has never been accounted for by the observations, and the cooler dust mass which has been found has not been resolved, so its precise location is unknown. If there is missing ejected mass, this will have important implications for the energy budget and estimated parameters of LBV stars as well as its future evolution. To determine if colder dust could exist further out from the centre of the star, wavelength measurements are needed beyond the mid-IR range (Davidson & Smith 2000) which will dominate the dust mass. We therefore use archived SCUBA observations of Car to investigate the distribution of the dust and the ejected mass in one of the most studied objects in the nearby Universe.
2 Submillimetre Observations
The sub-mm observations of Carinae were originally observed by SCUBA on the JCMT in January 1998 in Grade II weather, simulataneously observing at 450 and 850 m (with nominal beam size of 8 and 14 arcsec respectively). The data was taken from the JCMT archive (originally observed by Henry Matthews, program ID M97bc30) and consisted of a single Jiggle map observation with a 120 arcsec chop throw in Alt-Az and position angle . This was reduced using the standard data reduction pipeline SURF (Sandell et al. 2001) with sky opacities obtained from CSO-FITS and skydips to give relatively stable optical depths of and (see Section 3.1). The remsky option was used with the outer ring of bolometers flagged as sky bolometers (as Car is almost a central point source in the maps) and the option for addback was turned on.
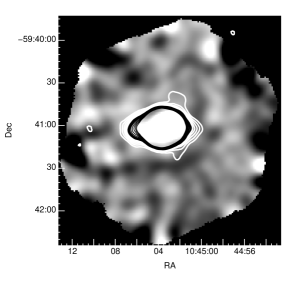
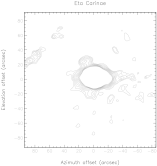
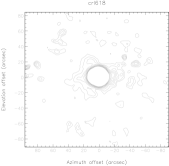
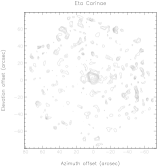
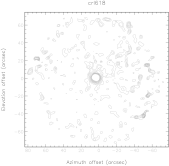
The 450 m SCUBA image of Car is shown in Fig. 1 with 850 m contours overlaid. White contours start at 5- (160 mJy/beam) incrementing by 2- with black contours starting at 10-. The central part is not resolved by the SCUBA field-of-view but we see an interesting feature which appears to be extended in the x direction, along the midplane of the image which is particularly clear at 850 m. It is difficult to determine the significance of this since the source is at such a high airmass. It is well known that larger chop throws can cause ‘smearing’ along the direction of the throw, in this case the x-axis, and the image of Car is similar to example images of this problem111see http://www.jach.hawaii.edu/JCMT/continuum/. Extended emission along the midplane is also seen in the calibrator CRL618 at 850 m (Figs 2 (b) & (d)), suggesting it may be a combination of the chopping method and the beam pattern at high airmass. The extension is not as clear in the 450 m image of the calibrator. Radial profiles of both the beam (taken from the calibrator) and the source show that the extension cannot be separated from the beam pattern.
3 Calibration & Errors
The high airmass of Carinae () at the time of observation produces potential difficulties with calibration which we will address carefully in this section. The calibrator observed on the same night was at a lower airmass of 2.5. Calibration of the data requires two steps, firstly an extinction correction for the absorption of incoming radiation by the atmosphere, and secondly a comparison with a calibrator of known flux to convert instrumental units (V) into Jy.
3.1 Extinction correction:
For the time the data was taken, the JCMT has two methods available to measure the value of the zenith sky opacity () at the wavelengths of interest; skydips and extrapolation from the CSO 1.1 mm . Skydips are taken at the SCUBA wavelengths (450 and 850 m) but are only made infrequently (every two hours or so). The CSO radiometer measures the at 1.1 mm every 10 minutes, and so samples changes in the atmosphere on a much more useful timescale. The JCMT have created relationships between the CSO values and those at 450 and 850 m using an extensive data-base of skydips. They also fit the CSO data for each night with a polynomial which allows interpolation between measurements and reduces the effect of any ‘spikes’ in the CSO measurements. These polynomial fits are the recommended way to extinction-correct SCUBA maps.
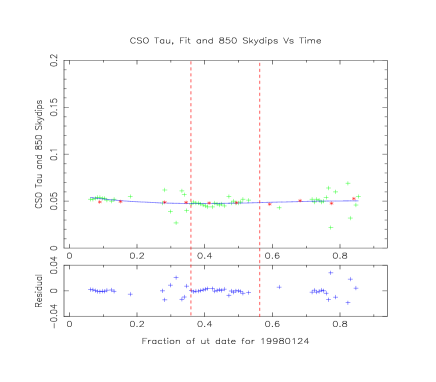
On the night the data were taken, the sky was extremely stable. The plot of the CSO values, the polynomial fit and the residuals is shown in Fig. 3. The part of the night considered to be ‘stable’ after sunset and before sunrise (when the Car data were taken) is shown between the dashed lines.
The value of which is used to correct the flux of the object for atmospheric absorption, is uncertain - and this uncertainty, , leads to an uncertainty on the flux measured. Due to the high airmass of Car, any error in the value is amplified greatly when applied. From Dunne & Eales (2001), we have the fractional error in flux due to the uncertainty in as:
| (1) |
where we have taken to be the r.m.s. of the residuals in Fig. 3, and is the airmass. The value of is 0.00253 and this must be translated to an r.m.s. on the values at 450 and 850 m. For this we use the pre-upgrade revised narrow-band filter relationships between CSO tau and 450/850 m given on the JCMT webpages222http://www.jach.hawaii.edu/JCMT/continuum/calibration/atmos/tau.html, and using propagation of errors we find that (850) = 0.005 and (450) = 0.012.
Using Eqn. 1 we calculate the fractional error on the flux due to uncertainties in the extinction corrections as (850) = 3 per cent and (450) = 6 per cent. If we instead take the extreme values of the residuals rather than the r.m.s. we get increased values of 6 (850) and 15 per cent (450), however, these are not statistically correct, and we include them as merely illustrative of a worst case.
3.2 Changes in the gain:
The second part of the calibration procedure is to compare the signal measured in an aperture on the object with that in the same aperture on a calibrator of known flux. The calibrator used was CRL618, chosen because it was observed shortly before Carinae, and therefore sky conditions and the shape of the dish would be closest to those at the time of the Car observation. A change in the dish shape (due to thermal relaxation after sunset), or a telescope which is poorly focussed will result in changes in beam shape and hence the gain - defined as the ratio of calibrator flux (Jy) / calibrator flux (V). Thus, if the calibrator is observed under as similar conditions as possible to the objects then this effect is minimised.
A check of all of the calibration maps during the night showed that the beam shape was very poor in the earlier part of the evening (after sunset), despite many attempts at focussing. However, for the calibrator map taken prior to Car, alignments were also made on the secondary mirror in the x-y plane which resulted in a much improved beam shape. Thus we believe that the previous poor quality images were due to a poorly aligned mirror and there is no reason to believe that this will affect the source data which was taken just after the re-alignment.
There could be some concern that observing at such low elevations may also affect the shape of the dish and hence the gains, however, the staff at the JCMT have found no evidence for a link between gain and elevation (Iain Coulson, private communication). Furthermore, the beam shapes look similar between the calibrator and Car (Fig. 2), again suggesting that there is not a serious change in images observed at the lower elevations. Any deterioration in dish shape tends to lead to higher gains (more Jy per V) and therefore any elevation effect on the dish would be leading us to underestimate the flux of Car rather than overestimating it (as the calibrator was observed at a lower airmass).
Since the earlier calibration maps had been affected by the mis-alignment of the secondary mirror, and therefore do not reflect usual nightly variations in the gain, we will use the information from Tables 1 & 2 in Dunne & Eales (2001) to estimate the uncertainty on the gain. Here the variation of gain values in various sized apertures was calculated using data taken over the same period as these observations (July 1997 - July 1998). This gives the uncertainty in the gain in a 45 arcsec aperture as per cent at 85 0m and per cent at 450 m.
There will also be an absolute calibration uncertainty due to errors in the flux of the calibrator and the model used to generate the planet fluxes (on which the flux of the secondary calibrators is based). The errors on the flux of CRL618 are quoted as Jy at 850 m and Jy at 450 m. Adding in quadrature an additional 5% error due to the uncertainty in the model, the total error on the calibrator flux is estimated as per cent at 850 m and per cent at 450 m.
The total calibration error is then the quadratic sum of the three terms for extinction, gain and absolute as follows:
| (2) |
giving (850) = 9 per cent and (450) = 13 per cent. While these numbers may look surprisingly low, it must be remembered that this was a night with exceptionally good observing conditions (during the El Nino period), and that the best practise has been used in the calibration procedure.
3.3 The SCUBA Fluxes
The integrated flux was measured by placing the same aperture over both Car and CRL618, measuring the total flux in Volts on both. The fluxes of Car at 850 and 450 m were found to be Jy and Jy respectively as measured in an aperture of diameter .
The radius of the aperture needed to incorporate the entire emission is , which at the distance of Car corresponds to a physical size of 0.3 pc and is just larger than the visual size of the Homunculus. The dust seen in these images may be probing the ‘outer ejecta’ region (e.g. Smith & Morse 2004, Weis 2004). However, we cannot resolve the inner of the Homunculus and we refer the reader to the recent sub-arcsecond study of Car e.g. Chesneau et al (2005).
4 The IR-Radio Spectral Energy Distribution
Due to the high variability in the X-ray, Radio, mm and IR and as the sub-mm observations of Car were taken during a shell-event in 1998, we chose literature fluxes taken nearest this epoch (corresponding to a radio quiet stage). This allows for the best possible direct comparison of the sub-mm with any variability in the radio, as well as determining the evolution of the SED during this time (e.g. Abraham & Damineli 1999; Abraham et al. 2005). Where unavailable, older literature fluxes were used (Cox et al. 1995). The 1992 millimetre fluxes taken from this work are thought to be at a similar level to those expected in 1998 (e.g. Fig 1, White et al. 2004).
We fitted the SED of Car from 10 - 850 m using a modified blackbody (Fig.4) requiring a two temperature component at around 200 and 110 K. The dust emissivity exponent , is , lower than the nominal value of 2 for ‘normal’ interstellar composition but higher than those estimated in M99 and Smith et al (2003). This indicates that the grains could be amorphous, large or non spherical in composition (e.g. Bohren & Huffmann 1983). However, there is likely to be contamination from the radio emission at the sub-mm wavelengths which is dependant on the phase of the radio cycle. There are two sources of radio emission from the star - free free ionised emission from the stellar wind and emission from the optically thin Homunculus region (Cox et al. 1995). Both thermal processes depend on frequency, free-free varies as (Wright & Barlow 1975) and the optically thin region as . The contamination from the radio to the sub-mm emission can be removed by determining the flux expected at 450 and 850 m. The variation of free-free emission in Jy with wavelength from an ionised stellar wind is given in Lamers & Cassinelli (1999). X-ray modeling of colliding wind binaries fit the observations of Car with parameters: mass , , mass loss rate, , terminal velocity and distance 2.6 kpc (Pittard 1999). The SED of the free-free emission assuming these values and a doubly ionised wind is shown in Fig. 4 (dashed line). The power law is significantly below the sub-mm fluxes and also underpredicts the observed 1.2 and 3 mm fluxes. Cox et al. (1995) suggest that the power law slope from the free-free emission is actually in the mm regime due to hydrogen recombination changing the electron and proton densities in the wind (see their Fig 3). The emission then turns over at mm to the normal slope of , just below the observed flux at this wavelength, shown on Fig 4. We use the observed fluxes rather than the theoretical prescription of a stellar wind to estimate the maximum possible contribution from the ionised stellar wind in the sub-mm regime. Thus we would expect a flux of Jy at 850 and 18 Jy at 450 m respectively due to the ionised stellar wind. It is clear from Fig 4 that almost all of the 850 m flux could be free-free emission, yet not all of the 450 m emission can be explained from the expected power law. Indeed, it is difficult to explain the 450 and 850 m flux ratio with a radio emission process. However, given the uncertainty of how much of the sub-mm flux is due to dust emission or contaminated by free-free, we have two scenarios for the dust mass in Car (1) best case: all of the estimated SCUBA flux is due to dust and (2) worst case: 94 and 35 per cent of the 850 and 450 m flux respectively is due to the ionised stellar wind. This effectively gives a lower limit to the range of dust masses expected (see Section 5).

As noted in Smith et al. (2003), the fit to the energy distribution is not unique, a range of values of temperature could achieve a satisfactory fit to the spectrum within the errors on the fluxes. Indeed in their work, they reproduce an adequate fit to the Morris et al. (1999) data with dust temperatures of 140 K and 200 K. However, none of the previous best-fit SEDs produce the correct 450/850 ratio as observed here. The extra fluxes at the long wavelength tail provide another constraint, which forces the fit to have a colder temperature than the previous models at 110 K. It is extremely important to separate the dust emission from free-free at these wavlengths as this affects the dust mass in the nebula. If the wind is optically thin, for example, most of the IR emission would be due to dust and not contaminated by free-free.
5 A Large Mass of Dust?
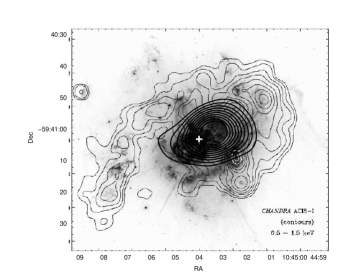
The emission seen in the SCUBA images and the radial profiles suggests that some of the dust may be located outside the Homunculus although due to the beam pattern we cannot determine if this is a real extension. The HST/WFPC2 image is shown in Fig. 5 with the CHANDRA X-ray observations and the submm emission shown as contours starting at S/N 3- (original image from Smith & Morse 2004). The 450 m emission appears to coincide with the X-ray emission which is thought to occur where previous mass loss from the star is colliding with the surrounding interstellar material, causing shock heating of the gas. We may therefore be probing dust shells from a previous mass-loss phase333A rough calculation shows that the dust could not be due to swept up from interstellar gas since the swept up dust mass at this distance would be less than ..
To determine the dust mass in Car, we use
| (3) |
where is the dust mass absorption coefficient ( for normal interstellar dust at ) and D is the distance to the star. The dust mass from the best fit SED to the free-free subtracted fluxes (scenario 2) is depending on the absorption properties of the dust. With an typical gas-to-dust ratio of 100, this suggests that around would have been expelled in the wind. Such a large number may indicate that the gas-to-dust ratio in the atmospheres of massive stars could be higher than predicted (e.g. AG Car - Voors et al. 2000). Alternatively, the dust could be more efficient at emitting than normal ISM dust. Previous modelling of the SED of Car has shown that the dust does not follow an opacity law of (Robinson et al 1987). If we use the absorption coefficient estimated from Dunne et al. (2003) to represent pristine, newly formed dust in stellar winds, we obtain which would require of gas to be expelled. Using the best fit fluxes without the free-free contamination (scenario 1), the dust mass would be . Errors quoted are given using 68 per cent confidence intervals from parameters obtained using the bootstrap technique (whereby 1000 sets of artificial fluxes were created from the original data with each individual set then fitted with our two-temperature model).
This is in good agreement with the original hypothesis of M99 and Smith et al. (2003). The dust mass calculated here appears to be spread out over a larger area than the torus and quite possibly outside the polar lobes of the Homunculus. Combining this result with that in M99 and Smith et al. (2003), we obtain the dust masses for each component as listed in Table 1. Since we cannot resolve the inner Homunculus, the dust mass here in the outer ejecta is likely to include the mass postulated to be in the lobes or the torus.
| Region | Size (′′) | Temperature | Dust Mass () |
|---|---|---|---|
| Core | 0.3 | 400 | ∗ |
| Lobes, torus | 5 | ||
| Lobes | 20 | ||
| Lobes & Outer ejecta? | 28 | 114 |
If we assume that the dust around Car is similar to dust in the ISM, then the Homunculus and the surrounding area contains roughly which has been ejected during the the last yrs. The averaged dust mass loss rate over the entire phase is then . This is an order of magnitude greater than the dust mass loss rate estimated from observations of Wolf-Rayet binaries (Marchencko et al. 2002) and more than suggested by previous IR observations of Car. If the submm dust is located in the polar lobes of the nebula then it must have been ejected during the same singular event which caused the lobes - the great eruption. This eruption lasted only a few decades which gives a large time-averaged gas mass loss rate of (for more efficient dust emitters). Such a high mass loss rate was first noted in Smith et al. (2003) and suggests that the pulsational mass loss in Car is far more extraordinary than imagined.
The sub-mm observations suggest that an upper limit of of dust could exist in the extended dust shells, dust which must have been formed in the stellar wind with effective temperatures . This indicates that contrary to the study in Morgan & Edmunds (2003), significant amounts of dust could form in the stellar winds of massive stars even when the conditions in the atmospheric envelope are not reached by the available hydrodynamical models. This previously undetected mass of material in the outer ejecta has important consequences for our understanding of stellar evolution and the formation of dust in massive stars. Massive stars may therefore provide a sustainable dust yield to the ISM, in which case their contribution in chemical evolution models could be severly underestimated (e.g. Whittet 2003).
We have used critical long wavelength observations to show that a large mass of dust does exist around Carinae and suggest that the dust is distributed over a larger region than previously thought. This has important implications for stellar evolution and may provide a natural explanation for the origin of the dust seen in young supernova remnants. However Car is extremely massive and highly unstable, so the huge dust mass loss rate is not unexpected. It is very unlikely that the lower mass stars which were responsible for the supernova events of Kepler and Cas A would have ejected enough mass to form such a large quantity of dust before the explosion. In order to determine a more accurate dust mass in Car, we require simultaneous observations in the sub-mm and mm to separate the contamination of the free-free emission. We also require better resolution to determine how extended the sub-mm emission is. Future observations with Herschel and SMA will allow us to overcome this problem. These observations should also allow us to determine any variability of the star in the submm. Quantifying the dust injection from stars of different masses in different stages of their evolution will have important consequences for estimating the dust budget in both local Galaxies and those at high redshifts as well as providing fundamental information about stellar evolution.
Acknowledgements
HLG is a research fellow of the Royal Commission for the Exhibition of 1851. We thank Iain Coulson and Jan Wouterloot for help with the data reduction and Nathan Smith for interesting and informative discussions. We also thank the referee for constructive comments which have improved the paper. The James Clerk Maxwell Telescope is operated by The Joint Astronomy Centre on behalf of the Particle Physics and Astronomy Research Council of the United Kingdom, the Netherlands Organisation for Scientific Research, and the National Research Council of Canada.
References
- (1) Abraham Z., Damineli A., in Eta Carinae At The Millennium, ASP Conference Series vol. 179, 1999 eds. J. A. Morse, R. M. Humphreys, and A. Damineli, p 263
- (2) Abraham Z.,Falceta-Gonçalves D., Dominici T. P., Nyman L.-Å., Durouchoux P., McAuliffe F., Caproni A., Jatenco-Pereira V., 2005, A & A, 437, 977
- (3) Barlow M.J., et al. 2005, ApJL, 627, 113
- (4) Bohren C.F., & Huffman D.R., 1983, Absorption and Scattering of Light by Small Particles, Wiley, New York
- (5) Chesneau O., Min M., Herbst T., Waters L.B.F.M., Hillier D.J., Leinert Ch., de Koter A., Pascucci, I., et al., 2005, A & A, 435, 1043
- (6) Cox P., Mezger P.G., Sievers A., Najarro F., Bronfman L., Kreysa E., Haslam, G., 1995, A & A, 297, 168
- (7) Davidson K. & Smith N., 2000, Nature, Vol 405, P.532
- (8) Duncan R.A., & White S.M., 2003, MNRAS, 338, 425
- (9) Dunne L., Eales S., 2001, MNRAS, 327, 697
- (10) Dunne L., Morgan H.L., Eales S., Ivison, R., Edmunds, M.G., 2003, Nature, 424, 285
- (11) Dunne L., Eales S., Edmunds M.G., Ivison R., Alexander, P., Clements D.L., 2000, MNRAS, 315, 115
- (12) Fesen R.A., Morse J.A., Chevalier R.A., Borkowski K.J., Gerardy C.L., Lawrence S.S., van den Bergh S., 2001, AJ, 122, 2644
- (13) Gaviola E., 1946, Rev. Astron., 18, 252
- (14) Green D., Tuffs R.m., Popescu C., 2004, MNRAS, 355, 1315
- (15) Harvey P.M., Hoffman W.F., Campbell M., F., 1978, A & A, 70, 165
- (16) Hony S., Dominik C., Waters L.B.F.M., Icke V., Mellema G., van Boekal, R., de Koter A., Morris P.M., Barlow M., Cox P., Kaufl H.U., 2001, A & A, 377, L1
- (17) Lamers H.J.G.L.M., & Cassinelli J.P., 1999, An Introduction to Stellar Winds, 46, Cambridge University Press, Great Britian
- (18) Marchenko S.V., Moffat A.F.J., Vacca W.D., Côté, S., Doyon R., 2002, ApJ, 565, L59
- (19) Morgan H.L., Edmunds M.G., 2003, MNRAS, 343, 427
- (20) Morgan H.L., Dunne L., Eales S., Ivison R., Edmunds, M.G., 2003, ApJ, 597, L33
- (21) Morris. P.W., et al., 1999, Nature, 402, 502 (M99)
- (22) Pittard J., PhD Thesis, 1999, University of Birmingham
- (23) Pittard J., 2003, Astronomy and Geophysics, Vol 44, P.1.17-1.22
- (24) Pittard J.M., Stevens I.R., Corcoran M.F., Ishibashi K., 1998, MNRAS, 299, L5
- (25) Polomski E., Telesco C.M., Pina R.K., Scott Fisher, R., 1999, ApJ, 118, 2369
- (26) Pozzo M., Meikle W.P.S., Fassia A., Geballe T., Lundqvist P., Chugai N.N., Sollerman J., 2004, MNRAS, 352, 457
- (27) Robinson G., Mitchell R.M., Aitken D.K., Briggs G.P., Roche P.F., 1987, MNRAS, 227, 535
- (28) Sandell G., Jessop N., Jenness T., 2001, SCUBA Map Reduction Cookbook, starlink cookbook 11.2
- (29) Smith N., Gehrz R., 2000, ApJ,529, L99
- (30) Smith N., Gehrz R.D., Hinz P.M., Hoffman W.F., Mamajek, E.E., Meyer M.R., Hora J.L., 2002, ApJ, 567, L77
- (31) Smith N., Gehrz R.D., Hinz P.M., Hoffmann W.F., Hora J.L., Mamajek E.E., Meyer M.R., 2003, ApJ, 125, 1458
- (32) Smith N.M., Morse J.A., 2004, ApJ, 605, 854
- (33) Sugerman B.E.K., Ercolano B., Barlow M.J., Tielens A.G.G.M., Clayton G.C., Zijlstra A.A., Meixner M., Speck A., et al., 2006, Science, 313, 196, pre-print, astro-ph/0606132
- (34) Voors R.H.M., et al., 2000, A & A., 356, 501
- (35) Weis K., in The Fate of the Most Massive Stars, 2005 ASP Conference Series, Vol. 332, eds. R. Humphreys and K. Stanek, p.275
- (36) White S.M., Duncan R.A., Lim J., Nelson G.J., Drake S.A., Kundu M.R., 1994, ApJ, 429, 380
- (37) White S.M., Duncan R.A., Chapman J.M., Koribalski B., 2005, in The Fate of the Most Massive Stars, ASP Conference Series, Vol. 332, eds. R. Humphreys and K. Stanek, p.129
- (38) Whittet D.C.B., 2003, Dust in the Galactic Environment Second Edition, IOP, Cambridge University Press, UK
- (39) Wilson T.L., Batrla W., 2005, A&A, 430, 561
- (40) Wright A.E., & Barlow M.J., 1975, MNRAS, 170, 41