High-Resolution Spectroscopy of GRB 030226: Features of a Massive Star Progenitor or Intervening Absorption Systems?
Abstract
We present a high-resolution Keck/ESI spectrum of GRB 030226, which exhibits four absorption systems at , , , and . The two highest redshift systems, separated by about 2400 km s-1, have been previously suspected as kinematic features arising in the circumstellar wind around the progenitor star. However, the high column densities of low-ionization species (including possibly neutral hydrogen) in the blue-shifted system, are inconsistent with the expected highly ionized state of the circumstellar wind from the massive progenitor star, even prior to the GRB explosion. This conclusion is also supported by the lack of detectable absorption from fine-structure transitions of Si II and Fe II. Instead we conclude that the two redshift systems are similar to multiple DLAs found in QSO sight lines with a similar velocity separation and chemical abundance of [Cr/Fe] and [Zn/Fe]. The absorption system at is likely an intervening low-mass galaxy, possibly related to the GRB host as part of a forming large-scale structure.
Subject headings:
cosmology:observations — galaxies:abundances — galaxies:ISM — gamma rays:bursts1. Introduction
The idea that the progenitors of long-duration -ray bursts (GRBs) are massive stars is now well-established, based in particular on the detection of associated type Ic supernovae (e.g., Galama et al. 1998; Stanek et al. 2003). The nature of these supernovae, and theoretical considerations, have lead to the suggestion that the progenitors are massive Wolf-Rayet (WR) stars (MacFadyen & Woosley, 1999). Such stars shed a considerable fraction of their mass in a fast ( km s-1) wind (e.g., Abbott 1978). As a result, absorption spectroscopy of GRB afterglows can in principle probe the composition and kinematics of the wind, providing in turn direct information on the nature and identity of the progenitor star. Previous observations have in fact uncovered such blue-shifted absorption systems, which have been used to argue for carbon-rich (WC) Wolf-Rayet progenitors (e.g., Mirabal et al. 2003; Fiore et al. 2005; Berger et al. 2006), potentially in binary systems (Starling et al., 2005; Berger et al., 2006).
One central question to answer in applying the potentially powerful diagnostics from absorption lines is whether blue-shifted absorbers arise from outflowing circumstellar gas, or separate intervening absorbers arising from different galaxies. In addition, the intense radiation field produced by the GRB can modify the circumstellar environment through ionization, excitation, and destruction of dust grains (e.g., Perna & Loeb 1998; Draine & Hao 2002). However, these processes, as well as the relative abundance of low- and high-ionization ions, may in fact serve to distinguish the location of the absorbers (Prochaska et al., 2006).
Here we analyze a high resolution spectrum of GRB 030226 in a continued effort to characterize the circumstellar and interstellar environments around GRBs. This burst is of particular interest because it is one of only a few that exhibit a blue-shifted absorption system with a velocity of a km s-1 (Klose et al., 2004), possibly representing the circumstellar wind from the progenitor star. However, based on the relative strengths of the low- and high-ionization lines, and the lack of detectable fine-structure transitions we conclude that the blue-shifted absorption system is not circumstellar. Instead we conclude that the blue-shifted system is an intervening galaxy similar to the multiple DLAs found in some quasar spectra (Ellison & Lopez, 2001; Lopez & Ellison, 2003).
2. Observations
GRB 030226 was detected by the HETE-2 satellite on 2003 February 26.157 UT. The optical afterglow was discovered with the du Pont 100-inch telescope at Las Campanas Observatory 2.6 hr after the burst (Fox et al., 2003), followed by a measurement of the redshift, (Klose et al., 2004). The latter authors present an analysis of a low resolution spectrum obtained with the VLT, which also exhibits a second absorption system at .
We obtained a 2700 s spectrum of the afterglow with the Echellette Spectrograph and Imager (ESI) mounted on the Keck II 10-m telescope starting 4.2 hr after the burst. The data were reduced using custom IRAF routines to bias-subtract, flat-field, and rectify the ten individual echelle orders. Sky subtraction was performed using the method and software described in Kelson (2003). Wavelength calibration was performed using CuAr and HgNeXe arc lamps and air-to-vacuum and heliocentric corrections were applied. The spectrum covers the range of Å at a velocity resolution of 11.5 km s-1. The signal-to-noise over the bulk of the spectral range ( Å) is about 40.
We obtained a second spectrum, totaling 6000 s, to search for variability in the wavelengths and equivalent widths with ESI 27.4 hr after the burst. The data were reduced in the manner detailed above. The signal-to-noise of this second spectrum is about 10.
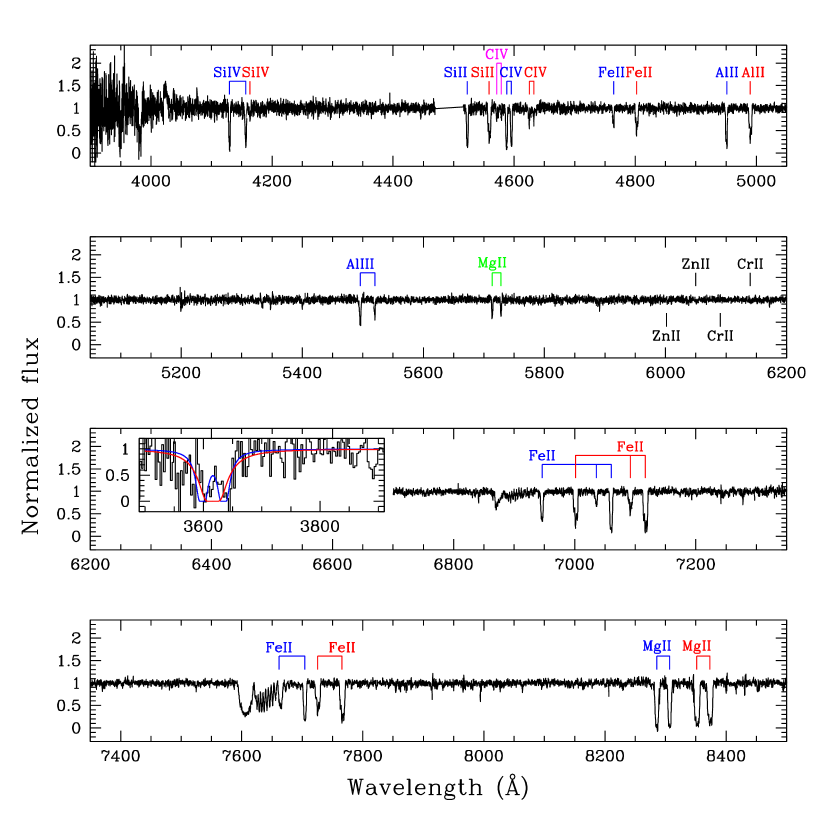
In the first spectrum, shown in Figure 1, we identify four absorption systems at , , , and . The absorbers , and were identified in Klose et al. (2004). We identify the additional absorber from its C IV lines. Finally , the uncertain lines at 5494 and 5517 Å noted in the VLT spectrum are revealed as Al III lines of here.
We further compared the equivalent widths and redshifts of all lines detected in our two ESI spectra to search for time-dependent effects. Within the uncertainties of about in equivalent width and about 10 km s-1 in redshift, we find no systematic changes for any of the low- and high-ionization lines.
We measured the column densities of the various absorption lines using the apparent optical depth (AOD) method (Savage & Sembach, 1991):
| (1) |
where and are the observed and continuum intensities, respectively. The apparent column density is given by:
| (2) |
where and are the oscillator strengths and wavelengths of the absorption lines, respectively. The total apparent column density is given by between velocity limits and . The measured rest-frame equivalent widths and inferred column densities for each line are given in Tables 1 and 2, and the final adopted columns are summarized in Table 3.
3. Results
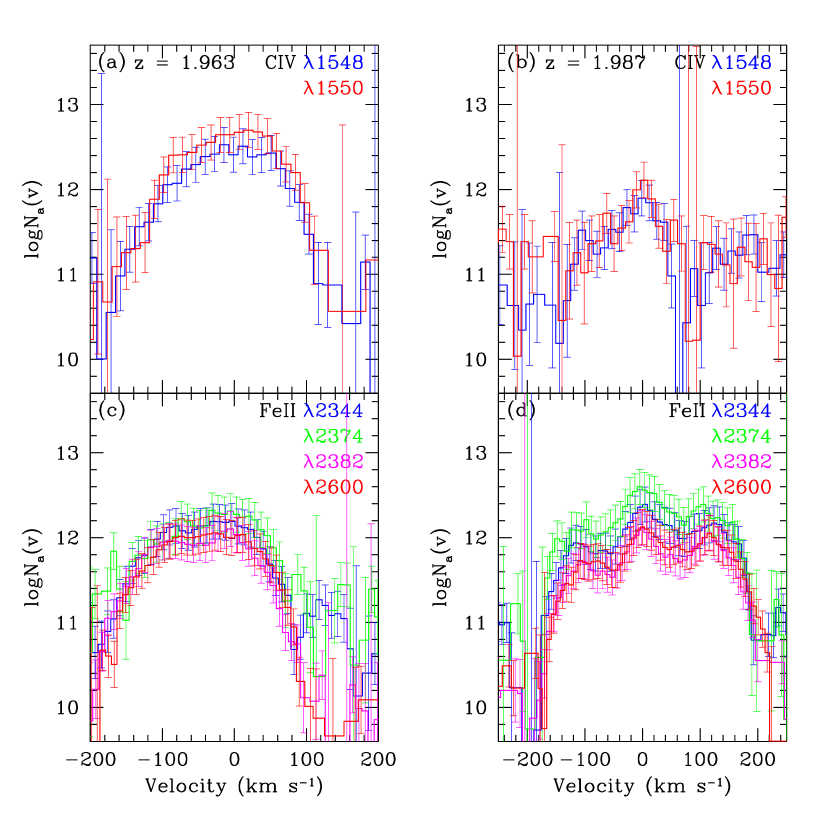
The absorption systems and are separated by km s-1 and exhibit strong low-ionization lines of Fe II, Si II, Al II, and Mg II, as well as high-ionization lines of Si IV, C IV, and in the case of Al III. The kinematic structure of these lines is apparent in the column density profiles shown in Figure 2. The low-ionization lines show two and three sub-components spanning a total velocity range of about and km s-1 for and , respectively. This is similar to the absorption profiles found in previous echelle spectra of, for example, GRB 051111 (Penprase et al., 2006; Prochaska et al., 2006). On the other hand, the high-ionization lines show only a single asymmetric peak, which coincides in velocity with the strongest sub-component of the low-ionization lines (Figure 2).
3.1. Abundances
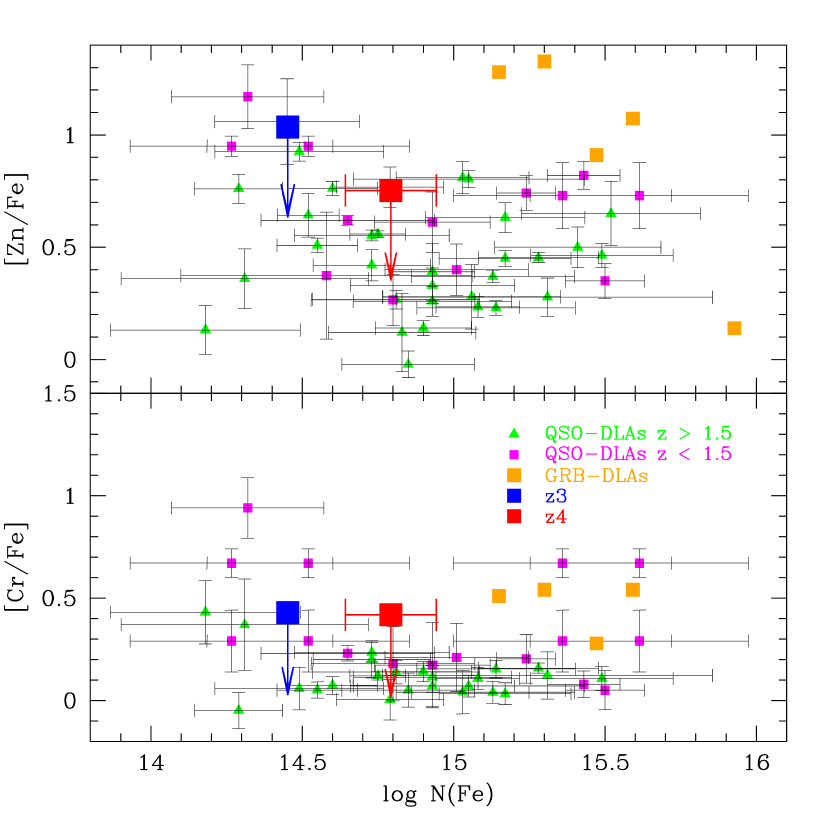
Our ability to measure the chemical abundances of the and absorbers is somewhat limited by line saturation and the uncertainty in the hydrogen column density. Still, for the low-ionization species we are able to derive robust column densities for Fe II, as well as limits for Cr II, Zn II, and excited fine-structure states of Si II and Fe II. Compared to most previous GRB absorption systems (e.g., Savaglio & Fall 2004), the column densities of Fe II are at least 0.5 dex lower, and , respectively (see Figure 3). Based on the non-detection of Fe II, we find and , respectively, indicating that saturation is not a significant problem.
The limits on Cr II and Zn II are derived by applying the AOD method to the appropriate velocity range around Cr II and Zn II. We find and , and and for and , respectively. Thus, for both systems, in good agreement with the values measured for QSO absorbers of (Figure 3). Similarly, and for and , respectively, placing it within the range of values found for QSO absorbers, (e.g., Meiring et al. 2006). The majority of previous GRB absorbers have , which has been interpreted as an indication for dust depletion111But see Prochaska (2006) for the impact of spectral resolution on these conclusions. (Savaglio & Fall, 2004) based on the fact that zinc is a non-refractory element, while iron can be strongly depleted in dust grains. In the case of GRB 030226, multi-band afterglow observations and polarization measurements (Klose et al., 2004) point to a low dust-to-gas ratio along the line of sight. This suggests that our values of [Zn/Fe] and [Cr/Fe] are meaningful upper limits.
To derive the metallicity of and we re-analyzed the VLT/FORS2 spectrum presented in Klose et al. (2004) following the procedures outlined in §2. The signal-to-noise at the location of the Ly absorption feature is low, per resolution element, but we find that the line profile is best fit with a pair of absorbers at the redshifts of and , each with (H I) and an uncertainty of about 0.3 dex; a more marginal fit for a single absorber has and (H I) (see inset in Figure 1). Thus, using the limit on Zn II, we find a metallicity and for and , respectively. Assuming iron is weakly depleted as discussed above we find and , respectively. These values are at the low end of the distribution for GRB-DLAs (Berger et al., 2006).
3.2. Kinematics
Our primary interest is in understanding the nature of the and systems in light of their 2400 km s-1 velocity separation. This is similar to the multiple absorption features spanning km s-1 observed in the spectrum of GRB 021004, which have been interpreted to arise in the circumstellar wind of the massive progenitor star (Möller et al., 2002; Schaefer et al., 2003; Mirabal et al., 2003; Fiore et al., 2005; Starling et al., 2005). An alternative explanation is that could be an intervening system, while the absorption lines of arise from interstellar gas in the GRB host galaxy. Such multiple intervening absorption systems have been found in QSO spectra (Ellison & Lopez, 2001; Lopez & Ellison, 2003; Masiero et al., 2005).
Several lines of evidence suggest that the circumstellar wind scenario222Or for that matter other phenomena local to the burst such as a superbubble produced by stellar winds and supernovae in the burst’s star forming region with a scale of a few pc (e.g., Mirabal et al. 2003). is an unlikely explanation. First, unlike in the case of GRB 021004 we do not detect an intermediate velocity (few hundred km s-1) absorber. Such an absorber is expected to arise from the interaction of the WR wind with the red supergiant wind (van Marle et al., 2005). Still, this may not be a significant problem for the circumstellar model if the GRB explosion occurred more than yr after the onset of the WR phase, since on this timescale the shell dissipates into the circumstellar bubble (van Marle et al., 2005). If this was in fact the case, then it would appear that the progenitor of GRB 021004 exploded earlier in its evolution compared to the progenitor of GRB 030226.
However, a more difficult problem to overcome for the circumstellar model is the presence of strong low-ionization lines in spite of the progenitor and the burst ionizing radiation. This problem has already been noted for GRB 021004, in particular the detection of outflowing hydrogen gas kinematically coincident with highly ionized gas (C IV, Si IV). From the observed brightness of the burst, mag at hr (Klose et al., 2004), we expect species such as Mg II (with cm2 at eV) to be ionized out to a distance of about 50 pc from the burst (following the formulation of Prochaska et al. 2006) in the absence of shielding by a large column of neutral hydrogen gas. The fast WR wind is expected to span only pc, well within the expected radius of the Strömgren sphere, pc (van Marle et al., 2005), and therefore well inside of the region of pc in which Mg II and Fe II will be ionized in the absence of neutral hydrogen.
In the case of GRB 021004, the ratio of Fe II to Si IV was and for the zero-velocity and the km s-1 systems, respectively (Fiore et al., 2005). However, here we find the opposite situation, namely Fe II is over-abundant relative to Si IV, with values of and for and , respectively.
Even if neutral hydrogen could survive near the progenitor star, the measured column density of cm-2 (§3.1) is more than four orders of magnitude larger than that of GRB 021004, and requires the presence of M⊙ of hydrogen even if we limit the size of the WR wind to pc. There is no clear scenario that can allow for such a large mass of hydrogen within the WR wind. The inferred column density of Fe II is equally high in this context. For a mass loss rate of M⊙ yr -1 and an iron mass fraction of about (Gräfener & Hamann, 2005) the expected column density is only about cm-2 if the iron is distributed uniformly over a radius of 1 pc. Clumping may lead to regions of significantly higher column density, but in this case we expect only partial covering, as opposed to the observed zero transimission at the bottom of the absorption features.
Finally, the absence of absorption features from fine-structure Fe II and Si II suggests that the gas is located far from the burst, in the framework of radiative pumping, and/or has a relatively low density if we consider collisional excitation. We find a limit of and for and , respectively, from the non-detection of Fe II. This corresponds to a ratio of and for the two absorbers. In comparison, for GRB 051111 the corresponding value was about (Penprase et al., 2006; Prochaska et al., 2006). For the limit on fine-structure Si II∗ is , somewhat lower than the detected ratio of in the case of GRB 051111 (Penprase et al., 2006; Prochaska et al., 2006); Si II∗ for is blended with the C IV line of , preventing a useful limit on the column density.
In the context of collisional excitation, the limit on , indicates a hydrogen volume density of cm-3 for K and an electron fraction of (Silva & Viegas, 2002). In the case of radiative pumping, the non-detection of fine-structure absorption suggests that the gas is located pc away from the burst (Prochaska et al., 2006), much beyond the fast WR wind. This limit is further supported by the lack of changes in line equivalent widths (§2).
We note that in the case of GRB 021004 it has been argued that it may be possible to maintain low-ionization species (and hydrogen) in the circumstellar environment if the GRB jet was for example structured (Starling et al., 2005), or as a result of shielding and mixing (Mirabal et al., 2003). However, these explanations are at best speculative for the case of GRB 021004, and are unlikely to work in the more extreme case of high column density low-ionization species in GRB 030226.
Based on these various lines of reasoning, we conclude that the blue-shifted system does not arise in the progenitor wind. Instead we conclude that and are multiple DLAs, remarkably similar to the multiple intervening absorbers found by Ellison & Lopez (2001); Lopez & Ellison (2003) at a similar redshift and with a similar velocity of separation of km s-1. In particular, the absorber is similar to absorbers CTQ247C observed by Lopez & Ellison (2003) and DLA B introduced in Ellison & Lopez (2001). Both of these have a similar hydrogen column density with no detectable Cr II and Zn II lines.
4. Discussion
We find four absorption systems in the spectrum of GRB 030226, of which the two highest redshift systems are separated by only 2400 km s-1. Absorber is separated by about 3400 km s-1 from and 1100 km s-1 from , but is detected only in C IV. As such it most likely arises in the halo of an intervening galaxy. Although was previously suspected to arise in the outflowing circumstellar gas surrounding the progenitor star (Klose et al., 2004), we conclude that this scenario is unlikely based on the presence of high column density low-ionization species, the lack of excited fine-structure lines, the large column density of iron, and the possible presence of large column density of neutral hydrogen. A more likely scenario is that system is an intervening absorber.
This conclusion leaves only GRBs 021004 and 050505 as showing potential evidence for wind outflows from the progenitor star. In the former case, the presence of high velocity neutral hydrogen, as well as Mg II and Fe II, presents a challenge in the context of WR wind models and the ionizing radiation of the burst (Starling et al., 2005). In the latter case, only high-ionization C IV is detected in outflow (Berger et al., 2006), removing the problem of explaining the presence of low-ionization lines, but the low resolution of the spectrum prevents a detailed study. Given the influence of the kinematic and ionization structure of the wind in the pre-explosion environment, as well as the effects of the GRB radiation field itself, it is of prime importance to make model predictions for the type and column density of various ionic species that can be observed in the afterglow spectrum. Such models can be used to assess whether any of the outflowing systems observed to date are in fact signatures of the stellar wind.
Assessing as an intervening absorber, we note that both and the host galaxy absorber exhibit similar abundances and kinematics compared to previous GRB-DLAs and multiple DLAs found in QSO sight lines. Assuming that iron is weakly depleted (as suggested by several lines of evidence, see §3.1) the gas metallicity is somewhat lower than in most previous GRB-DLAs, and , respectively.
Since most likely represents an intervening galaxy, we may be able to identify it in deep imaging around the GRB position, and spectroscopy of possible intervening galaxies in the field. Previous narrow-band imaging observations aimed at finding Ly emission in the range , have uncovered three galaxies that may have similar redshifts to the and absorbers (Jakobsson et al., 2005). No source was detected at the GRB position. These putative counterparts are faint and it is reasonable to interpret both the undetected GRB host galaxy and the intervening systems as low mass galaxies with low metallicity and dust content.
The remaining open question is whether there is a link between the GRB host absorber and the intervening systems. It has recently been shown that the probability of finding multiple intervening absorbers toward GRBs is larger compared to QSO sight lines (Prochter et al., 2006). However, the majority of these systems are separated by km s-1 and are unlikely to be physically connected. With a velocity separation of 2400 km s-1 it is conceivable that and the GRB host are part of the same large-scale structure, as has been suggested for the multiple DLAs in QSO sight lines (Lopez & Ellison, 2003). Future observations of the environment of GRB 030226, as well as similar absorption systems may shed light on the dependence of the number and velocity difference of intervening systems on the properties of GRB host galaxies and their large-scale environments.
References
- Abbott (1978) Abbott, D. C. 1978, ApJ, 225, 893
- Berger et al. (2006) Berger, E., Penprase, B. E., Cenko, S. B., Kulkarni, S. R., Fox, D. B., Steidel, C. C., & Reddy, N. A. 2006, ApJ, 642, 979
- Draine & Hao (2002) Draine, B. T., & Hao, L. 2002, ApJ, 569, 780
- Ellison & Lopez (2001) Ellison, S. L., & Lopez, S. 2001, A&A, 380, 117
- Fiore et al. (2005) Fiore, F., et al. 2005, ApJ, 624, 853
- Fox et al. (2003) Fox, D. W., Chen, H. W., & Price, P. A. 2003, GRB Coordinates Network, 1879, 1
- Galama et al. (1998) Galama, T. J., et al. 1998, Nature, 395, 670
- Gräfener & Hamann (2005) Gräfener, G., & Hamann, W.-R. 2005, A&A, 432, 633
- Jakobsson et al. (2005) Jakobsson, P., et al. 2005, MNRAS, 362, 245
- Kelson (2003) Kelson, D. D. 2003, PASP, 115, 688
- Klose et al. (2004) Klose, S., et al. 2004, AJ, 128, 1942
- Lopez & Ellison (2003) Lopez, S., & Ellison, S. L. 2003, A&A, 403, 573
- MacFadyen & Woosley (1999) MacFadyen, A. I., & Woosley, S. E. 1999, ApJ, 524, 262
- Masiero et al. (2005) Masiero, J. R., Charlton, J. C., Ding, J., Churchill, C. W., & Kacprzak, G. 2005, ApJ, 623, 57
- Meiring et al. (2006) Meiring, J. D., et al. 2006, MNRAS, 370, 43
- Mirabal et al. (2003) Mirabal, N., et al. 2003, ApJ, 595, 935
- Möller et al. (2002) Möller, P., et al. 2002, A&A, 396, L21
- Penprase et al. (2006) Penprase, B. E., et al. 2006, ApJ, 646, 358
- Perna & Loeb (1998) Perna, R., & Loeb, A. 1998, ApJ, 501, 467
- Prochaska (2006) Prochaska, J. X. 2006, preprint (astro-ph/0606500)
- Prochaska et al. (2006) Prochaska, J. X., Chen, H.-W., & Bloom, J. S. 2006, preprint (astro-ph/0601057)
- Prochter et al. (2006) Prochter, G. E., et al. 2006, preprint (astro-ph/0605075)
- Savage & Sembach (1991) Savage, B. D., & Sembach, K. R. 1991, ApJ, 379, 245
- Savaglio & Fall (2004) Savaglio, S., & Fall, S. M. 2004, ApJ, 614, 293
- Schaefer et al. (2003) Schaefer, B. E., et al. 2003, ApJ, 588, 387
- Silva & Viegas (2002) Silva, A. I., & Viegas, S. M. 2002, MNRAS, 329, 135
- Stanek et al. (2003) Stanek, K. Z., et al. 2003, ApJ, 591, L17
- Starling et al. (2005) Starling, R. L. C., Wijers, R. A. M. J., Hughes, M. A., Tanvir, N. R., Vreeswijk, P. M., Rol, E., & Salamanca, I. 2005, MNRAS, 360, 305
- van Marle et al. (2005) van Marle, A. J., Langer, N., & García-Segura, G. 2005, A&A, 444, 837
| Line | ||||
|---|---|---|---|---|
| (Å) | (Å) | (cm-2) | ||
| 5713.77 | Mg II 2796.35 | 0.6123 | ||
| 5728.38 | Mg II 2803.53 | 0.3054 | ||
| 4571.11 | C IV 1548.20 | 0.1908 | ||
| 4578.85 | C IV 1550.77 | 0.0952 | ||
Note. — Absorption features of the intervening redshift systems and identified in our spectrum of GRB 030226. Uncertainties are .
| Line | |||||||
|---|---|---|---|---|---|---|---|
| (Å) | (Å) | (cm-2) | (Å) | (Å) | (cm-2) | ||
| Si IV 1393.75 | 0.5280 | 4130.03 | 4163.70 | ||||
| Si IV 1402.77 | 0.2620 | 4156.77 | |||||
| Si II 1526.71 | 0.1270 | 4523.30 | 4558.77 | ||||
| C IV 1548.20 | 0.1908 | 4587.62 | 4625.02 | ||||
| C IV 1550.77 | 0.0952 | 4595.50 | 4632.56 | ||||
| Fe II 1608.45 | 0.0580 | 4764.75 | 4802.22 | ||||
| Al II 1670.79 | 1.8800 | 4951.64 | 4989.84 | ||||
| Al III 1854.72 | 0.5390 | 5495.90 | |||||
| Al III 1862.79 | 0.2680 | 5519.88 | |||||
| Fe II 2344.21 | 0.1140 | 6946.88 | 7001.30 | ||||
| Fe II 2374.46 | 0.0313 | 7036.33 | 7091.71 | ||||
| Fe II 2382.77 | 0.3200 | 7061.33 | 7116.45 | ||||
| Fe II 2586.65 | 0.0691 | 7725.35 | |||||
| Fe II 2600.17 | 0.2390 | 7705.29 | 7765.60 | ||||
| Mg II 2796.35 | 0.6123 | 8286.77 | 8351.53 | ||||
| Mg II 2803.53 | 0.3054 | 8307.97 | 8373.01 | ||||
Note. — Absorption features of the redshift systems and identified in our spectrum of GRB 030226. Uncertainties are .
| Ion | ||
|---|---|---|
| C IV | ||
| Mg II | ||
| Al II | ||
| Al III | ||
| Si II | ||
| Si II∗ | ||
| Si IV | ||
| Cr II | ||
| Fe II | ||
| Fe II∗ | ||
| Zn II |
Note. — Ionic column densities of the and absorption systems.