Entropy of gas and dark matter in galaxy clusters
Abstract
On the basis of a large scale ’adiabatic’, namely non-radiative and non-dissipative, cosmological smooth particle hydrodynamic simulation we compare the entropy profiles of the gas and the dark matter (DM) in galaxy clusters. We employ the quantity as measure for the entropy of the intra-cluster gas. By analogy the DM entropy is defined as ( is the 3D velocity dispersion of the DM). The DM entropy is related to the DM phase space density by . In accord with other studies the radial DM phase space density profile follows a power law behaviour, , which corresponds to . The simulated intra-cluster gas has a flat entropy core within , where is the NFW scale radius. The outer profile follows the DM behaviour, , in close agreement with X-ray observations. Upon scaling the DM and gas densities by their mean cosmological values we find that outside the entropy core a constant ratio of prevails. By extending the definition of the gas temperature to include also the bulk kinetic energy the ratio of the DM and gas extended entropy is found to be unity for . The constant ratio of the gas thermal entropy to that of the DM implies that observations of the intra-cluster gas can provide an almost direct probe of the DM.
keywords:
methods: numerical - galaxies: clusters: general1 Introduction
Clusters of galaxies represent a composite of baryonic and dark matter (DM). The gas is commonly described by its thermodynamic variables, such as density, temperature, pressure and also entropy. The entropy provides a unique gauge for monitoring the thermal history of the gas. In the standard model of structure formation the primordial gas is isentropic. Ignoring radiative and dissipative processes and other non-gravitational sources or sinks of energy the only mechanism by which the gas entropy can change is via shock waves. According to the paradigm of hierarchical structure formation clusters form by merging and accretion of smaller building blocks, which usually contain baryons and DM. The collapse and merging of substructures lead to emergence of shock waves in the forming intra-cluster gas (ICM) and it ceases to be isentropic. These shocks can be seen close to the virial radius when the gas is accreted onto the cluster (see e.g. Borgani et al. 2005; Voit 2005; Voit et al. 2005). However, the study of Pfrommer et al. (2006) shows that a non negligible amount of energy is dissipated by shocks further inside the cluster potential well. In any case the resulting entropy structure reflects the contribution of irreversible processes in the formation of clusters. The main problem addressed here is to what extent the gas entropy resembles the structure of the DM halo and whether the classical thermodynamic description of the gas can be extended and applied to the DM.
The entropy of the ICM can be deduced from X-ray observations. As has become customary in this field, we refer to as the ’entropy’, where is temperature and is the density of the gas. More precisely, we define , where is the Boltzmann constant and is the internal 3D velocity dispersion of the gas. It is the latter expression upon which the direct comparison between the gas and the dark matter is based. Using XMM-Newton observations of 10 relaxed clusters Pratt et al. (2006) find the radial profile of follows a power law of with (see also Donahue et al. 2006). Apart from the central regions the slope obtained in adiabatic simulations agree with the observed values (e.g. Voit 2005). The observations, however, show an excess in entropy which is thought to originate from non gravitational processes (e.g. Finoguenov et al. 2003; Borgani et al. 2005). Note, the actual entropy of an ideal gas is , but here we follow the common convention and associate the entropy with .
The concept of entropy has also been applied to collisionless self-gravitating systems in its Boltzmann-Gibbs formulation (e.g. Lynden-Bell 1967; Lynden-Bell & Wood 1968) and in an analogy with the thermodynamic entropy of a perfect gas (White & Narayan, 1987; Navarro et al., 1995; Eke et al., 1998). It is the latter approach that we follow here. In analogy with classical thermodynamics and the ideal gas equation of state we write the local specific entropy , where is the DM velocity dispersion and an additive constant is neglected. A similar approach is presented by Eke et al. (1998). Following the convention used in the studies of clusters of galaxies we define . Note that the DM specific entropy is the log of the inverse of the so-called phase space density . Now, the analysis of simulated DM halos by Taylor & Navarro (2001) has shown that the radial phase space density profile closely follows a power law, . Using a set of high-resolution N-body simulations Ascasibar et al. (2004) confirm this power-law behaviour for an extend range of haloe masses, in addition they find coincidence of the zero-points if the profiles are conveniently rescaled by virial quantities. Changing variables from to the Taylor & Navarro (2001) power law is given by
| (1) |
The close similarity of the (appropriately converted) Taylor & Navarro (2001) slope and the slope derived from X-ray observations by Pratt et al. (2006) has motivated us to compare the DM and gaseous entropy profiles of clusters of galaxies extracted from a large scale ’adiabatic’ Smoothed Particle Hydrodynamics (SPH) simulation. In this context adiabatic is defined as non-radiative with no non-gravitational sources or sinks of energy. In such kind of simulations the entropy of each particle remains constant as long as it does not pass through a shock front (Springel, 2005). The only dissipative process is introduced by the numerical viscosity which damps unphysical oscillations behind shock fronts and thus transfers kinetic into thermal energy in accordance with the Rankine-Hugoniot jump conditions.
2 Simulation
This simulation, dubbed The MareNostrum Universe and described in detail in Gottlöber et al. (2006), was performed with the entropy conserving Gadget2 code (Springel, 2005). It followed the non linear evolution of the cosmic density fields of the gas and the DM from to the present epoch () within a comoving cube of edges. The spatially flat concordance model employing the following parameters was adopted: , , , the Hubble parameter , the slope of the power spectrum and the normalisation . Both components, the gas and the DM, are resolved by particles, which results in a mass of for the DM particles and for the gas particles. The gas dynamical equations were solved by SPH without including dissipative or radiative processes or star formation, i.e. the gas was treated adiabatically in the above discussed sense. The SPH smoothing length has been set to the nearest neighbour of each SPH particle and a gravitational force resolution was chosen equivalent to a Plummer softening of (comoving). The SPH softening was not allowed to fall below the gravitational softening length.
The cluster ensemble comprises 96 massive clusters selected from the simulation volume. The clusters were found by a friends of friends algorithm (FoF) with a linking length of 0.17 times the mean particle separation applied to the DM component only. This corresponds roughly to the virial overdensity. In a second step substructures within the cluster volumes were identified by reducing the linking length of the FoF group finder by a factor of 4 which defines substructures at roughly 64 times the virial overdensity. The choice of this particular linking length is somewhat arbitrary, however it has been found to adequately identify relevant substructure, such as double or triple core systems. The cluster centre was associated with the centre of the most massive substructure of the cluster. Subsequently the virial radius determined as the cluster centric radius which encloses 334 times the mean cosmic density and the virial mass were computed as the sum of the gas and the dark matter mass within that radius. The virial masses lie in between and corresponding to particles per species. In total 370 clusters with masses above are found within the simulation volume and for a even lower limit of we obtain 3708 objects. The selection process for the clusters in combination with the steep mass function causes our sample to thin out at the low mass end, but for high masses () it can assumed to be complete. To assure the best possible determination of the central properties of the cluster the centre was redefined as the associated peak of the density field smoothed by a sphere. On average this re-adjustment changed the location of the centres by only a few .
3 Entropy profiles of the gas and the dark matter

The aim of this section is to demonstrate the similarities in the entropy profiles of the dark and the gaseous matter. As motivated above we will refer to the entropy of the gas and the DM as
| (2) |
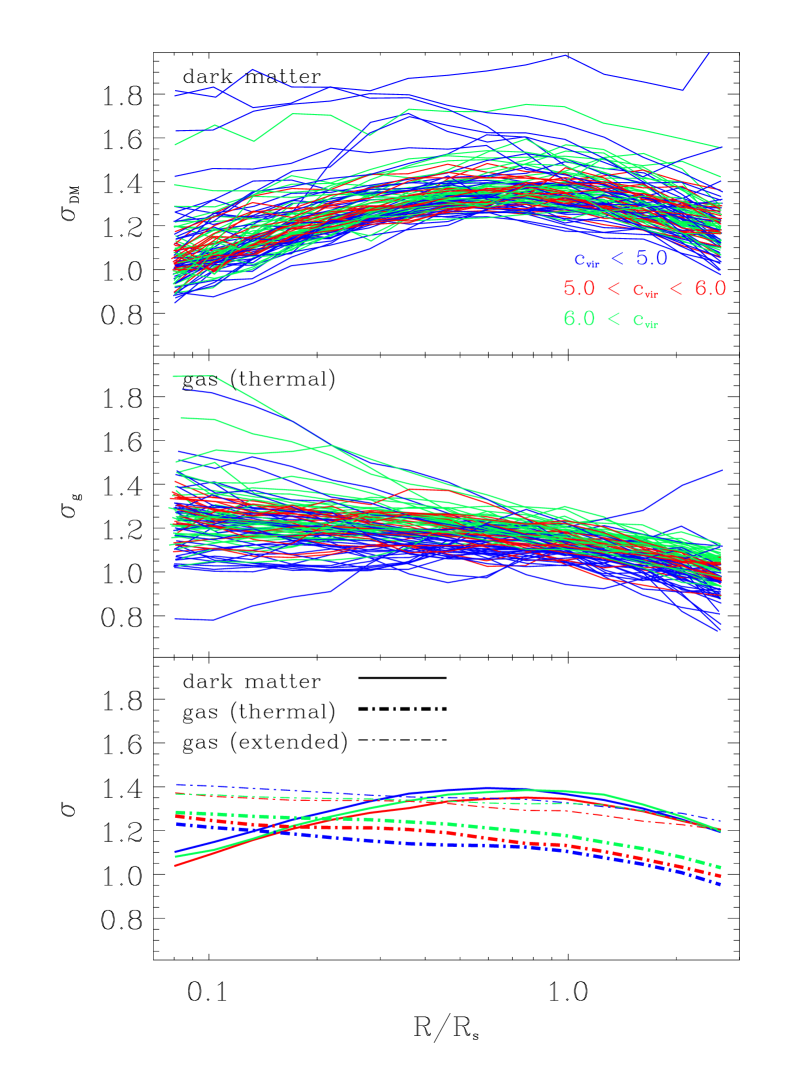
were is the density, is the three dimensional velocity dispersion and stands for either (dark matter) or (gas). The velocity dispersion of the dark matter within a radial bin is computed as the rms velocity of the particles within that bin. By their nature, the gas particles are characterised by two distinct properties related to their kinetic energy, namely, a proper velocity (same as for dark matter particles) and a temperature. The proper motions of the gas particles will be referred to as bulk motions and the corresponding velocity dispersion will be addressed as turbulent dispersion. Also the temperature of the gas will be expressed by means of the velocity dispersion that represents the thermal energy per unit mass, namely by , where is the proton mass and for a completely ionised gas. The velocity dispersion of the gas derived from its temperature will be referred to as thermal dispersion. The composite of the two gaseous dispersions is the extended dispersion.
Before proceeding to show the average properties of the cluster ensemble we examine in some detail the structural and thermal properties of three typical clusters, selected with the intention to approximately cover the range of concentrations apparent in the ensemble. Fig. 1 displays radial profiles, namely the density, radial bulk velocity, velocity dispersion and entropy profiles, of three arbitrarily chosen clusters of comparable masses (). The uppermost panels show the density profiles for the DM and the gas scaled by the corresponding cosmic mean density . The concentration parameter specified in the upper right corners is based on a NFW-fit (Navarro et al., 1997) to the DM component and the associated profile is displayed with the dotted lines. The gas velocity dispersion and entropy is decomposed into the thermal and kinetic components. In addition the extended dispersion and entropy of the gas is shown.
The important features to notice in Fig. 1 are: (a) The excellent NFW fit to the DM density profile of the high concentration cluster, while the gas density exhibits a core structure; (b) The lack of significant radial streaming motions of the high concentration cluster implies that it is a relaxed cluster while the others are still dynamically evolving; (c) The DM velocity dispersion profile of all clusters show a ’temperature inversion’, namely the velocity dispersion increases with radius within . The gas thermal and extended velocity dispersions at the very centre (below ) show the opposite behaviour, at these radii a negative temperature gradient of the gas is apparent in all the clusters. Cluster displays an almost isothermal core with the hint for a maximal temperature at the same radius where the DM dispersion peaks. (d) The DM entropy profile is close to a power law independent of the dynamical state of the cluster (compare to Ascasibar et al. 2004). Within the thermal and extended gas entropies show a core structure. Outside that region the extended gas entropy almost perfectly coincides with the DM entropy.

Fig. 2 presents a direct comparison of the DM and the thermal and extended gas entropy profiles as defined in Eq. 2 for the 96 clusters in the sample. The DM entropy is displayed in the upper panel and the gas thermal entropy is given in the middle panel. The bottom panel exhibits the mean of the DM and the thermal and extended gas entropy profiles. The mean profiles reproduce the trends followed by the individual clusters of Fig. 1. The DM profile follows a power law of the form , where . This logarithmic slope corresponds to a slope for the phase space density profile of . The mean gas thermal and extended profiles keep almost a constant displacement (in the log-log plane). The gas exhibits an entropy core of a radius . Outside that core the gas entropy trails the DM power law. In particular, the extended entropy coincides with the DM entropy. The lower panel of Fig. 2 presents the main new result of the paper, namely that the gas extended entropy outside the core coincide with the DM entropy not only in slope but also in amplitude.

The thermal entropy of the gas is more accessible to astronomical observations than the extended one. So, the ratio of the thermal to the DM entropy profile of all the clusters is presented Fig. 3. Outside the core that ratio is virtually constant and exhibits a small scatter, .
4 Gas Core Structure
The present results provide further support for the findings by Voit (2005) that the emergence of the entropy core in adiabatic simulations is a real physical effect and is not a numerical artifact. Another indication for the reality of the entropy core comes from the comparison of SPH with Eulerian grid codes. Ascasibar et al. (2003) found good agreement between the same cluster simulated by both techniques. In particular an entropy core emerged in both realisations. However, as noted by Voit et al. (2005) the core entropy levels can differ by almost a factor of two. Also, Lin et al. (2006) point out that the resolution of the SPH simulations plays an important role. Yet, the resolution for the ensemble presented here is sufficient to exclude the pure artificial nature of the entropy cores. This statement is based in particular on the intermediate and low concentration systems. Here the radius of the core region is (assuming a virial radius of and a concentration of 5) which can not be a caused by a lag of spatial resolution. It follows that the mere existence of entropy cores does not imply non-adiabatic physics such as feedback and preheating.
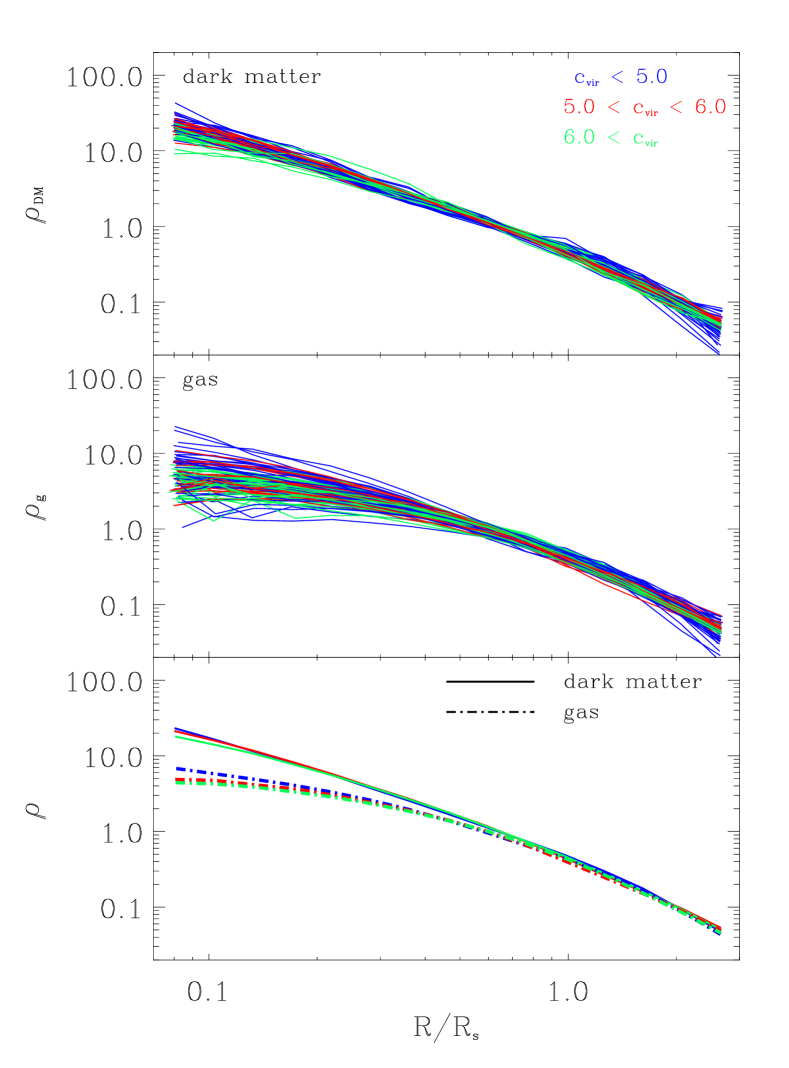
To improve our understanding of that phenomenon we undertake a more detailed investigation of entropy core. As we are interested in the self-similar properties of the clusters all further plots of radial profiles will be scaled by the NFW scale radius , rather than by . At the same time the density profiles are scaled by their mean densities within and the velocities are scaled by the circular velocity at , , where is the total mass within . That kind of scaling achieves a remarkable agreement among the dark matter density profiles, implying that the scatter of the gas density profiles, in particular at the centre, is a real physical effect (Figs. 4, 5 and 6).

To quantify the scatter in the density and velocity dispersion profiles we compute the rms value of , where indicates the values associated with the individual profiles and is their mean value within a particular bin. As shown in Fig. 6 the scatter of the DM density lies between and and a minimum is located near . The central scatter is but it declines with radius and converges to the DM scatter at . The scatter in is very similar to that of the DM density profile, ranging in between to to . The scatter in the thermal velocities of the gas ranges from at the centre to . It follows that there is a much larger variation among the different clusters in the gas density and temperature profiles than in the DM component.
To explore the dependence of the core structure on the dynamical state of the cluster the ensemble has been subdivided into three concentration bins. The three bins, namely , and comprise 39, 19 and 38 clusters, respectively. The intermediate bin should be considered as a kind of a buffer zone for the statistically more robust bins on the edges. The clusters with concentrations below 5 are assumed to be on average dynamically young systems whereas the clusters with concentrations above 6 are expected to be the most relaxed systems within the ensemble (see e.g. Wechsler et al. 2002).
Under the assumption that the ICM is in hydrostatic equilibrium the gas entropy excess within implies that the gas is hotter and/or the gas density profile is flatter than the DM. This is confirmed by the simulation. The radial structure of the DM and gas temperature is given in Fig. 4. The figure nicely illustrates the temperature inversion of the DM temperature profile and, in contrast, the gentle increase of the gas temperature towards the centre. Fig. 5 presents the DM and gas density profiles and it clearly shows the flattening of the inner gas density profile. The gas entropy core is established by the flattening of the NFW density cusp and the absence of the temperature inversion.

Next we focus on the impact of the concentration parameter on the entropy profiles. Fig. 7 shows the mean DM and gas thermal entropy profiles and their dependence on the value of . The DM is found to be independent of and the gas shows a very marginal dependence. A much stronger variation of the core entropy level and the core sizes with concentrations is seen if -scaled quantities are used (not shown here). In that context it is worth noting, that the mean density profiles for the different concentrations do match very well apart from the inner 0.3 where the lowest concentration profiles are slightly enhanced (Fig. 5). In contrast the mean temperature profiles of the gas (Fig. 4) show a slight dependence on concentrations, namely the gas temperature rises with concentration. This trend is not reflected in the behaviour of the DM velocity dispersion profiles and therefore it may be real and not caused by the scaling. Therefore, higher concentrated clusters have slightly higher gas temperatures. Now, rising temperatures at equal densities result in higher entropies for higher concentrated clusters as seen in Fig. 7. However, it can be questioned whether the scaling of the velocities by the circular velocity at () is the physically appropriate way of gauging the temperature profiles of different sized clusters.

The core radius seems to coincide with the radius at which the DM temperature reaches its maximal value, defined as . Thus it seems that the ’thermal’, namely velocity dispersion of the DM, properties of the DM either set, or otherwise are related to, the extent of the entropy core. Fig. 8 presents a scatter plot of the ratio versus . There is no significant dependence of on or on . Associating with the core radius we conclude that .
5 Discussion
The main findings of the paper are: The DM phase space density power law of Taylor & Navarro (2001) is reproduced by the simulated clusters extracted from an adiabatic gas dynamical simulation. The gas entropy profile is in accord with previous simulations (Voit et al., 2005). In particular the entropy profile has an inner flat core and an outer profile of is recovered. This stands in at least qualitative agreement with X-ray observations. The entropy core coincides with the region of the temperature inversion of the DM and its radius is characterised by . However, entropy loss due to radiative processes, which is not included in our simulations, alters the thermodynamics of the central ICM, see e.g. Kravtsov et al. (2005). Therefore, it is no contradiction to our findings that Piffaretti et al. (2005) don’t detect entropy cores within 13 nearby cooling flow clusters. The most important result of the paper is that outside the entropy core the gas and DM entropies follow one another very closely. Upon appropriate scaling of the gas and DM densities by their cosmological mean values we find that outside the entropy core a constant ration of prevails. By extending the definition of the gas entropy to include also the kinetic energy of the turbulent motion the above ratio becomes unity, and it follows that in the outer part of the cluster the gas and DM entropies coincide and are virtually the same.
The constant ratio of the gas to the DM entropies outside the entropy core has interesting observational ramifications. To the extent that non-adiabatic physics, in the sense described above, does not affect the gas structure outside the entropy core observations of the ICM can shed light on the DM in clusters. Observational determination of the entropy of the ICM can be easily translated into the entropy of the DM. Given the power law nature of the DM entropy, the observationally determined outer DM entropy can be extrapolated inwards. This, together with independent mapping of the mass distribution can yield interesting insight into the distribution and dynamics of DM in clusters of galaxies. In this context it is worth mentioning that Ikebe et al. (2004) described a formalism how the DM “temperature” can be derived from X-ray observations and applied this new technique to XMM-Newton data of A1795.
The analysis of § 4 shows that the entropy core radius, measured in units, is independent of the cluster NFW parameters. This seems to imply that the emergence of the entropy core is related to processes occurring within . The common understanding of halo formation is that the structure within is determined exclusively in the violent merger phases the cluster undergoes (Wechsler et al., 2002; Romano-Diaz et al., 2006). The quiescent accretion phases that follows the violent mergers do not alter the inner structure but leads to a continuous growth of virial radius. This suggests that the entropy core emerges as a result of processes occurring during the violent phases, in which the cluster is not in NFW equilibrium. Another alternative is that the gas component, unlike the DM, undergoes some secular evolution of the inner region in the quiescent phases. It might also be the case that both processes play an important role. In any case it is clear that only shock waves can form the entropy core and the understanding of the shock pattern is critical here.
N-body simulations show that clusters have experienced merging events in their past. The merging events of comparable sized substructures are violent enough to send bow shocks into the intra-substructure gas which subsequently propagate to the outskirts of the clusters (Nagai & Kravtsov, 2003). This shocks raise the entropy of the gas. Pfrommer et al. (2006) develop a formalism for the identification and accurate estimation of the strength of structure formation shocks during cosmological SPH simulations. They find that most of the energy is dissipated in weak internal shocks with Mach numbers which are predominantly central flow shocks or merger shock waves traversing halo centres. The study by Navarro et al. (1995) utilises cosmological simulations to compare the evolution of DM and gas of clusters between and . They find that the DM evolves at roughly constant phase space density, whereas shocks increase the temperature of the gas with relatively little change in density. Ascasibar et al. (2004) investigating pure N-body simulations report the remarkable stability of the phase space density profile of the DM independent of the dynamical state. Pearce et al. (1994) explore simple head-on mergers between model galaxy clusters containing a mixture of gas and dark matter, testing the coupling of the gas to the underlying collisionless material. After the first passage of the dark matter cores the gas forms a pancake-like structure about the centre of mass. While separating for a second time dark matter cores leave their gas behind. The central gas is no longer confined to a deep potential well so it expands. This process has been nicely confirmed by the recent observations of Clowe et al. (2006). They find an obvious displacement of the gas measured by X-ray observations compared to the potential revealed by weak lensing maps of the merging cluster system 1E 0657-558. At the same time gravitational attraction due to the central gas exerts a drag force on the separating DM cluster cores, causing an energy transfer from the DM to the gas (see also Navarro & White 1993). This is in agreement with recent investigations by Lin et al. (2006) reporting a per cent increase in the concentration of the cluster’s DM component when adiabatic gas physics is included as compared to pure DM simulations. The core structure of the gas entropy, in contrast to the power-law profile of the DM, may therefore be established during merging events in consequence of the impenetrability of the gas as opposed to the collisionless nature of the DM.
A different point of view might be provided by the following speculations. The DM ’temperature’ profile is characterised by a temperature inversion. Now, a ’normal’ thermodynamic system with a mechanism for heat transport and no energy sinks or sources cannot sustain such a structure. Heat would flow inwards, leading to an increase of the entropy where the temperature inversion prevails. The increase in entropy amounts to an increase in temperature, and thereby decrease in density so as to keep the hydrostatic equilibrium. Now, let us conjecture that the collapse of the gas and DM results in a configuration where the gas follows the DM distribution. (This is supported by the self-similar solutions of Bertschinger 1985 and Chuzhoy & Nusser 2000). If the gas had a mechanism of transporting energy it would behave in the manner described above, namely the entropy will increase where the initial temperature inversion initially existed. Inspection of Fig. 1 proves that this might have actually happened. The gas entropy departs from the DM and an entropy core replaces the temperature inversion. This is clearly manifested by the most relaxed cluster of Fig. 1, and is seen in other relaxed clusters (not shown here). So, what can provide the heat transport mechanism? Fig. 1 shows that outside the entropy core about per cent of the non-gravitational energy is in the form of kinetic energy. Only a small fraction of this energy is in large scale bulk motion and therefore most of it is in small scale motion, namely turbulence. The dissipation of these motions by weak shocks is expected to be efficient at the centre and this would lead to the increase in the gas entropy. In the language of one dimensional spherically symmetric hydrodynamics one would attribute this phenomenon to turbulent viscosity and heat transport. This transport mechanism erases the temperature inversion and produces the entropy core.
The application of the concept of maximum entropy as a mean of calculating the equilibrium configuration of self gravitating systems has proven somewhat futile (e.g. Lynden-Bell 1967; Lynden-Bell & Wood 1968; White & Narayan 1987; Lima Neto et al. 1999). In particular, these attempts have not predicted the NFW density profile that faithfully reproduces the structure of DM halos. The problem that lies at the root of the shortcoming of the thermodynamic approach is the long range nature of the gravitational force and the resulting negative specific energy (see e.g. Lynden-Bell & Wood 1968). In spite of all that our results show that the concept of the DM entropy is closely related to the structure of DM halos. Moreover, the DM entropy is very closely related to the gas entropy. Beyond the entropy core of the gas the entropies of the two components are tracing one another. In fact, the extended gas entropy fully coincides with the DM entropy in that regime. It follows that the observed power law behaviour of the gas entropy provides an indirect support for the NFW structure of the DM. Now, this opens the door for a fundamental question. The gas entropy results from the conversion of gravitational to kinetic energy and by the dissipation of the kinetic energy into internal one by means of shock waves. The power law regime seems to be dominated by the accretion shock that is predicted by self-similar solutions (Bertschinger, 1985; Chuzhoy & Nusser, 2000). In the DM sector the gravitational energy is converted to random motions by means of phase mixing and the time variation of the gravitational potential. The latter process happens by violent relaxation, whereby the gravitational potential changes rapidly, or by means of adiabatic changes as envisaged in the secondary infall model (Gunn, 1977; Fillmore & Goldreich, 1984; Bertschinger, 1985; Hoffman & Shaham, 1985). The physical processes that shape the entropy profile in the gas and the DM appear to be very different, yet the resulting structure seems to be identical. This phenomenological finding needs to be further investigated.
Additional studies of the adiabatic formation of clusters of galaxies are needed to deepen our understanding of the role of entropy in the formation and evolution of clusters of galaxies. In particular, high resolution gas dynamical simulations need to be analysed with a special emphasise on the role of strong, large scale, shocks and of weak, small scale, ones. The relevance of these to the emergence of the entropy core needs to be further clarified. Finally, the simulations should be expanded so as to include preheating, radiative cooling and feedback processes.
Acknowledgements
Useful discussions with Y. Ascasibar, M. Hoeft, A. Klypin, A. Kravtsov and W. Mathews are highly appreciated. We are grateful to Hans Böhringer for the very constructive referee report. This research has been supported by NSF grant AST 00-98351 and NASA grant NAG5-13275 (to AF) and by ISF-143/02 and the Sheinborn Foundation (to YH). AF acknowledges the hospitality of the Hebrew University. YH acknowledges DFG for a Mercator Gastprofessur at Potsdam University. GY thanks M.E.C (Spain) for financial support under projects AYA-2003-07468 and BFM2003-01266. GY and SG thanks the Acciones Integradas Hispano-Alemanas for support. We would like to thank the Barcelona Supercomputer Center for allowing us to perform this simulation during the testing period of the MareNostrum supercomputer. The simulation has been analysed at NIC Juelich.
References
- Ascasibar et al. (2004) Ascasibar Y., Yepes G., Gottlöber S., Müller V., 2004, MNRAS, 352, 1109
- Ascasibar et al. (2003) Ascasibar Y., Yepes G., Müller V., Gottlöber S., 2003, MNRAS, 346, 731
- Bertschinger (1985) Bertschinger E., 1985, ApJS, 58, 39
- Borgani et al. (2005) Borgani S., Finoguenov A., Kay S. T., Ponman T. J., Springel V., Tozzi P., Voit G. M., 2005, MNRAS, 361, 233
- Chuzhoy & Nusser (2000) Chuzhoy L., Nusser A., 2000, MNRAS, 319, 797
- Clowe et al. (2006) Clowe D., Bradač M., Gonzalez A. H., Markevitch M., Randall S. W., Jones C., Zaritsky D., 2006, ApJ, 648, L109
- Donahue et al. (2006) Donahue M., Horner D. J., Cavagnolo K. W., Voit G. M., 2006, ApJ, 643, 730
- Eke et al. (1998) Eke V. R., Navarro J. F., Frenk C. S., 1998, ApJ, 503, 569
- Fillmore & Goldreich (1984) Fillmore J. A., Goldreich P., 1984, ApJ, 281, 1
- Finoguenov et al. (2003) Finoguenov A., Borgani S., Tornatore L., Böhringer H., 2003, A&A, 398, L35
- Gottlöber et al. (2006) Gottlöber S., Yepes G., Wagner C., Sevilla R., 2006, in Tresse L., Maurogordato S., Tran Than Van J., eds, XLIst Rencontres de Moriond, XXVIth Astrophysics Moriond Meeting: From Dark Halos to Light The Marenostrum Universe
- Gunn (1977) Gunn J. E., 1977, ApJ, 218, 592
- Hoffman & Shaham (1985) Hoffman Y., Shaham J., 1985, ApJ, 297, 16
- Ikebe et al. (2004) Ikebe Y., Böhringer H., Kitayama T., 2004, ApJ, 611, 175
- Kravtsov et al. (2005) Kravtsov A. V., Nagai D., Vikhlinin A. A., 2005, ApJ, 625, 588
- Lima Neto et al. (1999) Lima Neto G. B., Gerbal D., Márquez I., 1999, MNRAS, 309, 481
- Lin et al. (2006) Lin W. P., Jing Y. P., Mao S., Gao L., McCarthy I. G., 2006, ApJ, 651, 636
- Lynden-Bell (1967) Lynden-Bell D., 1967, MNRAS, 136, 101
- Lynden-Bell & Wood (1968) Lynden-Bell D., Wood R., 1968, MNRAS, 138, 495
- Nagai & Kravtsov (2003) Nagai D., Kravtsov A. V., 2003, ApJ, 587, 514
- Navarro et al. (1995) Navarro J. F., Frenk C. S., White S. D. M., 1995, MNRAS, 275, 720
- Navarro et al. (1997) Navarro J. F., Frenk C. S., White S. D. M., 1997, ApJ, 490, 493
- Navarro & White (1993) Navarro J. F., White S. D. M., 1993, MNRAS, 265, 271
- Pearce et al. (1994) Pearce F. R., Thomas P. A., Couchman H. M. P., 1994, MNRAS, 268, 953
- Pfrommer et al. (2006) Pfrommer C., Springel V., Enßlin T. A., Jubelgas M., 2006, MNRAS, 367, 113
- Piffaretti et al. (2005) Piffaretti R., Jetzer P., Kaastra J. S., Tamura T., 2005, A&A, 433, 101
- Pratt et al. (2006) Pratt G. W., Arnaud M., Pointecouteau E., 2006, A&A, 446, 429
- Pratt et al. (2007) Pratt G. W., Böhringer H., Croston J. H., Arnaud M., Borgani S., Finoguenov A., Temple R. F., 2007, A&A, 461, 71
- Romano-Diaz et al. (2006) Romano-Diaz E., Faltenbacher A., Jones D., Heller C., Hoffman Y., Shlosman I., 2006, ApJ, 637, L93
- Springel (2005) Springel V., 2005, MNRAS, 364, 1105
- Taylor & Navarro (2001) Taylor J. E., Navarro J. F., 2001, ApJ, 563, 483
- Voit (2005) Voit G. M., 2005, Reviews of Modern Physics, 77, 207
- Voit et al. (2005) Voit G. M., Kay S. T., Bryan G. L., 2005, MNRAS, 364, 909
- Wechsler et al. (2002) Wechsler R. H., Bullock J. S., Primack J. R., Kravtsov A. V., Dekel A., 2002, ApJ, 568, 52
- White & Narayan (1987) White S. D. M., Narayan R., 1987, MNRAS, 229, 103