The Deuterium to Hydrogen Abundance Ratio Towards the QSO SDSS1558-003111affiliation: This paper includes data gathered with the 6.5 meter Magellan Telescopes located at Las Campanas Observatory, Chile.
Abstract
We present a measurement of the D/H abundance ratio in a metal-poor damped Ly (DLA) system along the sightline of QSO SDSS1558-0031. The DLA system is at redshift , has a neutral column density of cm-2, and a gas-phase metallicity [O/H] which indicates that deuterium astration is negligible. Deuterium absorption is observed in multiple Lyman series with a column density of cm-2, best constrained by the deuterium Lyman-11 line. We measure , which when combined with previous measurements along QSO sightlines gives a best estimate of where the 1 error estimate comes from a jackknife analysis of the weighted means. Using the framework of standard big bang nucleosynthesis, this value of D/H translates into a baryon density of , where the error terms represent the errors from D/H and the uncertainties in the nuclear reaction rates respectively. Combining our new measurement with previous measurements of D/H, we no longer find compelling evidence for a trend of D/H with .
1 INTRODUCTION
For the last decade, measurements of the primordial D/H ratio in QSO sightlines have provided increasingly more precise constraints on the cosmological baryon density. Although the measurement of D/H is simple in principle, compared to the other light elements produced during big bang nucleosynthesis, finding those QSO absorption lines systems which are suitable for measuring D/H has proven observationally challenging (Tytler et al., 2000).
For a QSO absorption system to show D/H, a number of criteria must be met (see Kirkman et al. (2003), hereafter K03, for a more detailed discussion). First, the hydrogen column density must be large enough (since D/H is of the order of one part in ) such that deuterium can be observed using modern high-resolution spectrographs. Second, the velocity structure of the hydrogen absorption must be simple enough, ideally a single component of gas, so that the deuterium absorption is well resolved given the small 82 km s-1 offset from the hydrogen Lyman lines. Third, there can be little to no interloping Ly forest or metal lines at the position of the deuterium absorption, since such absorption strongly complicates attempts to constrain the deuterium column density. Unfortunately, Ly forest absorption is both ubiquitous and stochastic in high redshift QSO spectra. Finally, the background QSO must be bright enough to obtain high signal-to-noise, high-resolution spectroscopy at Å with a reasonable allotment of telescope time. Each one of these criteria act to decrease the probability that a D/H measurement can be made towards any given QSO, and since all the criteria must be met, the resultant probability of a QSO sightline being suitable for measuring D/H is very low, with only approximately 1% of QSOs at able to provide a measurement of D/H.
To date, there are few measurements of D/H in QSO spectra (Burles & Tytler (1998),Burles & Tytler (1998), O’Meara et al. (2001), Pettini & Bowen (2001), K03, Levshakov et al. (2002), Crighton et al. (2004)). These measurements constrain the baryon density through the framework of standard big bang nucleosynthesis (SBBN), which predicts the abundances of the light elements as a function of the baryon–to–photon ratio and the expansion rate of the universe (Kolb & Turner, 1990), and through the cosmic microwave background radiation, which provides the photon density. A measurement of the ratio of any of the light nuclei produced in SBBN gives the baryon density, and measurement of additional abundance ratios test the theory (see Steigman (2006), Pettini (2006), and references therein for a current census of D/H and the other light element abundances).
Recent measurements of the temperature angular power spectrum of the CMB (Spergel et al. 2006) also provide a measurement of depending on the assumptions made, with a level of accuracy roughly equal to or greater than that provided by D/H. Nevertheless, measurements of D/H are still important for a number of reasons. First, primordial D/H probes the universe at one of the earliest times in the universe accessible with current observational and theoretical techniques. Second, the light element abundances predicted from SBBN do not all agree with each other; most notably the observationally inferred abundance of 7Li is significantly lower than that expected from SBBN and D/H (Fields & Sarkar, 2006). Third, D/H can help constrain deviations from SBBN, such as inhomogeneous BBN (e.g. Lara, Kajino & Mathews, 2006), relic primordial particle decays (e.g. Jedamzik, 2004), or non-standard neutrino physics (Abazajian et al., 2005, e.g.). Fourth, the dispersion in the measurements of D/H is larger than would be expected from the individual measurement errors (K03), i.e., the data demand both a better understanding of the errors on the current measurements and new constraints. Fifth, the value of derived from D/H and SBBN requires many fewer priors than the CMB derived value. Moreover, the from D/H can be used in principle as a prior in the CMB analysis, and the ratio of the values for from D/H and the CMB offer a precision test of the hot Big Bang model. Finally, the existing measurements of D/H show evidence of a trend of decreasing D/H with increasing . K03 suggested that this trend (and the dispersion in D/H values) is due to error under-estimation.
Fortunately, the Sloan Digital Sky Survey (SDSS, Adelman-McCarthy et al., 2006), by virtue of its large sample of high redshift QSO spectra (the Data Release 4 alone contains 5036 QSOs with ) gives us a new data set to find those special sightlines which can show D/H. In this Letter, we present a new measurement of D/H in a QSO sightline from the SDSS, SDSS1558-0031, which was chosen as part of our high-resolution survey for Lyman limit absorption (O’Meara et al., 2006).
2 OBSERVATIONS
We have obtained two high-resolution spectra of the quasar SDSS1558-0031 using two different spectrographs, the MIKE (Bernstein et al., 2003) echelle spectrograph on the 6.5 meter Magellan Clay telescope at Las Campanas, and the upgraded HIRES (Vogt et al., 1994) spectrometer on the 10 meter Keck-I telescope on Mauna Kea. The MIKE spectrum was obtained as part of our ongoing high-resolution survey for Lyman Limit absorption and was selected from the SDSS because of the redshift and brightness of the QSO. The MIKE spectrum was obtained on May 10, 2004 and covers the spectral range 3221–7420 Å, with an exposure time of 3600 seconds. The data were obtained in sub-arcsecond seeing with a one arcsecond slit, which provides a resolution of and on the blue and red arms of the spectrograph respectively. The MIKE data was reduced using the MIKE reduction pipeline111http://web.mit.edu/burles/www/MIKE/, and has a signal to noise ratio of approximately 12 at Å.
The HIRES spectrum was taken on 2006 April 11 and covers the spectral range 3338–6200 Å, with an exposure time of 4100 seconds. The data were taken in sub-arcsecond seeing with a 1.148 arcsecond slit, which provides a resolution of . The data were reduced using the HIRES reduction pipeline222http://www.ucolick.org/xavier/HIRedux/index.html, and have a signal to noise ratio of approximately 20 at Å. The HIRES data are the primary source for the measurement of D/H presented below owing to the higher signal-to-noise and spectral resolution. With the exception of the H I Ly line, we used the HIRES spectrum to determine all values for column densities presented in the text. Because we were more successful at fluxing data from the MIKE spectrometer, we use the flux calibrated MIKE spectrum to constrain the value in the Ly line whose profile spans several echelle orders.
3 Analysis
Inspection of the MIKE spectrum of SDSS1558-0031 shows that there is a DLA at which is also responsible for the break in flux from the Lyman limit of the absorber at Å. The parameters which describe the observed, single component of absorption (,,) for the Lyman series and metal-lines in the DLA are presented in Table 1. The parameters and their errors are derived predominately from Voigt profile fits to the data using the VPFIT routine kindly provided by R. Carswell and J. Webb. For some of the metal-line transitions, we opt instead to use the apparent optical depth technique (Savage & Sembach, 1991) to measure the column densities, and then use that column density as a fixed input parameter to VPFIT to determine the and values for the absorption in question. The absence of metal-line absorption at the position of D aruges that the observed feature in the Lyman series is not interploping H.
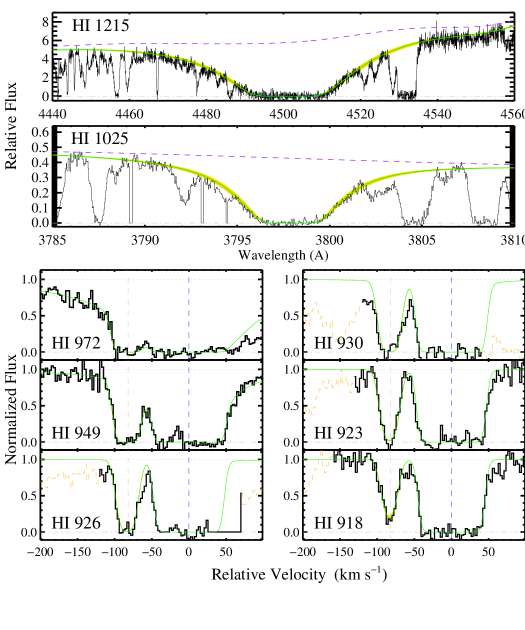
The hydrogen column density of the DLA is sufficiently large to show damping wings in the Lyman – transitions (Figure 1). These features allow for a precise measurement of the H I column density. In the case of SDSS1558-0031 the DLA Ly lies near the QSO emission line and the assignment of the continuum level over the full extent of the absorption feature is non-trivial. Fortunately, this issue is minimized in two ways. First, the MIKE spectrum is flux calibrated, which allows for an easier assignment of the continuum level to the Ly line, although it is still subject to unidentified emission features inherent to the QSO. Second, the H I derived from the damping features in the higher order lines is less susceptible to large continuum shape errors, because the profile spans a significantly smaller wavelength range than the Ly line. In particular, the Ly line of the DLA places an excellent constraint on the H I column density, because the line has prominent damping features, covers only Å, and has little interloping hydrogen absorption.
To arrive at the best estimate of we simultaneously vary the values of along with the shape and amplitude of the local continuum level. This variation continues until we arrive at a value of the which best reproduces the data whilst having a reasonable continuum shape. We adopt a redshift and velocity width of the H I, and , from a fit to the the higher order Lyman series transitions. Of some concern is the fact that the redshift of the H I agrees only at the km s-1 level with the redshift inferred from low-ion metal-lines (Table 1). We note, however, that there exists some degeneracy between the for the Lyman series transitions we use, along with the increasing effects of poor signal-to-noise for shorter wavelength data (i.e. higher up the Lyman series). Furthermore, we cannot discount the possibility that the H I gas is multi-component, however there is little evidence from the metal-line transitions that this is the case. Furthermore the Lyman series lines all appear to be well fit using a single component, with a few departures due to interloping H I gas at different redshifts from the system which shows deuterium. When we consider the Lyman – transitions, we arrive at a best estimate of the H I of cm-2. The errors on are dominated by continuum uncertainties and by signal-to-noise, two effects which correlate, particularly on smaller wavelength scales.
As can be seen in Figure 1, we observe resolved absorption by deuterium in the Lyman series from Ly all the way through to Lyman-13. Because the D I column density is large, the absorption is saturated until we reach deuterium Lyman-11, which offers the best constraint on the value. For this transition, we measure cm-2, where the errors come from the error estimate of VPFIT alone (i.e. independent of continuum error). The transition suffers from mild contamination by interloping hydrogen on km s-1 to the red side of the absorption profile, but this absorption has little effect on the value. Fits to the data including and excluding a model for the interloping hydrogen improve the for the fit without changing the value or uncertainty in the value. We have also estimated using the AODM technique, and arrive at a consistent value cm-2. The optical depth of this absorption feature is ideal for measuring a column density because it is highly insensitive to the local continuum level placement. If we vary the amplitude of the continuum level by as much as 20% about the adopted value the central value, of changes by less than the statistical error. The value is further constrained by other Lyman series lines, e.g. the depth of the deuterium Lyman–8 transition rules out significantly larger or smaller values of .
We obtain a value of for the deuterium absorption, consistent with that of the H I and other metals. We measure a velocity width of km s-1 for the deuterium absorption. Neutral hydrogen gas with cm-2 is not expected to have such a narrow Doppler parameter (Kirkman & Tytler, 1997) whereas the value is reasonable for D.
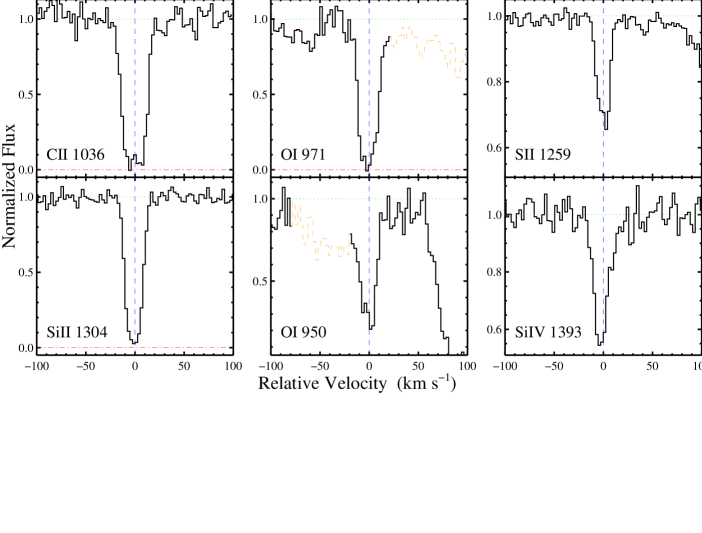
We detect over 30 metal-line transitions in the DLA absorber. A subset of these are summarized in Table 1 and are shown in Figure 2. In particular, we note the presence of O I absorption at , which is well described by a single component. O I absorption is important for measuring D/H in that O I directly traces the H I gas (see O’Meara et al., 2001), and because O I/H I O/H in most environments (especially DLA). Adopting the measured value of , we establish a metallicity of [O/H] for the absorber assuming the solar (atmospheric) oxygen abundance reported by Grevesse, Asplund & Sauval (2005). This metallicity is higher than all the other extragalactic measurements of D/H. Nevertheless, a 3% solar metallicity implies minimal astration of D and we believe this system is still representative of primordial gas (see Figure 20 of K03 and Romano et al. (2006)). Finally, we note that the velocity structure of the absorber, as traced by the metal lines, is amongst the simplest yet observed for a DLA (Prochaska & Wolfe, 2001).
4 Discussion
We now discuss the value of D/H we obtain for the absorber and place it within the context of the combined D/H ratio for all QSO absorption systems. The best estimates of the H I and D I column densities in the DLA towards SDSS1558-0031 imply a value of . The errors on D/H stem primarily from the effect of continuum placement uncertainty on the H I column density, and the signal-to-noise ratio of the data at Lyman-11 where the D I column density is best constrained.
Turning now to the combined D/H value from QSO sightlines, Figure 3 shows the new value of D/H from SDSS1558-0031 along with the previous values of D/H taken from the sample discussed in K03. We do not include the result of Crighton et al. (2004), since we feel that the errors on D/H in this system have been under-estimated, particularly for the reported value. We do not include the results of Levshakov et al. (2002) for the reasons given in K03. The horizontal solid line shows the value for the weighted mean of the data , which we round to to keep consistent with the literature, and the dashed lines show the uncertainties estimated from a jackknife analysis of the weighted means. In the case of asymmetric errors on individual D/H measurements, we have adopted the larger of the errors for the calculation of the weighting.
Prior to the addition of SDSS1558-0031 to the sample of D/H measurements of K03, a –minimizing linear fit to the data of the form provided an acceptable fit to the data (). With the inclusion of SDSS1558-0031, however, we see a significant decrease in the likelihood that there is a D/H trend with . Although the data are best fit with a non–zero slope, , the slope differs from zero at only the level (even before accounting for the presence of in both axes). Furthermore, this is not a good model of the data, with . As such, the data give little confidence to the existence of a trend of D/H with . Finally, if we were to include the Crighton et al. (2004) and Levshakov et al. (2002) results, the likelihood that D/H depends on is further diminished.
The presumption of a single value for D/H, however, is still not supported by the observations; the observed scatter exceeds that expected assuming the error estimates reported in the literature. Our adopted error on the best estimate for D/H from the jackknife estimation exceeds the error on the weighted mean by a factor of two. Likewise, the of the six measurements of D/H about the weighted mean value of is high, with . Although there is the possibility that the scatter in the individual D/H measurements is real, we prefer the hypothesis of K03 that the errors in some of the individual measurements, if not all of them, are underestimated. It is likely that a combination of new methods of error analysis and new QSO sightlines is required to fully address the excess scatter in the D/H measurements.
Using the framework from SBBN (Burles, Nollett & Turner, 2001), the value for D/H of translates to a value for the cosmological baryon density of , where the first error term comes from the errors on D/H explained above, and the second term from the uncertainties in the nuclear reaction rates. By comparison, the WMAP three year result provides an estimate of , which lies within the error estimate on from D/H (Spergel et al. 2006).
Finally, we note that the absorber showing D/H in the spectrum of SDSS1558-0031 was discovered serendipitously as part of our survey for Lyman limit absorption, and is the first D/H measurement from a QSO first discovered by the SDSS. The SDSS Data Release 3 alone has 405 DLA with redshifts optimal for D/H ( Prochaska, Herbert-Fort & Wolfe, 2005), Assuming a small fraction of these DLA provide measurements of D/H, the SDSS will give many tens of measurements. The situation improves further if one considers the Lyman limit systems toward the SDSS QSO sample. This contrasts with the SLLS and DLA which give the from the Ly and Ly lines, and the from the unsaturated D I lines in the Lyman series. Because of this effect, the DLA and SLLS offer more pathlength per QSO to potentially find D/H. All of these effects combine to give a likely distribution of D/H measurements which is roughly independent of , a hypothesis which is already being hinted at in the current sample, since two measurements come from LLS, two from SLLS, and two from DLA. Altogether, the SDSS offers the best opportunity for investigating the larger than expected scatter in D/H and correlations with , metallicity, etc.
References
- Abazajian et al. (2005) Abazajian, K. et al. 2005, Phys. Rev. D, 72(6), 063004.
- Adelman-McCarthy et al. (2006) Adelman-McCarthy, J. K. et al. 2006, ApJS, 162, 38.
- Bernstein et al. (2003) Bernstein, R. et al. 2003, in Instrument Design and Performance for Optical/Infrared Ground-based Telescopes. Edited by Iye, Masanori; Moorwood, Alan F. M. Proceedings of the SPIE, Volume 4841, pp. 1694-1704 (2003)., 1694.
- Burles, Nollett & Turner (2001) Burles, S., Nollett, K. M., and Turner, M. S. 2001, Phys. Rev. D, 63(6), 063512.
- Burles & Tytler (1998) Burles, S. and Tytler, D. 1998a, ApJ, 499, 699.
- Burles & Tytler (1998) Burles, S. and Tytler, D. 1998b, ApJ, 507, 732.
- Crighton et al. (2004) Crighton, N. H. M. et al. 2004, MNRAS, 355, 1042.
- Fields & Sarkar (2006) Fields, B. and Sarkar, S. 2006, ArXiv Astrophysics e-prints.
- Grevesse, Asplund & Sauval (2005) Grevesse, N., Asplund, M., and Sauval, A. J. 2005, in EAS Publications Series, ed. G. Alecian, O. Richard, and S. Vauclair, 21.
- Jedamzik (2004) Jedamzik, K. 2004, Phys. Rev. D, 70(6), 063524.
- Kirkman & Tytler (1997) Kirkman, D. and Tytler, D. 1997, ApJ, 484, 672.
- Kirkman et al. (2003) Kirkman, D. et al. 2003, ApJS, 149, 1.
- Kolb & Turner (1990) Kolb, E. W. and Turner, M. S. 1990, The early universe, : Frontiers in Physics, Reading, MA: Addison-Wesley, 1988, 1990).
- Lara, Kajino & Mathews (2006) Lara, J. F., Kajino, T., and Mathews, G. J. 2006, Phys. Rev. D, 73(8), 083501.
- Levshakov et al. (2002) Levshakov, S. A. et al. 2002, ApJ, 565, 696.
- O’Meara et al. (2006) O’Meara, J. et al. 2006, ApJ, 622, Submitted.
- O’Meara et al. (2001) O’Meara, J. M. et al. 2001, ApJ, 552, 718.
- Pettini (2006) Pettini, M. 2006, in Astrophysics in the Far Ultraviolet, ed. G. Sonneborn, H. W. Moos, and B-G. Andersson.
- Pettini & Bowen (2001) Pettini, M. and Bowen, D. V. 2001, ApJ, 560, 41.
- Prochaska, Herbert-Fort & Wolfe (2005) Prochaska, J. X., Herbert-Fort, S., and Wolfe, A. M. 2005, ApJ, 635, 123.
- Prochaska & Wolfe (2001) Prochaska, J. X. and Wolfe, A. M. 2001, ApJ, 560, L33.
- Romano et al. (2006) Romano, D., Tosi, M., Chiappini, C., and Matteucci, F. 2006, MNRAS, 369, 295.
- Savage & Sembach (1991) Savage, B. D. and Sembach, K. R. 1991, ApJ, 379, 245.
- Steigman (2006) Steigman, G. 2006, International Journal of Modern Physics E, 15, 1.
- Tytler et al. (2000) Tytler, D. et al. 2000, Phys. Rep., 333, 409.
- Vogt et al. (1994) Vogt, S. S. et al. 1994, in Proc. SPIE Instrumentation in Astronomy VIII, David L. Crawford; Eric R. Craine; Eds., Volume 2198, p. 362, 362.
| Ion | log NaaUnless stated otherwise, the errors on the column density are from VPFIT alone. | [X/H]bb[X/H] log(X/HI) - log(X/H)⊙ where we have considered only low-ion transitions and have not adopted ionization or depletion corrections. | Transition | ||
|---|---|---|---|---|---|
| cm-2 | km s-1 | Å | |||
| H I | — | 1215.67, 1025.72, 972.54, 949.74 | |||
| D I | — | 917.88 | |||
| C II | 1334.53, 1036.34 | ||||
| C III | — | — | 977.02 | ||
| C IV | — | 1548.20 | |||
| N I | -2.18 | 1134.41, 1134.17 | |||
| N II | — | 1083.99 | |||
| O I | -1.49 | 971.74, 950.88 | |||
| Al II | -2.43 | 1670.79 | |||
| Si II | -1.99 | 1526.71, 1304.37 | |||
| Si III | — | — | 1206.50 | ||
| Si IV | — | 1393.76 | |||
| S II | -1.74 | 1259.52 | |||
| Fe II | -2.06 | 1608.45, 1144.94 |