The Nature of Infrared Emission in the Local Group Dwarf Galaxy NGC 6822 As Revealed by Spitzer
Abstract
We present Spitzer imaging of the metal-deficient (Z 30% Z⊙) Local Group dwarf galaxy NGC 6822. On spatial scales of 130 pc, we study the nature of IR, H, H i, and radio continuum emission. Nebular emission strength correlates with IR surface brightness; however, roughly half of the IR emission is associated with diffuse regions not luminous at H (as found in previous studies). The global ratio of dust to H i gas in the ISM, while uncertain at the factor of 2 level, is 25 times lower than the global values derived for spiral galaxies using similar modeling techniques; localized ratios of dust to H i gas are about a factor of five higher than the global value in NGC 6822. There are strong variations (factors of 10) in the relative ratios of H and IR flux throughout the central disk; the low dust content of NGC 6822 is likely responsible for the different H/IR ratios compared to those found in more metal-rich environments. The H and IR emission is associated with high-column density (1021 cm-2) neutral gas. Increases in IR surface brightness appear to be affected by both increased radiation field strength and increased local gas density. Individual regions and the galaxy as a whole fall within the observed scatter of recent high-resolution studies of the radio-far IR correlation in nearby spiral galaxies; this is likely the result of depleted radio and far-IR emission strengths in the ISM of this dwarf galaxy.
Subject headings:
galaxies: dwarf — galaxies: irregular — galaxies: ISM — galaxies: individual (NGC 6822) — infrared: galaxies1. Introduction
Nearby dwarf galaxies provide a unique opportunity to resolve the interaction of the multiple phases of the interstellar medium (ISM). Star formation in these systems is more susceptible to small-scale processes (e.g., turbulence, feedback) than to the galaxy-wide perturbations (i.e., spiral density waves) that are common in more massive galaxies. With their typically low nebular metallicities, star-forming dwarf galaxies serve as fiducial examples for comparison with the high-redshift star-forming systems predicted in the cold dark matter paradigm (e.g., Babul & Ferguson, 1996; Ellis, 1997; Mateo, 1998).
The detailed processes of heating and cooling of the ISM are fundamental to our understanding of the nature of galaxy evolution. An environmentally-dependent fraction of UV photons produced by massive stars will be absorbed by dust and gas and re-radiated in the far-infrared (FIR) or in nebular emission lines. This fraction will depend on various factors, including the local dust-to-gas ratio (related to the metallicity and hence the dust content) and the porosity of the local ISM. In cases where the dust and stars are well mixed, and where the extinction is moderate, there will exist a correlation between the fluxes in various wavelength bands, including the ultraviolet (UV), H, FIR, and radio continuum. Nearby dwarf galaxies offer a unique opportunity to study one of the regimes where these correlations may begin to break down.
NGC 6822 is a Local Group (D 490 40 kpc; Mateo 1998) dwarf irregular galaxy with a nebular abundance Z 30% Z⊙ (Skillman et al., 1989; Lee et al., 2006a). The total optical luminosity is 9.4 107 L⊙ (Mateo, 1998), while the total H i mass is 1.34 108 M⊙ (see detailed discussion in § 2.2 and de Blok & Walter 2006). The system contains distributed low-level star formation throughout the disk as well as actively star-forming regions with associated H emission which were first studied by Hubble (1925). The star formation has been quiescent over the past few Gyr, without major peaks or dips in the absolute rate (Wyder, 2001, 2003). de Blok & Walter (2006) derive a total H flux of 2 1039 erg s-1, corresponding to a global H-based star formation rate (SFR) of 0.015 M⊙ yr-1 using the calibration of Kennicutt (1998).
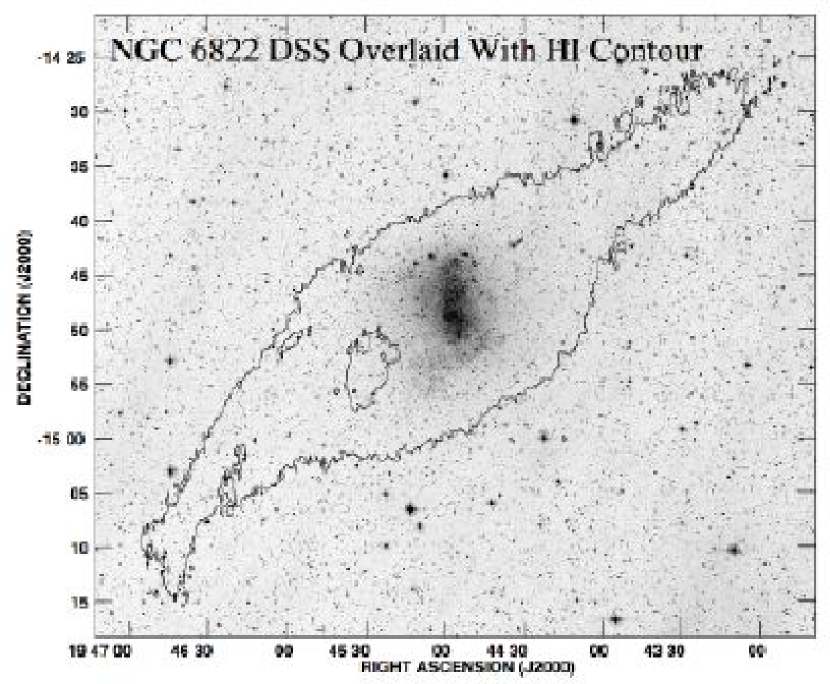
NGC 6822 boasts an unusual H i distribution; in the extended H i disk (see Figure 1) lies one of the largest known holes in the ISM of a dwarf galaxy, first discussed by de Blok & Walter (2000). de Blok & Walter (2006) argue that this hole is likely caused by the combined effects of stellar evolution. That study also reveals the presence of a significant blue star population in the outer H i disk, and a lower surface brightness, spheroidal red stellar population extending beyond the H i distribution. The extended H i disk may include a dwarf companion galaxy in the northwest region (note that interactions with this system may have played a part in triggering some of the recent star formation in the galaxy; see de Blok & Walter 2000). The well-sampled rotation curve shows that the system is highly dark-matter dominated (Weldrake et al., 2003). The proximity of NGC 6822 means that it is one of only a few places where the small-scale (100 pc) structure of the ISM can be studied at multiple wavelengths.
Previous infrared studies of NGC 6822 have examined the heating and cooling mechanisms in the ISM. Using InfraRed Astronomical Satellite (IRAS) data, Gallagher et al. (1991) found a variable H/FIR ratio within the disk, with roughly 50% of the FIR emission arising from regions that are luminous at H. The remaining fraction of diffuse IR flux was attributed to a low optical depth (i.e., low dust content) in the ISM. Thus, regions of strong IR emission correspond to comparatively dusty regions that also contain a younger stellar population. A second IRAS study by Israel et al. (1996) found that three of the bright IR peaks were associated with luminous H ii regions, while two equally bright sources were unassociated with obvious sources of ionizing radiation. These authors confirm the prominent diffuse dust continuum emission found by Gallagher et al. (1991). Further, they find, using single-temperature blackbody fits to the far-IR data, a dust-to-gas ratio (1.4 10-4) that is much lower than typical values seen in more metal-rich systems such as the Milky Way (average dust-to-gas ratios of 0.006–0.01; Sodroski et al. [1997], Li [2004]). NGC 6822 was observed with the Infrared Satellite Observatory at 6.75 and 15 m, but only the most luminous H ii regions were detected (Dale et al., 2000; Hunter et al., 2001).
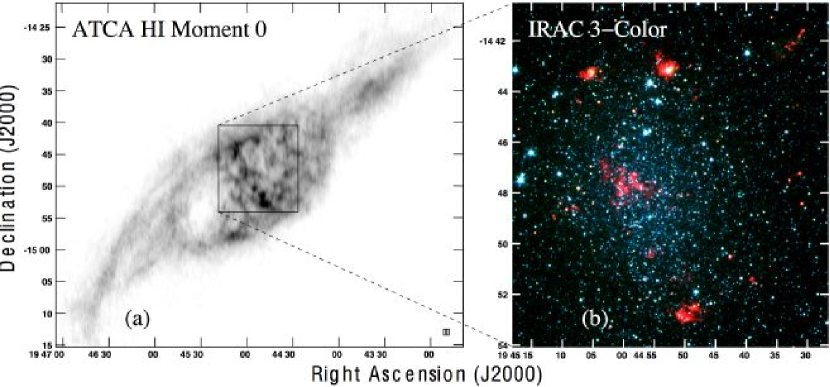
In this paper, we present Spitzer Infrared Array Camera (IRAC) and Multiband Imaging Photometer for Spitzer (MIPS) imaging (see Werner et al., 2004; Fazio et al., 2004; Rieke et al., 2004) of the high optical surface brightness component (i.e., the inner portion of the H i disk) of NGC 6822 (see Figure 2 for a comparison of the field of view imaged and the size of the H i disk). These data were obtained as part of the Spitzer Infrared Nearby Galaxies Survey (SINGS; see Kennicutt et al. 2003). As the nearest galaxy in the SINGS sample, these data probe the nature of mid- and far-IR emission at unprecedented sensitivity and resolution (130 pc; see further discussion below). We compare these Spitzer data to sensitive H, H i and radio continuum imaging in order to study the relation between H i surface density and the locations and intensities of star formation and IR emission.
| Identification | (J2000) | (J2000) | Previous I.D. | References |
|---|---|---|---|---|
| NGC 6822–1 | 19:44:31.28 | 14:47:46.69 | I96 1 | 3 |
| NGC 6822–2 | 19:44:31.92 | 14:44:16.70 | Hubble II | 1 |
| NGC 6822–3 | 19:44:32.96 | 14:42:10.71 | Hubble I/III, G91 3, I96 2 | 1, 2aaThe sources in Gallagher et al. (1991) are not defined by low-resolution (1.5′ 5′) IRAS imaging; the cross-identifications here correspond to only the highest-surface brightness IR peaks in the IR or H images., 3 |
| NGC 6822–4 | 19:44:37.89 | 14:51:37.79 | I96 3 | 3 |
| NGC 6822–5 | 19:44:43.69 | 14:50:19.86 | I96 3 | 3 |
| NGC 6822–6 | 19:44:46.18 | 14:46:19.89 | ||
| NGC 6822–7 | 19:44:49.47 | 14:52:40.93 | Hubble IV, G91 1, I96 4 | 1, 2, 3 |
| NGC 6822–8 | 19:44:52.81 | 14:43:04.97 | Hubble V, G91 3, I96 5 | 1, 2, 3 |
| NGC 6822–9 | 19:44:55.69 | 14:50:17.00 | ||
| NGC 6822–10 | 19:44:57.36 | 14:44:50.01 | ||
| NGC 6822–11 | 19:44:58.59 | 14:47:47.02 | Hubble VI/VII, G91 2, I96 6 | 1, 2, 3 |
| NGC 6822–12 | 19:44:59.82 | 14:54:41.03 | ||
| NGC 6822–13 | 19:45:04.99 | 14:57:29.07 | I96 7 | 3 |
| NGC 6822–14 | 19:45:05.01 | 14:43:17.07 | Hubble X, G91 3, I96 8 | 1, 2, 3 |
| NGC 6822–15 | 19:45:09.35 | 14:48:44.10 | Hubble IX, G91 2, I96 9 | 1, 2, 3 |
| NGC 6822–16 | 19:45:16.68 | 14:45:24.26 |
2. Observations and Data Reduction
2.1. Spitzer Imaging
For an overview of the SINGS observational strategies, see Kennicutt et al. (2003). NGC 6822 was observed for 122 minutes in IRAC mosaicing mode on 2004, October 7 and 11; the separate visits to the target ensure proper removal of image artifacts and asteroids. The observations cover the optical extent of the galaxy to the R25 level (see Figures 1 and 2). de Blok & Walter (2006) find that the stellar population extends throughout the entire H i distribution; our IRAC data remain insensitive to stars in the outer H i disk of NGC 6822. The SINGS IRAC pipeline processes the basic calibrated data (BCD) images, producing mosaics with pixel scales of 0.75″ and PSF FWHM values of 1.66″, 1.72″, 1.88″, and 1.98″ at 3.6, 4.5, 5.8 and 8 m, respectively (Fazio et al., 2004); note that 1″ 2.4 pc at the adopted distance of 490 kpc. Flux levels are uncertain at the 10% level, primarily due to systematic effects in the calibration process.
MIPS scan mapping mode observations were obtained on 2004, September 24 and 25, for a total of 162.1 minutes. The MIPS Instrument Team Data Analysis Tool (Gordon et al., 2005) was used to process the BCD files, producing mosaic images with pixel scales of 0.75″, 3.0″, and 6.0″ at 24, 70 and 160 m, respectively. Systematic uncertainties (e.g., detector nonlinearities, time-dependent responsivity variations, background removal, etc.) limit the absolute flux calibration to 10% in the 24 m band and to 20% in the 70 and 160 m bands (note that the absolute calibration changes slightly depending on which pipeline was used to produce the BCD-level data111See the MIPS data analysis handbook for details; http://ssc.spitzer.caltech.edu/mips; the S10 calibration is applied to these data). The FWHMs of the PSFs are 6″, 18″, and 40″ at 24, 70, and 160 m, respectively. All flux densities were extracted from the broadband images after convolution to the 160 m beam. We use convolution kernels that convert an input PSF into a lower resolution output PSF using the ratio of Fourier transforms of the output to input PSFs. High frequency noise in the input PSF is suppressed when these kernels are created. See K. D. Gordon et al. (2006, in preparation) for details.
At the Galactic latitude of NGC 6822 (14.8∘), the foreground stellar contamination is high. The 3.6/8 m and 8/24 m colors were examined in order to remove the brightest foreground sources, which will have the most pronounced effect on derived flux densities. Less luminous sources require a more detailed treatment; a first-order correction can be estimated by computing the strength of foreground star emission in regions that are clearly unassociated with the stellar component of NGC 6822, and scaling these to the sizes of the regions under study (e.g., Lee et al., 2006b). However, the proximity of NGC 6822 makes it large on the sky; the IRAC maps do not include a large overscan region, making this technique susceptible to small-number statistics. We discuss the effects of foreground contamination in more detail in § 3. Background sources are more difficult to identify (though a first-order estimate of their number density is available from some of the plots shown in this work; see further discussion in § 3.2.1), and no correction for these sources has been explicitly applied.
Foreground Milky Way cirrus contamination is non-negligible in this region of the sky (e.g., Gallagher et al., 1991); given the extent of the galaxy, there will be variations in the cirrus contamination levels within the system that we are unable to remove. In an attempt to subtract the smooth diffuse component, high-surface brightness emission that is clearly associated with the galaxy (by comparison with images at multiple wavelengths) was masked, leaving an estimate of the (spatially variable) background cirrus emission. This background information was smoothed by a 6′ boxcar function and then interpolated over the area of the galaxy. This smoothed cirrus component was then subtracted from the images at 24, 70 and 160 m. Comparison of flux measurements before and after the cirrus removal shows that this correction is of order 10%. The subtracted components at 70 and 160 m are in rough agreement (in terms of both morphology and surface brightness) with the lower-resolution COBE/DIRBE maps presented by Schlegel et al. (1998). Given the systematic uncertainties in the long-wavelength bands (see above) and the potential contamination by foreground cirrus emission, and assuming a random error component of up to 10%, these corrections imply a total error budget of 15% at 24 m, and 25% at 70 and 160 m.
2.2. H i Spectral Line and Radio Continuum Imaging
The H i moment zero (representing integrated column density) image presented here, first published in de Blok & Walter (2000), was obtained with the Australia Telescope Compact Array222The Australia Telescope is funded by the Commonwealth of Australia for operation as a National Facility managed by the Commonwealth Scientific and Industrial Research Organisation. (ATCA) in 1999 and 2000, using the 375, 750D, 1.5A, 6A and 6D configurations. Fifteen 12-hour synthesis observations were taken in mosaicing mode, with the spectral line correlator providing 0.8 km s-1 channel separation.
| RegionbbSee Table 1 for source coordinates and cross-identifications. | H | 3.6 mccOnly the brightest foreground sources have been removed in deriving these values. Using a limited number of apertures which sample regions clearly unassociated with NGC 6822, we derive the following potential contamination levels from unsubtracted foreground sources: IRAC 3.6 m 11.2 4.2 mJy; IRAC 4.5 m 12.0 5.1 mJy; IRAC 5.8, 8.0 m have average foreground values consistent with zero). | 4.5 mccOnly the brightest foreground sources have been removed in deriving these values. Using a limited number of apertures which sample regions clearly unassociated with NGC 6822, we derive the following potential contamination levels from unsubtracted foreground sources: IRAC 3.6 m 11.2 4.2 mJy; IRAC 4.5 m 12.0 5.1 mJy; IRAC 5.8, 8.0 m have average foreground values consistent with zero). | 5.8 mccOnly the brightest foreground sources have been removed in deriving these values. Using a limited number of apertures which sample regions clearly unassociated with NGC 6822, we derive the following potential contamination levels from unsubtracted foreground sources: IRAC 3.6 m 11.2 4.2 mJy; IRAC 4.5 m 12.0 5.1 mJy; IRAC 5.8, 8.0 m have average foreground values consistent with zero). | 8.0 mccOnly the brightest foreground sources have been removed in deriving these values. Using a limited number of apertures which sample regions clearly unassociated with NGC 6822, we derive the following potential contamination levels from unsubtracted foreground sources: IRAC 3.6 m 11.2 4.2 mJy; IRAC 4.5 m 12.0 5.1 mJy; IRAC 5.8, 8.0 m have average foreground values consistent with zero). | 24 m | 70 m | 160 m | 20 cm | H i |
|---|---|---|---|---|---|---|---|---|---|---|
| (erg s-1 cm-2) | (mJy) | (mJy) | (mJy) | (mJy) | (mJy) | (mJy) | (mJy) | (mJy) | (Jy km s-1) | |
| Aperture radii 57″ 3 (160 m PSF FWHM 130 pc) | ||||||||||
| 1 | (9.6 1.9)E-13 | 24 3 | 16 2 | 16 2 | 28 4 | 100 16 | 560 140 | 2100 530 | 1.0 0.3 | 12.9 1.3 |
| 2 | (26 5)E-13 | 17 2 | 12 2 | 6 0.6 | 15 2 | 20 3 | 470 120 | 2100 530 | 3.3 0.4 | 12.2 1.2 |
| 3 | (110 20)E-13 | 17 2 | 14 2 | 11 2 | 27 4 | 110 17 | 1700 430 | 3700 930 | 12 1.2 | 12.0 1.2 |
| 4 | (24 5)E-13 | 31 4 | 21 3 | 20 3 | 26 3 | 32 5 | 630 160 | 2100 530 | 3.1 0.4 | 14.8 1.5 |
| 5 | (5.0 1)E-13 | 43 5 | 29 3 | 26 3 | 27 3 | 81 13 | 600 150 | 1600 400 | 1.0 0.3 | 11.0 1.1 |
| 6 | (14 3)E-13 | 55 6 | 38 4 | 34 4 | 33 4 | 17 3 | 520 130 | 2000 500 | 1.0 0.3 | 10.1 1.0 |
| 7 | (24 5)E-13 | 42 5 | 29 3 | 49 6 | 84 10 | 260 40 | 2300 580 | 4900 1300 | 6.4 0.7 | 21.8 2.2 |
| 8 | (120 25)E-13 | 49 6 | 39 4 | 65 8 | 130 14 | 780 120 | 4300 1100 | 6800 1700 | 21 2.1 | 14.0 1.4 |
| 9 | (4.6 0.9)E-13 | 74 8 | 49 4 | 47 5 | 41 4 | 23 4 | 900 230 | 2100 530 | 1.0 0.3 | 13.7 1.4 |
| 10 | (4.8 1.0)E-13 | 62 7 | 43 4 | 44 5 | 41 5 | 31 5 | 900 230 | 1700 430 | 1.0 0.3 | 9.1 0.9 |
| 11 | (13 3)E-13 | 92 10 | 60 7 | 76 9 | 100 12 | 97 15 | 2000 500 | 5200 1300 | 1.0 0.3 | 15.1 1.5 |
| 12 | (5.9 1.2)E-13 | 30 3 | 22 3 | 18 2 | 11 2 | 8.7 1.3 | 380 100 | 1400 350 | 1.0 0.3 | 11.0 1.1 |
| 13 | (6.8 1.4)E-13 | 12 2 | N/A | 10 1 | N/A | 30 5 | 480 120 | 1700 430 | 1.0 0.3 | 14.1 1.4 |
| 14 | (110 20)E-13 | 35 4 | 28 3 | 32 4 | 49 6 | 190 29 | 2400 600 | 3800 950 | 11 1.1 | 16.3 1.6 |
| 15 | (17 4)E-13 | 54 6 | 39 4 | 41 5 | 39 4 | 75 12 | 880 220 | 2100 530 | 1.0 0.3 | 10.6 1.1 |
| 16ddUncertain local background value in the IR. | (17 4)E-13 | 26 3 | 20 2 | 16 2 | 10 6 | 9.4 1.4 | 330 85 | 610 160 | 1.0 0.3 | 11.6 1.2 |
| Aperture radii 114″ 6 (160 m PSF FWHM) 260 pc | ||||||||||
| Total GalaxyeeSpitzer global flux densities listed in units of Jy. | ||||||||||
| Total | (700 140)E-13 | 2.26 0.23 | 1.44 0.15 | 1.90 0.19 | 1.87 0.19 | 2.51 0.50 | 53.2 15 | 136.2 40.0 | 69.4 14ffCalculated as the sum of individual sources, using the larger aperture when available. | 2266 227 |
To assure accurate total column density calibration, the interferometric data were combined with single-dish observations taken with the 64-m Parkes telescope. These data use the same channel separation as the interferometric observations. The “zero-spacing”correction was applied in the MIRIAD333See http://www.atnf.csiro.au/computing/software/miriad environment. Conditional transfer functions (i.e., blanking) were applied to the final cube to create the integrated column density image presented here. The image has a beam size of 42.4″ 12″ (1 Jy Bm-1 1190.5 K). The final cube that was imaged to produce the moment zero map has a 5 column density sensitivity of 1.6 1019 cm-2; the peak H i column density is 3 1021 cm-2, and the total H i mass is 1.34 108 M⊙ at the adopted distance. More detailed discussions of the H i data, analysis and interpretation can be found in de Blok & Walter (2000), Weldrake et al. (2003), and de Blok & Walter (2006).
During the acquisition of the ATCA H i data, a second frequency band was simultaneously observed; centered at 1.38 GHz, this 128 MHz bandwidth channel provides a sensitive L-band radio continuum map of NGC 6822. Note that these data have no zero-spacing correction applied; the presence of comparatively strong background sources and the weak nature of the intrinsic radio continuum in NGC 6822 make integrated total flux densities difficult to determine. Single-dish observations at other frequencies (Klein et al., 1983; Klein & Gräeve, 1986) suggest an integrated L-band flux density of 100 25 mJy (Israel et al., 1996). Comparing with our interferometric flux density measurements (see § 3 below) suggests that the high surface brightness radio components account for 70% of the (uncertain) total L-band flux density. The remainder may exist as a diffuse synchrotron component (see more detailed discussion on the thermal/nonthermal decomposition within the galaxy in § 3.3). The radio continuum data use the same basic reductions as for the spectral line data, though the final image has a smaller beam size of 30″ 8″; the rms noise is 90 Jy Bm-1. Note that the 20 cm image presented in Figure 3(h) shows only the apertures with radio detections. Further, there are numerous background radio sources in the field (see also the discussion in § 3.3).
2.3. Deep H Imaging
The H image presented here was obtained with the 2.5m Isaac Newton Telescope, using three pointings with the Wide Field Camera to cover the entire H i disk of NGC 6822. The integration time was 80 minutes per pointing; wide-filter R-band imaging was used to remove the continuum. Flux calibration was obtained by comparison with published fluxes for high-surface brightness regions in Hodge et al. (1988, 1989), after correction for foreground reddening (E(BV) 0.24; Gallart et al., 1996a). The limiting flux level is 3.7 10-18 erg s-1 cm-2, roughly a factor of ten deeper than the images presented by Hodge and collaborators. For a detailed discussion of the H image handling, see de Blok & Walter (2006).
3. Multiwavelength Emission in NGC 6822
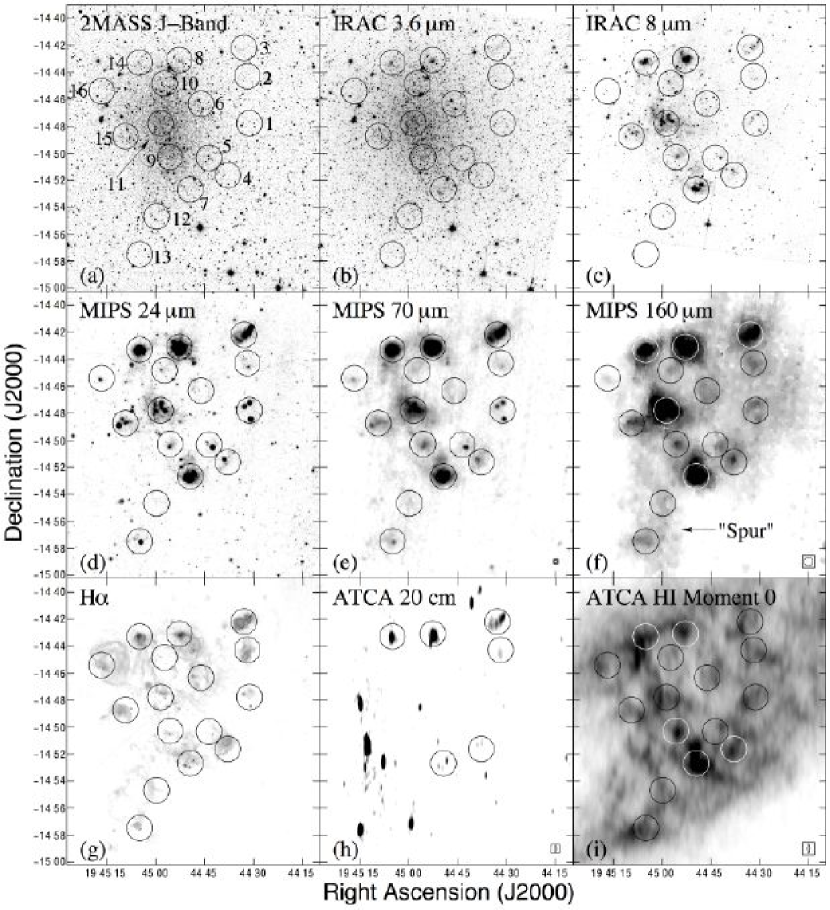
Multiwavelength imaging of NGC 6822 reveals a wealth of detail and structure in the stellar and gaseous components. In Figure 3 we present images of the central region of the galaxy at nine different wavelengths. In the 2MASS J (Jarrett et al., 2003) and 3.6 m bands [see Figures 3(a) and 3(b)], the red stellar component of the galaxy is smoothly distributed, with few major stellar concentrations or clusters (compare to Wyder 2001, 2003 and de Blok & Walter 2006 for more detailed views of the system at optical wavelengths). Longward of 4 m, the spectral energy distribution (SED) of the stellar population has dropped off sufficiently that the warm dust emission from active star formation regions dominates the galaxy morphology (see the 8 m image in Figure 3(c).

Moving into the FIR, Figures 3d, e, and f show that the active regions of star formation stimulate warm dust emission throughout the system. There is also very cool dust extending to the south of the major star formation regions (though still well within the optical and H i radii; see Figure 3f); comparing this emission with the H and H i images shown in Figures 3(g) and 3(i) leaves little doubt that it is associated with NGC 6822 and is not an image artifact. Indeed, both Gallagher et al. (1991) and Israel et al. (1996) recover this structure in IRAS maps. Further, de Blok & Walter (2003) find that this region (spatially coincident with the rim of the H i hole) has the largest concentration of blue stars in NGC 6822.
The H image presented in Figure 3(g) shows that there is ionized gas throughout much of the central disk of the galaxy; previous observations and comparisons with IR imaging have concentrated on the higher-surface brightness star formation regions (e.g., Gallagher et al., 1991; Israel et al., 1996). Six of these regions correspond to detections in the ATCA radio continuum image shown in Figure 3(h). Note that there are numerous background sources in the radio continuum field of view; we have classified radio “detections” as areas of 5 flux density, that have spatial counterparts in H and the 24, 70 and 160 m bands (note that we only show the apertures with radio detections in Figure 3h). Finally, the H i distribution (Figure 3i) throughout the central region of the galaxy contains mostly high-surface brightness (i.e., H i columns 1021 cm-2) emission. There is clumping of the neutral gas surrounding various emission peaks in other wavebands.
We study the panchromatic emission from 16 regions throughout the galaxy; these regions are shown as circles overlaid on the various panels of Figure 3, and their positions and cross-identifications are given in Table 1. The aperture locations were chosen primarily to probe the IR emission complexes. The aperture sizes and locations represent a compromise between spatial resolution, minimization of aperture effects, and diversity of regions that can be probed. The aperture diameter of 114″ ( 270 pc at the adopted distance) is 3 larger than the FWHM of the 160 m PSF (and considerably larger than the FWHM of the 70 m, 24 m, and IRAC bands), which should alleviate serious aperture corrections to the measured flux densities (especially at 3.6, 4.5, 24 and 70 m; extended-source aperture corrections at 5.8 and 8.0 are still uncertain, but may be as large as 30%). For example, an aperture-centered point source at 160 m would have an aperture correction of 30%; this factor will be smaller for extended emission which fills the beam (as is the case for most of the 160 m sources in the galaxy; however, the size of the correction will depend on the IR surface brightness in the regions surrounding the apertures as well). This chosen aperture size is well-matched to most of the discrete dust emission regions in the galaxy, while still allowing us to resolve variations in the nature of the FIR emission by using a large number of apertures. Table 2 shows the flux densities derived in each aperture from H to the radio regime. Note the footnotes to that table, which quantify the effects of foreground stellar contamination in the short-wavelength data. We also investigate the effects of expanding the apertures by a factor of 4 in area for the five brightest dust emission complexes (see further discussion in § 3.1). Table 3 presents various quantities derived from the measurements. We derive an estimate of the 3-1000 m total infrared flux (TIR) using equation 4 of Dale & Helou (2002), evaluated at the effective MIPS wavelengths:
| (1) |
where S24, S70 and S160 are the measured flux densities in units of Jy. Table 3 also presents the H/TIR ratio, the dust-to-gas ratio (see more detailed discussion below, and also Tables 3 and 4), and the ratio of TIR/radio luminosity as represented by the radio-FIR correlation coefficient “q”; each of these quantities will be discussed in more detail below.

3.1. Linking Heating Sources with the Dust Continuum
3.1.1 H vs. IR Emission
The major H ii regions Hubble I/III, V, and X (regions 3, 8, and 14 in Figure 3, respectively) are the strongest H sources in the galaxy. These regions are also luminous at 24, 70 and 160 m. However, the relative strengths of H and TIR emission vary considerably from one source to the next; the regions of strongest H and TIR emission are not always co-spatial. There are 5 sources in the galaxy with TIR fluxes 1.5 Jy (regions 3, 7, 8, 11, and 14; see Table 3); amongst these regions, the H/TIR ratio varies by a factor of ten, with region 11 having strong TIR emission but weak H, and with region 3 having strong H compared to TIR. Expanding these apertures by a factor of 2 in radius shows the same trends, but with reduced extrema (a factor of 5 variation in the H/TIR ratio is found between regions 11 and 3). Similar scatter is seen across the entire sample of 16 regions (see Table 2).
We now examine what fraction of the observed variations can be attributed to extinction effects. Recent work by Wyder (2003) and Lee et al. (2006a) shows that there is variable extinction throughout the disk, with some regions showing no optical extinction and others showing AV values up to 2 magnitudes. For strongly star-forming regions with low H/TIR ratios (e.g., regions 7 and 11), the H flux (and, correspondingly, the H/TIR ratio) may be up to 6 times larger than observed after correction for potentially strong internal extinction (Lee et al., 2006a). It should be noted, however, that these values were extracted using 1.5″-wide spectroscopic slits, and thus probe extinction on a much smaller spatial scale than we are sensitive to with our Spitzer data. Thus, while extinction can play a localized role in some regions, it cannot account entirely for the observed variation in the H/TIR ratio.
A second measure of the extinction is available by comparing H and radio continuum emission strengths. For this comparison, we assume that the 20 cm flux densities shown in Table 2 arise from thermal emission processes. This assumption is justified for most of the major H ii regions in the galaxy, based on two lines of evidence. First, multi-frequency radio continuum data using both interferometric (Condon, 1987) and single-dish (Klein et al., 1983; Klein & Gräeve, 1986) observations as compiled in Israel et al. (1996) show that NGC 6822 is extraordinarily weak in the nonthermal radio continuum – nearly all of the emission throughout the galaxy appears to be of a thermal origin. Second, applying the relations in Caplan & Deharveng (1986), and assuming the Te values calculated in Lee et al. (2006a), we can use our observed (i.e., not extinction-corrected) H fluxes to predict lower limits for the strengths of thermal radio continuum emission. This exercise shows that nearly all regions have a small or (in most cases) negligible nonthermal component: only regions 7 (Hubble IV) and 8 (Hubble V) show thermal fractions less than 90% (50% and 70% in regions 7 and 8, respectively). This suggests that these two regions, both active in current star formation (as evidenced by their strong H and IR emission), have produced sufficient numbers of SNe to accelerate the relativistic electrons that give rise to the apparent nonthermal components.
We now calculate inferred reddening values, proceeding with the assumption that thermal emission dominates throughout the galaxy. Of the six regions detected in the radio continuum, only regions 7 and 8 show potentially strong inferred reddening values (AHα 0.25 magnitudes). Regions 2, 3, 4, and 14 are consistent with values of A 0.1 magnitude. Note that if regions 7 and 8 do in fact contain a (relatively) strong synchrotron component, then the (smaller) thermal fraction of the detected flux densities puts a yet stronger constraint on the low inferred values of the reddening. The smaller inferred extinctions using this approach compared to the values derived from long-slit spectroscopy (Lee et al., 2006a) are expected, since the latter data probe smaller-scale dust concentrations.
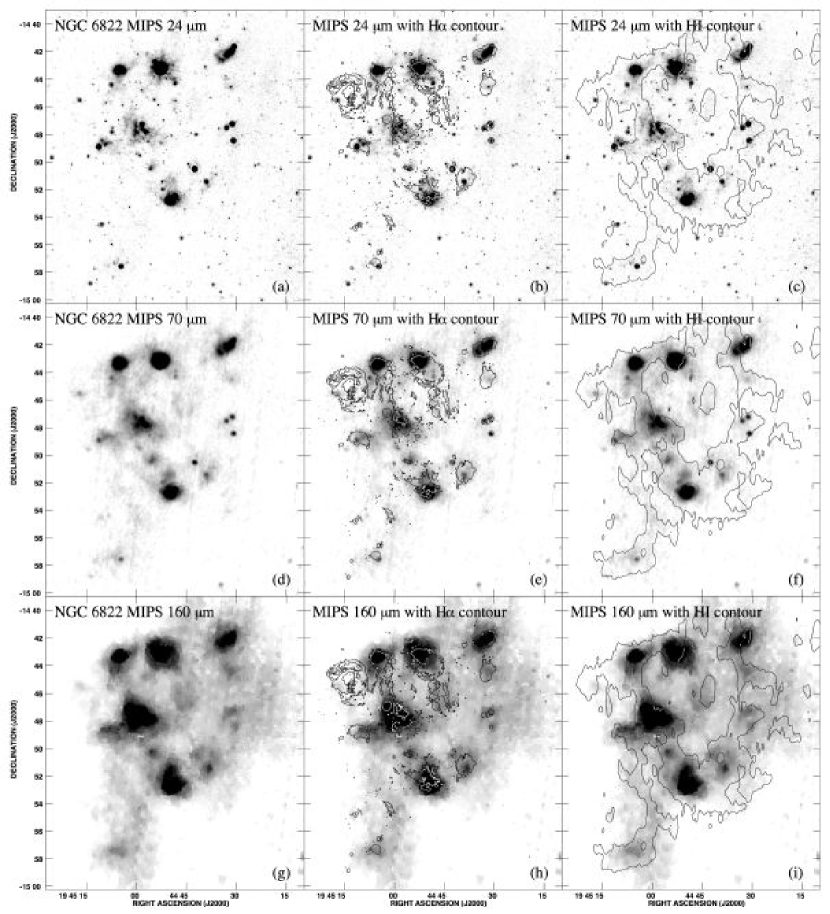
To investigate the localized effects of photon absorption and re-radiation in the IR, the central column of Figure 4 presents detailed comparisons of the H and IR morphologies. Here, a low-level H flux contour (3.7 10-18 erg s-1 cm-2) is overlaid on each of the 24, 70 and 160 m images. It is immediately clear that the regions of high H and IR surface brightnesses are directly linked, since the H contours surround the IR emission peaks. We are thus observing localized dust heating in the ISM (see also further discussion below). However, it is also interesting to note that a significant fraction of the integrated IR flux density of the galaxy is unassociated with regions that are luminous at H. Most H-bright regions are also luminous in the IR; one notable exception is region 16 (see Figure 3), which shows (low-level) H emission in a clear shell morphology but which lacks strong associated dust emission. However, we treat region 16 with caution, since the local background is not well-defined (see Table 2) and may be over-subtracted in the IR images.
To discern the origin of the photons that give rise to IR emission throughout the galaxy, it is useful to quantify what fraction of the total IR luminosity of NGC 6822 arises from regions that are not luminous at H. The global flux densities in the long-wavelength bands, measured over the entire central disk region (S 2.51 0.50 Jy; S 53.2 15 Jy; S 136.2 40 Jy; see Figure 3 and Table 2), appear to consist of discrete FIR peaks and a more extended “diffuse” component. Here we classify emission as diffuse if it is located outside the regions detected at H (shown as the 3.7 10-18 erg s-1 cm-2 contour in Figure 4). The quantification of the fraction of the total FIR that arises in a diffuse component is dependent on the sensitivity of the H data to which we compare the IR images (or, equivalently, on the surface brightness below which we classify IR emission as “diffuse”). The spatial scales over which the diffuse emission are found are much larger than the PSFs at 160 and (especially) 70 m (precluding PSF smearing as the only origin of the diffuse component). We find that 60% of the integrated flux densities at 70 and 160 m arise from this diffuse component. While the 24 m emission is more strongly peaked in regions of active star formation (e.g., Helou et al., 2004; Calzetti et al., 2005), the diffuse component still accounts for 50% of the total 24 m flux density. These results suggest that a substantial amount of the IR radiation may be powered by non-ionizing sources or may be the result of UV photons escaping directly from star formation regions; this is discussed further in § 4. Similar results were obtained for NGC 6822 by Gallagher et al. (1991) and Israel et al. (1996); diffuse far-IR emission is also seen in other nearby dwarf galaxies (e.g., NGC 55; Engelbracht et al., 2004).
In Figure 5 we present elliptical surface brightness profiles of H i, H and IR emission. These profiles were derived using parameters from the H i rotation curve analysis of de Blok & Walter (2000) and Weldrake et al. (2003). Radially-averaged elliptical annuli with 12″ thickness are integrated along the position angle of the galaxy’s major axis [central position: 19:44:58.04, 14:49:18.9 (J2000; this location is between apertures 9 and 11 in Figure 3); position angle 120∘; see Weldrake et al. 2003 for details]. The resulting surface brightness profiles show that H, IR and H i peaks correlate remarkably well. In particular, the H and 24 m profiles are very similar, tracing the local star formation rate (Helou et al. 2004; Calzetti et al. 2005). We discuss the surface brightness profiles in more detail in § 3.2.
3.1.2 Infrared vs. Optical Luminosities and Star Formation Rates
The metal-poor ISM of NGC 6822 is an interesting environment in which to compare the luminosities and implied SFRs from various methods. Using the global flux densities in the long-wavelength bands (see above) and the relations presented in Dale & Helou (2002), the total IR flux of 5.7 10-12 W m-2 corresponds to L 1.6 1041 erg s-1 at 490 kpc. The H-based SFR (sensitive to recent star formation over the last 10 Myr) is 0.016 M⊙ yr-1, and the total recent SFR (over the last 100-200 Myr) derived from the stellar population study of Gallart et al. (1996b) is 0.04 M⊙ yr-1.
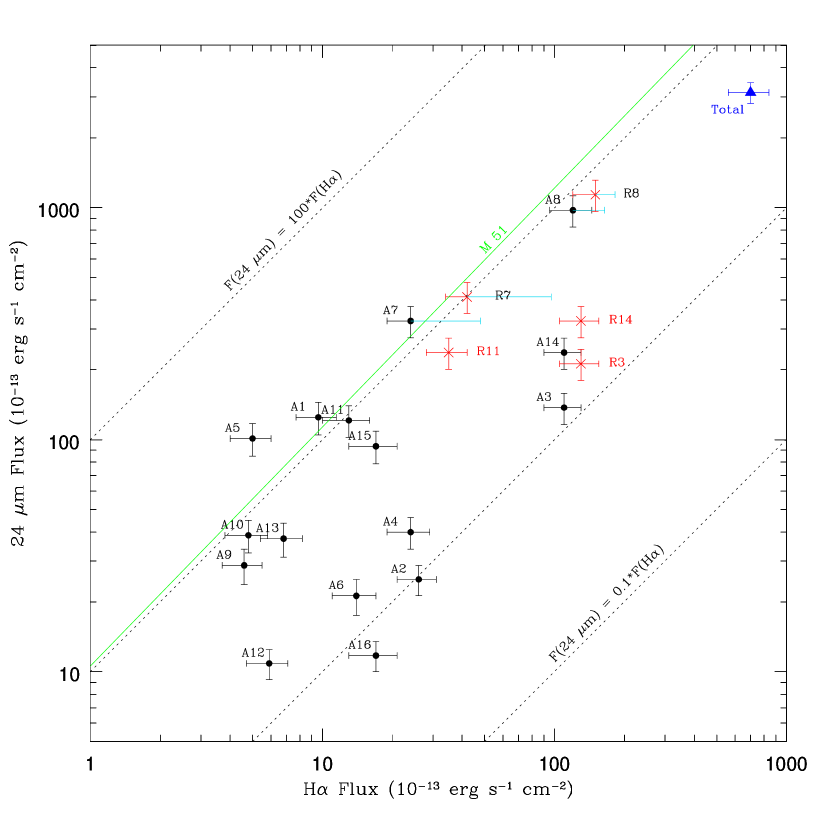
The 24 m luminosity (L24), which has been shown to correlate well with regions of active star formation in a range of environments (e.g., Helou et al., 2004; Calzetti et al., 2005), is an appropriate IR-based SFR indicator for dust-rich regions. We compare the L24/H ratio for NGC 6822 with what was observed by Calzetti et al. (2005) in the more metal-rich spiral galaxy M 51 (Bresolin et al., 2004), as follows:
| (2) |
where L24 and LHα are the observed luminosities at 24 m and H, respectively; the intrinsic H/P ratio is assumed to be 8.734. The central wavelength of 24.0 m is used to convert the 24 m flux density to a luminosity measurement [thus, L24 as defined above is not strictly a luminosity, but is rather equivalent to Fν; we keep the above notation to allow direct comparison to the work of Calzetti et al. (2005)]. Using the total observed H luminosity of the system (see Table 2), this relation predicts a total 24 m luminosity 3 times higher than the observed value. This confirms that metal-poor galaxies do not have enough metals to form dust in the same fraction as more metal-rich environments.
| RegionaaSee Table 1 for source coordinates and cross-identifications. | S(TIR)bbCalculated using the relations presented in Dale & Helou (2002); uncertainties are estimated at the 40% level. | F(H)/F(TIR)ccCalculated as the unitless ratio of H to TIR flux; ratios represent 1000 this fraction. | H i Mass | MDust/MHIddSee Table 4 for dust mass derivations; the values shown here are calculated using dust masses derived from the models of Draine & Li (2001), Li & Draine (2001, 2002), and Draine & Li (2006). | qTIReeqTIR is the “q” parameter evaluated using an estimate of the total IR luminosity (log(S(TIR/Radio))); q24 and q70 are the monochromatic “q” parameters, as studied in Murphy et al. (2006). | q70eeqTIR is the “q” parameter evaluated using an estimate of the total IR luminosity (log(S(TIR/Radio))); q24 and q70 are the monochromatic “q” parameters, as studied in Murphy et al. (2006). | q24eeqTIR is the “q” parameter evaluated using an estimate of the total IR luminosity (log(S(TIR/Radio))); q24 and q70 are the monochromatic “q” parameters, as studied in Murphy et al. (2006). |
|---|---|---|---|---|---|---|---|
| (10-13 W m2) | (105 M⊙) | () | |||||
| Aperture radii 57″ 3 (160 m PSF FWHM 130 pc) | |||||||
| 1 | 1.03 0.41 | 9.6 4.3 | 7.3 0.8 | 0.0038 0.0021 | |||
| 2 | 0.73 0.29 | 36 16 | 6.9 0.7 | 0.0045 0.0024 | 2.76 | 2.15 | 0.78 |
| 3 | 1.98 0.79 | 55 24 | 6.8 0.7 | 0.0048 0.0026 | 2.66 | 2.15 | 0.96 |
| 4 | 0.85 0.34 | 28 13 | 8.4 0.9 | 0.0039 0.0021 | 2.87 | 2.31 | 1.01 |
| 5 | 0.80 0.32 | 6.3 2.8 | 6.2 0.7 | 0.0034 0.0018 | |||
| 6 | 0.76 0.30 | 18 8 | 5.7 0.7 | 0.0046 0.0025 | |||
| 7 | 2.88 1.15 | 8.3 3.8 | 12.4 1.2 | 0.0037 0.0020 | 3.08 | 2.56 | 1.61 |
| 8 | 5.39 2.16 | 23 10 | 7.9 0.8 | 0.0073 0.0039 | 2.83 | 2.31 | 1.57 |
| 9 | 0.91 0.36 | 5.1 2.2 | 7.8 0.8 | 0.0026 0.0014 | |||
| 10 | 0.69 0.28 | 7.0 3.2 | 5.2 0.6 | 0.0020 0.0010 | |||
| 11 | 2.40 0.96 | 5.4 2.5 | 8.6 0.9 | 0.0066 0.0035 | |||
| 12 | 0.52 0.21 | 11 5 | 6.2 0.7 | 0.0022 0.0012 | |||
| 13 | 0.70 0.28 | 9.7 4.4 | 8.0 0.8 | 0.0030 0.0016 | |||
| 14 | 2.42 0.97 | 46 20 | 9.2 1.0 | 0.0025 0.0013 | 2.75 | 2.34 | 1.24 |
| 15 | 1.07 0.43 | 15 7 | 6.0 0.6 | 0.0035 0.0019 | |||
| 16ffNote that the local background surrounding region #16 in the MIPS images is very uncertain; see § 3.1.1. | 0.29 0.12 | 59 28 | 6.6 0.7 | 0.00055 0.00029 | |||
| Aperture radii 114″ 6 (160 m PSF FWHM) 260 pc | |||||||
| 3 | 4.0 1.6 | 33 14 | 23.3 2.4 | 0.0050 0.0027 | 2.97 | 2.50 | 1.19 |
| 7 | 5.0 2.0 | 8.4 3.7 | 36.4 3.7 | 0.0030 0.0016 | 3.01 | 2.56 | 1.40 |
| 8 | 7.8 3.1 | 19 8.6 | 25.6 2.6 | 0.0040 0.0021 | 2.99 | 2.54 | 1.62 |
| 11 | 5.7 2.3 | 6.1 2.8 | 28.4 2.9 | 0.0048 0.0026 | |||
| 14 | 4.1 1.6 | 32 15 | 30.1 3.0 | 0.0016 0.00087 | 2.80 | 2.46 | 1.18 |
| Total Galaxy | |||||||
| NGC 6822 | 57 23 | 12.3 5.5 | 1340 140 | 0.00077 0.00043ggThis value uses the total H i mass from the entire system; using the H i mass contained in the matching aperture used for the global IR flux density extractions reduces the enclosed H i mass by 10%. | 3.34 | 2.88 | 1.55 |
| RegionaaSee Table 1 for source coordinates and cross-identifications. | TDUSTbbAverage dust temperature and implied dust mass over the aperture, derived by blackbody fitting. | Blackbody | cc and dust mass values derived using the semiempirical SED models of Dale et al. (2001) and Dale & Helou (2002); typical errors on the index are 0.15 (see discussion in § 3.2.2). | Dale et al. | Li & Draine |
|---|---|---|---|---|---|
| (K) | Dust MassbbAverage dust temperature and implied dust mass over the aperture, derived by blackbody fitting. | Dust Masscc and dust mass values derived using the semiempirical SED models of Dale et al. (2001) and Dale & Helou (2002); typical errors on the index are 0.15 (see discussion in § 3.2.2). | Dust MassddDust mass derived using the SED models of Draine & Li (2001), Li & Draine (2001, 2002), and Draine & Li (2006). | ||
| (103 M⊙) | (103 M⊙) | (103 M⊙) | |||
| Aperture radii 57″ 3 (160 m PSF FWHM 130 pc) | |||||
| 1 | 21 2 | 1.4 0.7 | 2.03 | 12.6 6.3 | 2.81 1.40 |
| 2 | 21 2 | 1.6 0.8 | 2.88 | 14.4 7.2 | 3.11 1.55 |
| 3 | 24 2 | 1.6 0.8 | 2.31 | 14.4 7.2 | 3.27 1.63 |
| 4 | 22 2 | 1.3 0.6 | 2.75 | 11.7 5.9 | 3.26 1.63 |
| 5 | 23 2 | 0.82 0.41 | 2.00 | 7.4 3.7 | 2.11 1.05 |
| 6 | 21 2 | 1.4 0.7 | 2.81 | 12.6 6.3 | 2.63 1.31 |
| 7 | 24 2 | 2.1 1.1 | 2.00 | 18.9 9.5 | 4.62 2.31 |
| 8 | 25 2 | 2.3 1.1 | 1.72 | 20.7 10.4 | 5.79 2.89 |
| 9 | 23 2 | 0.97 0.49 | 2.62 | 8.7 4.4 | 2.04 1.02 |
| 10 | 24 2 | 0.66 0.33 | 2.50 | 5.9 3.0 | 1.01 0.50 |
| 11 | 23 2 | 2.6 1.3 | 2.56 | 23.4 11.7 | 5.61 2.80 |
| 12 | 21 2 | 0.93 0.47 | 2.75 | 8.4 4.2 | 1.40 0.70 |
| 13 | 21 2 | 1.1 0.6 | 2.81 | 9.9 5.0 | 2.43 1.21 |
| 14 | 25 2 | 1.3 0.6 | 2.03 | 11.7 5.9 | 2.31 1.15 |
| 15 | 23 2 | 0.98 0.49 | 2.19 | 8.8 4.4 | 2.09 1.04 |
| 16eeNote that the local background surrounding region #16 in the IR images is very uncertain; see § 3.1.1. | 24 2 | 0.23 0.12 | 2.50 | 20.7 10.4 | 0.36 0.18 |
| Aperture radii 114″ 6 (160 m PSF FWHM) 260 pc | |||||
| 3 | 23 2 | 4.7 2.3 | 2.56 | 42.3 21.2 | 11.7 5.9 |
| 7 | 24 2 | 4.7 2.3 | 2.28 | 42.3 21.2 | 11.1 5.5 |
| 8 | 25 2 | 4.7 2.3 | 1.91 | 42.3 21.2 | 10.2 5.1 |
| 11 | 23 2 | 6.7 3.3 | 2.62 | 60.3 30.2 | 13.6 6.8 |
| 14 | 25 2 | 2.8 1.4 | 2.25 | 25.2 12.6 | 4.91 2.4 |
| Total Galaxy | |||||
| NGC 6822 | 23 2 | 83 42 | 2.56 | 750 380 | 103 52 |
To explore the relation between H and IR emission on a spatially resolved basis, we plot in Figure 6 the H vs. 24 m fluxes, and compare to the relation derived for M 51. While there is an appreciable scatter, it is clear that regions within NGC 6822 follow a different scaling between H and 24 m luminosity than the regions in M 51: the H ii regions in NGC 6822 have much lower extinction than those in M 51, as expected on the basis of the widely different metallicities (factor 10-15; see Bresolin et al. 2004). Note that extinction corrections at H will move points to the right in this plot, and cannot directly account for all of the observed dispersion (see further discussion in § 3.1.1); we plot the largest detected reddening vector (0.75 mag, for aperture 7 or Hubble IV) in Figure 6 to demonstrate the severity of (spatially variable) extinction at H. The scatter in this plot can then be interpreted as the effect of star formation on the local ISM. This expands the findings of Cannon et al. (2005, 2006), where the vigorously star-forming, metal-poor galaxies IC 2574 and NGC 1705 were also found to have different H/24 m ratios than those found in more metal-rich galaxies. Further, it reiterates the conclusions of Kennicutt (1998): the infrared luminosity is a reliable SFR indicator only in metal-rich (i.e., dusty) environments, where a large fraction of the light from massive stars is reprocessed by dust to the infrared. We discuss these results further in § 4.
3.2. Neutral Gas vs. Dust Emission
3.2.1 Correlations Between H i and Dust
The right column of Figure 4 shows the IR images overlaid with contours of H i column density at the 1021 cm-2 level. It is clear from this image and Table 2 that the central disk of NGC 6822 is rich in neutral gas and has relatively small variations in H i column density over the apertures in this study (factor of 2 variations in flux). Comparing the locations of H, H i and dust emission in Figure 4, it is also clear that nearly all locations of active star formation (as evidenced by high-surface brightness H emission) are associated with H i columns in excess of 1021 cm-2. Note by comparison with Figures 1 and 2, however, that the H i distribution is much more extended than the high-surface brightness optical body and the areas with strong FIR emission.
The surface brightness profiles of the FIR emission (see Figure 5) show that the 24 m emission is, in general, associated with local H i column density maxima. Moving toward cooler dust emission, the 70 and 160 m profiles show a much lower dynamic range than the 24 m profile; however, the peaks in the FIR nicely correlate with the locations of H i surface density maxima. For example, at radii of 0.2, 1.0, and 1.6 kpc, the correlations between H i, H and IR emission are especially strong (though relative variations are evident).
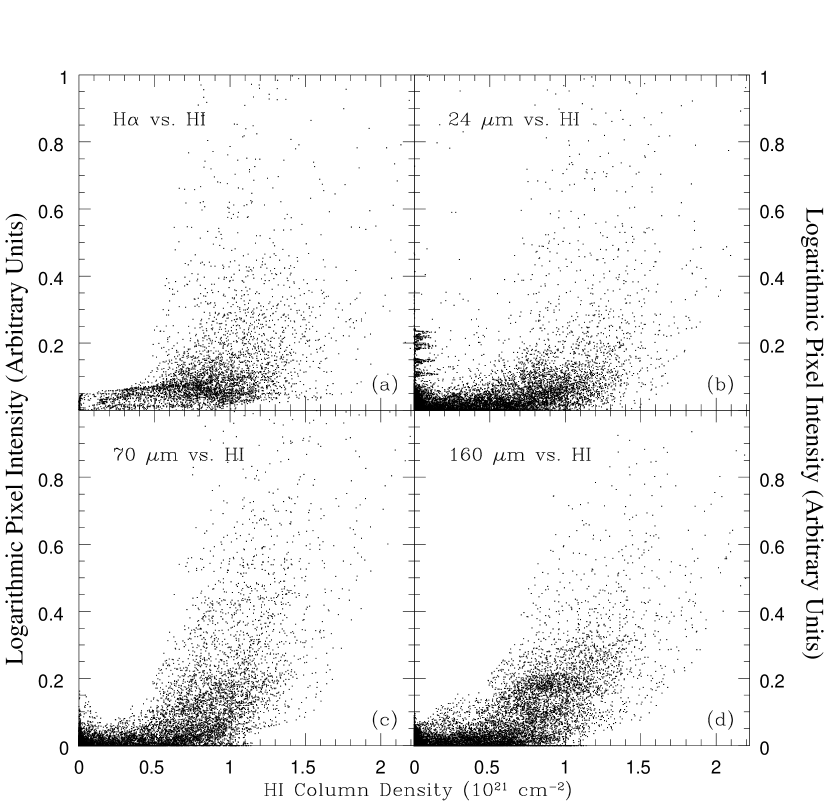
To further quantify the correlation between H i and FIR emission, Figures 7 and 8 show pixel-by-pixel histograms and scatter plot comparisons of H i column density vs. surface brightness measurements in the H and IR bands. These plots were created by comparing H i, H, and IR surface brightnesses on an individual pixel basis. They clearly demonstrate that FIR and H emission are strongly peaked in regions with H i column densities 1021 cm-2. The 70 and 160 m histograms show that the regions of strongest dust emission (as traced by very high-surface brightness 70 and 160 m emission; thin gray lines in Figure 7) are associated with the highest H i column densities: the histogram at 16 MJy sr-1 shows a median value 50% higher than the median at 4 MJy sr-1. There is little difference in the pixel-by-pixel distribution of surface brightnesses at H or in the IR bands; above H i columns of 5 1020, the nebular and dust emission both increase in strength as the H i column increases, with the highest-surface brightness emission strongly peaked in regions with H i column densities 1021 cm-2.
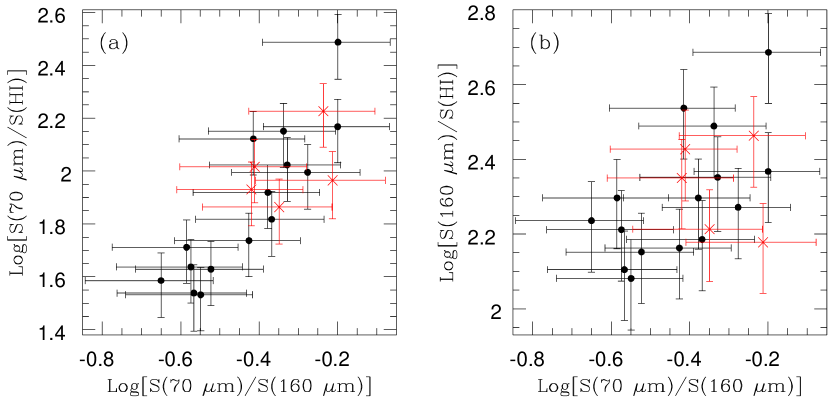
We now consider the origin of the evident correlation between nebular and IR surface brightness as a function of H i column density. If the strength of the dust emission is correlated primarily with dust heating, then the far-IR colors should become warmer as the ratio of dust to H i emission increases. However, if the strength of the dust emission is related to an increase in the density of dust, then the ratio of infrared to H i emission will not be correlated with the far-infrared colors. To investigate this scenario, we plot in Figure 9 the ratios of S70/SHI and S160/SHI for the regions listed in Table 1, each as a function of IR color [here, Log(S70/S160)]. These plots allow us to gauge how much IR emission is arising per unit H i mass at a given dust temperature (or, similarly, at a given radiation field strength level). It is clear from Figure 9(a) that as the IR color increases (radiation field strength rising), the amount of 70 m emission per unit H i mass also increases. At 160 m, this correlation is less evident, suggesting that 70 m emission is more sensitive to local heating, as one would expect for thermal emission in the temperature range of interstellar dust (see also Dale et al., 2005). This arises in part due to the 70 m band falling near the transition point between the hot dust emission that dominates shorter wavelengths and the 20–30 K dust emission that radiates at longer wavelengths. While the errorbars in both plots are large, we can infer that localized heating of dust, in addition to increased H i column density, plays an important role in controlling the nature of IR emission. The different dynamic ranges of nebular, dust and H i emission may also suggest increasing H i columns due to photodissociation of H2 in regions of active star formation.
The simplest physical scenario that explains these observational trends is one where the H i and dust are mixed in the ISM, and that as the local radiation field strength increases, so does the total IR emission per unit dust mass (e.g., Dale et al., 1999). If the increase in the dust emission surface brightness was due solely to an increase in the local H i column density (i.e., a relatively constant-strength interstellar radiation field producing higher surface brightnesses in regions of larger H i columns), then the dynamic range of the dust emission would be expected to be similar to that in H i. However, Figures 7 and 8 clearly show a large scatter of IR flux densities at a given H i column or a given radiation field strength. We caution that with the present observations, it is not possible to assure that the H i, H and IR observations are all sampling interstellar media that are exactly co-spatial; however, the clear correlations between these various phases (see Figures 4, 7 and 8) suggest that dust absorption and re-radiation are closely tied to local star formation intensity. Note that no regions with high IR surface brightness and high H i column density are H-deficient (i.e., non-detections); this again supports the theory that local star formation is an important mechanism in the production of the observed IR SED.
3.2.2 Derivation of Dust Masses
In the following, we calculate the dust mass of NGC 6822 (both globally and within the apertures shown in Figure 3) using three different methods of increasing sophistication. We begin with a single-temperature fit, and discuss explicitly the shortcomings of such an approach in accurately representing the observed SEDs within NGC 6822. We then discuss two SED modeling techniques that offer a more physical representation of the data.
First, we apply a simple single-temperature modified blackbody fit to the data (see, e.g., Hildebrand, 1983; Bianchi et al., 1999). Dust mass values are derived via the following equation:
| (3) |
where is the distance to the galaxy, is the flux density, represents the absorption opacity of the dust (given in Li & Draine 2001), and is the Planck function evaluated at temperature T, derived by fitting a blackbody modified by a emissivity function to the 70 and 160 m data. Using this method, we derive a total dust mass of (8.3 4.2) 104 M⊙; Table 4 shows the inferred dust masses for each region.
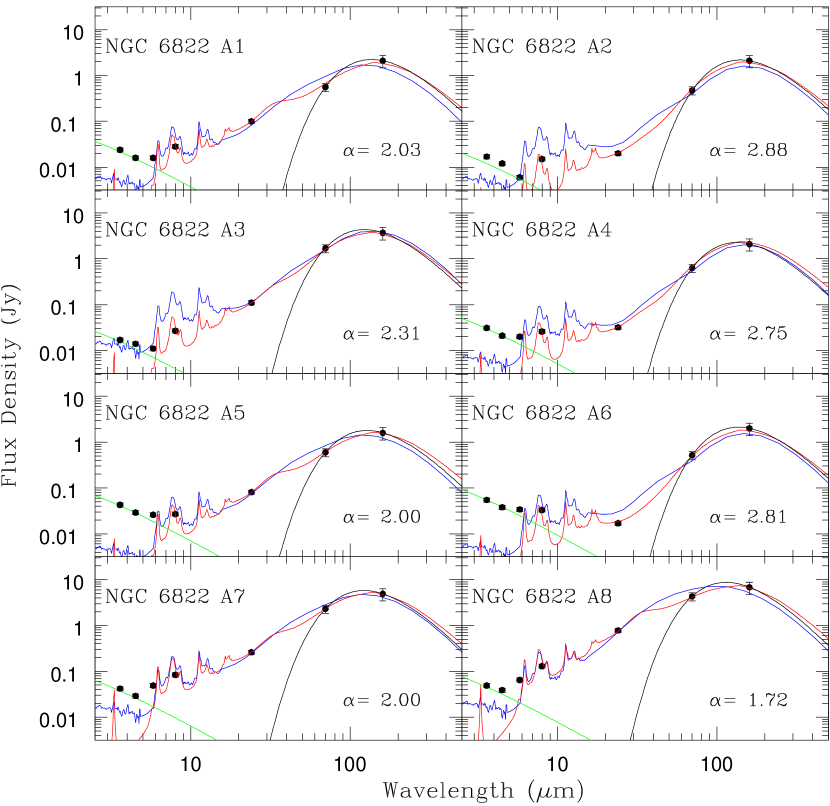
This simple prescription assumes that all the IR emission in a galaxy is at both the same temperature and in thermal equilibrium. A combination of the composite nature of IR emission [arising from large grains, polycyclic aromatic hydrocarbons (PAH), very small grains, etc.], the stochastic heating processes that are of differing importance for various types of grains (see Draine & Li 2001 for a detailed discussion), and the complex relations between dust emission, gas density, and the local interstellar radiation field,, suggests that this single-temperature assumption is likely incorrect, at least on local scales. Indeed, Figures 10, 11 and 12 show that the simple blackbody fits to the 70 and 160 m data are not intended to represent the hot dust emission at shorter wavelengths; the fits fall short of the observed 24 m data points by orders of magnitude. Given these failures, we seek a more detailed treatment of the SEDs that accounts for the potential contribution of multiple grain populations to the dust mass.
A second and more robust method with which to calculate the dust mass using IR to submillimeter data is with the SED models presented by Dale et al. (2001) and Dale & Helou (2002). These models assume that large grains, very small grains, and PAH molecules contribute to the integrated IR energy budget in a galaxy. Semiempirical SEDs are constructed assuming a power-law distribution of dust mass as a function of the strength of the local interstellar radiation field (U). With U normalized to unity for the radiation field near the sun, masses are computed via the relation:
| (4) |
where Mdust is the dust mass heated by a radiation field of strength U, and represents the relative contributions of the different local SEDs. The fitted values of correlate with an empirical measure of the ratio , which was calibrated against IRAS data (see Dale et al., 2001; Dale & Helou, 2002). This ratio then corresponds to a scaling factor by which the dust mass estimates using single-temperature blackbody fits (see above) should be increased to account for mass components not well-constrained by the blackbody fit (see application of this method to NGC 7331 in Regan et al. 2004). Values of between 2–4 imply a mass increase of a factor of 9 (see Figure 6 of Dale & Helou 2002); values less than this show a smaller increase in dust mass (e.g., 1.75 corresponds to a factor of 8 increase).
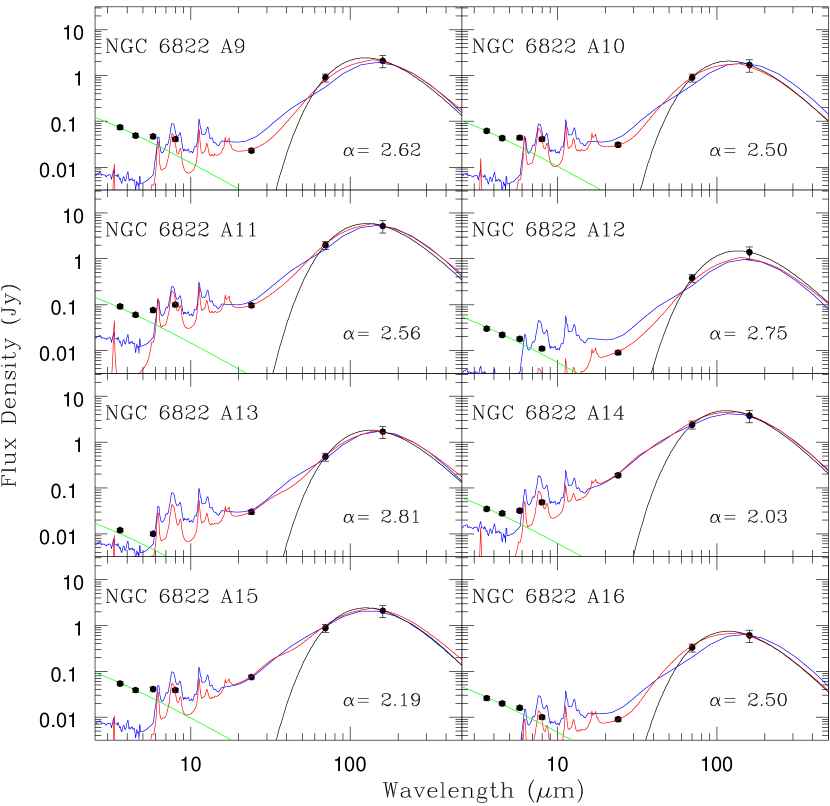
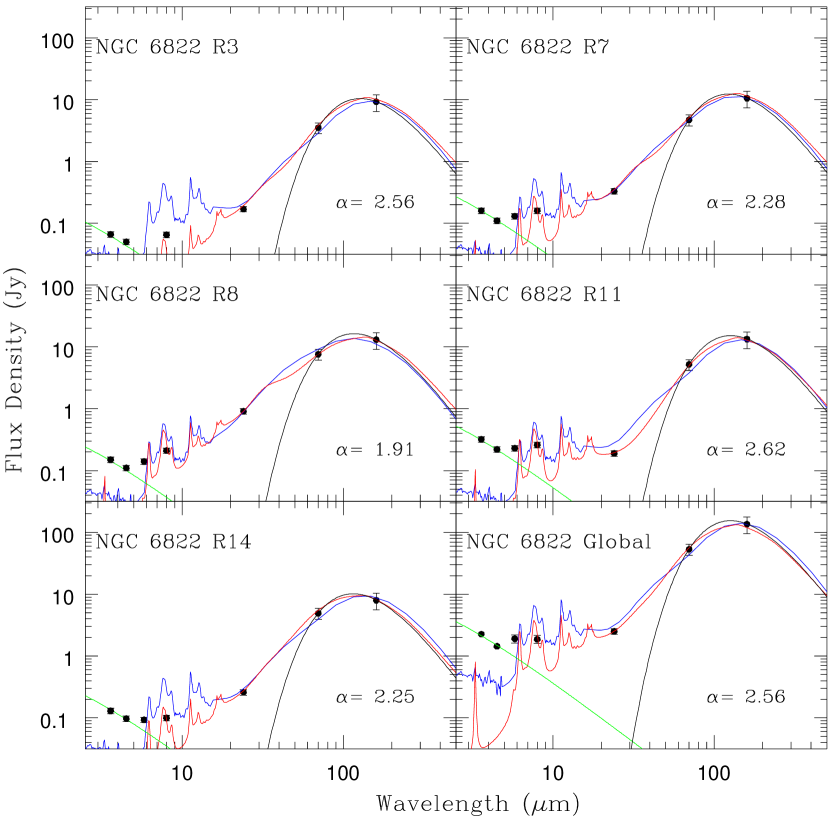
Fitting these models to the flux densities of the regions and the entire galaxy (see Tables 2 and 4) yields values of 2.0 2.8 for nearly all regions; Monte Carlo simulations of the errors on the index were performed during the fitting of these models to 68 galaxies in Dale et al. (2005), providing typical errors of 0.15. The observed values of in NGC 6822 are consistent with those seen in the Dale et al. sample; the only exception is region 8 (Hubble V), the strongest IR, H and radio continuum source in the galaxy. This active star formation region may have a strong enough local radiation field that a large component of cool grains (which would lead to a pronounced mass increase) is absent. Figures 10, 11 and 12 show these model fits to each region, and Table 4 gives the values of for each fit and the inferred dust mass using these SED models. Given the uncertainties in the dust masses derived from the blackbody fits (see above and Table 4) and the varying quality of the least-squares fit for each region (compare, e.g., the fits for regions 6 and 14), all regions are consistent with an increase in mass by a factor of 9; the global dust mass increases accordingly to (7.5 3.8) 105 M⊙.
A third and yet more sophisticated estimate of the dust mass in the galaxy can be found using the models of Li & Draine (2001, 2002) and (Draine & Li, 2006). Here, radiation field strengths are varied via power-law distributions; PAH, silicate and graphite grains are illuminated and the resulting SEDs can be compared to the observations. The fit of these models to our observations is also shown in Figures 10–12. The observed SEDs are well-reproduced by these models, when a small fraction (5–30%, depending on the individual region) of the dust mass is exposed to radiation fields largely in excess of the local average (see Draine & Li 2006). The implied dust masses are given in Tables 3 and 4; these masses are smaller than those derived using the Dale et al. (2001) and Dale & Helou (2002) models. The derived global dust mass is (1.03 0.52) 105 M⊙.
We note that our global flux densities produce SEDs that are in good agreement with the fluxes measured in Israel et al. (1996). Our use of sophisticated SED modeling techniques [Dale et al. (2001) and Dale & Helou (2002); Li & Draine (2001, 2002) and Draine & Li (2006)] results in dust masses that are larger than those derived by Israel et al. (1996). These differences are thus attributable solely to our different (and likely more physical) modeling approach.
Note that our data may remain insensitive to a potential component of very cold dust (which may be located away from regions of star formation). Previous studies (e.g., Eales et al. 1989, Devereux & Young 1990, Kwan et al. 1992, and Calzetti et al. 2000) have shown that observations from the mid-IR into the sub-millimeter regime are needed to fully quantify the range of dust temperatures, grain sizes, and opacities, and to provide a robust estimate of the total dust mass in a galaxy. Popescu et al. (2002), for example, noted that -20 K dust may be present in many nearby galaxies. Data longward of 160 m would be needed to determine whether such dust is present in NGC 6822. Some observational results have also demonstrated that dust with temperatures as cold as 5-10 K (e.g., Madden et al. 2002; Galliano et al. 2003, 2005) may be present in dwarf galaxies. However, theoretical research (e.g., Li 2004) and other observational results (Dumke et al., 2004; Bendo et al., 2006, e.g.) have suggested that 5-10 K dust temperatures would require physically implausible dust grain properties or unrealistically high dust masses. Nonetheless, if dust cooler than 20 K exists in NGC 6822, then these data may afford only a lower limit on the total dust content of the system.
3.2.3 The Empirical Dust-to-H i Ratio
The Spitzer images of NGC 6822 can be compared to our sensitive H i imaging to study the dust-to-gas ratio at 130 pc resolution. We define the dust-to-gas ratio (hereafter represented as ) as the ratio of dust mass (as traced by these Spitzer observations) to H i mass; no correction is applied for the (uncertain) contribution of CO or H2 gas. At sub-solar metallicities (recall that NGC 6822 has a metallicity 30% Z⊙), the molecular phase of the ISM is different from that in more metal-rich systems. Theoretical predictions (e.g. Maloney & Black, 1988; Bolatto et al., 1999) and observational evidence (e.g., Taylor et al., 1998; Leroy et al., 2005) have shown that CO clouds have a smaller volume filling factor in metal-poor systems than in spiral galaxies. Israel (1997) uses CO observations of selected regions in NGC 6822 to infer a total molecular mass 10% of the H i mass (though these numbers are highly uncertain, depending on the conversion factor used to infer total H2 content from observed CO intensities). Since a complete census of the molecular material in NGC 6822 is difficult, we simply study the relation of dust and H i gas; any molecular material in NGC 6822 will lower the derived .
Throughout the disk, the mean value of (in apertures of physical radius 130 pc, using the dust masses derived from the models of Li & Draine) is 0.004 (with little change when using apertures with 4 times larger area; see Tables 3 and 4). Variations of a factor 3 are seen among individual regions, and the errors on the values are also high (arising from the relatively uncertain dust mass estimates). These average values are lower than the average global values found for other SINGS galaxies using similar modeling techniques. For example, Draine et al. (2006, in preparation) present detailed dust mass estimates for many SINGS galaxies: for 40 systems with Spitzer data but no submillimeter observations, the average global (excluding dwarf galaxies and the contribution of molecular hydrogen) is Mdust/M HI=0.02; i.e. a factor of 5 higher than the average local ratios found using the same models in NGC 6822.
Israel et al. (1996) finds a global of 1.4 10-4 in NGC 6822 using IRAS data; our derived global value (using the Li & Draine models) is 8 10-4 (see Table 3). Our Spitzer data recover very similar global flux densities as found in the Israel et al. (1996) study; the differences in dust mass and are attributed to the use of detailed SED models of the IR emission. Note that all of the values derived for the apertures listed in Table 4 are higher than the global value. This is expected since the dust is strongly peaked in regions of high H i column and star formation (e.g., see Figures 5, 7 and 8), but the bulk of the extended H i distribution has little associated dust emission (see Figure 2). Recall, however, that our data remain insensitive to a potential component of very cold dust (see more detailed discussion above).
We note by examining the individual panels of Figures 10, 11 and 12 that the model fits to the IR SEDs predict significant power in the PAH bands between 5 and 20 m (though see discussion of potential metallicity effects in Dale et al. 2005). Most regions show a rise in the SED moving from 4.5 m to 5.8 and 8.0 m, part or all of which may be associated with aromatic band emission in the ISM. Given the metallicity of NGC 6822 (Z 30% Z⊙) and the empirical dependence of PAH emission on metallicity Engelbracht et al. (2005), it will be fruitful to compare the IRAC images with IRS spectra of various regions in NGC 6822. Initial results of SINGS extra-nuclear IRS spectra of the major star formation complexes (e.g., Hubble I/III, V, X) show that PAH emission is prominent throughout the galaxy. This will allow a proper spatial and spectral decomposition of PAH emission in the metal-poor ISM at unprecedented resolution.
3.3. The Radio - Far-IR Correlation
In normal star-forming galaxies, there is a remarkably tight correlation between the total IR luminosity and the strength of radio continuum emission (see, e.g., de Jong et al. 1985, Helou et al. 1985, Condon 1992, and references therein). Given the differing physical mechanisms giving rise to far-IR and radio emission, the tightness of the relation (scatter of less than 0.3 dex over multiple orders of magnitude in luminosity) is especially remarkable. Bell (2003) shows that the relation holds for dwarf galaxies, which are generally deficient both in IR and radio emission with respect to massive galaxies, when the emission is normalized by the star formation rate. However, these systems require a complex interplay of star formation, dust content and magnetic fields to produce the apparently linear relation in this regime.
Figure 3(h) shows that only sources 2, 3, 4, 7, 8, and 14 are detected at high S/N in our radio continuum imaging. These are the six highest-surface brightness H regions in the galaxy. We tentatively detect lower surface brightness regions throughout the disk, but the presence of strong background sources precludes us from analyzing them with confidence. Flux densities for these regions are quoted as upper limits in Table 2. Assuming that the monochromatic or TIR fluxes and the radio continuum emission are related via constant values [q log(SIR/SRC); see Bell (2003) and Murphy et al. (2006a) for details], we calculate two values of “q”. The first is a monochromatic comparison of the IR and radio continuum flux densities:
| (5) |
The second compares a measure of the total infrared flux with the radio continuum:
| (6) |
We calculate “q” (see Table 3) in individual regions, as well as throughout the total galaxy. The resulting values are in excellent agreement with those found both locally and globally in larger samples of galaxies. For example, Bell (2003) finds a median global q 2.64 0.02 in a sample of more than 200 galaxies. Murphy et al. (2006a) explores the radio-IR correlation on a spatially resolved basis (sampling physical regions of 300–750 pc) using SINGS data on four nearby spiral galaxies, finding ranges of 0.85 q24 1.10 and 1.95 q70 2.25 (where q24 and q70 are the monochromatic “q” parameters derived using equation 5). In NGC 6822, there is slight evidence that regions with a high H/TIR ratio show lower “q” values; there is no evidence for a trend of “q” with or with TIR flux.
The agreement of the local and global values with the canonical radio-IR relations derived for spiral galaxies suggests that both the radio and IR are significantly depleted in NGC 6822, conspiring to produce the observed “q” parameters. Different physical mechanisms appear to be at work in the ISM of this dwarf galaxy compared to those operating in the ISM of more massive spirals. In NGC 6822, the bulk of the radio emission appears to be thermal: in § 3.1.1, we showed that most regions have thermal fractions 90% (the strongest nonthermal sources are regions 7 and 8, with thermal fractions of 50% and 70%, respectively). In contrast, nonthermal processes produce the bulk of radio continuum emission in massive spiral galaxies [see Murphy et al. (2006a) and Murphy et al. (2006b) for more detailed discussions of the radio-FIR correlation in SINGS galaxies]. Evidently, in NGC 6822 the IR emission per unit star formation is reduced by about the ratio of free-free/nonthermal emission in normal spirals, conspiring to produce the observed “q” values.
The relative ratios of radio and IR emission strengths in NGC 6822 are in marked contrast to the strong deviations from the canonical radio-IR relation found for very active low-metallicity galaxies in the SINGS sample. Cannon et al. (2005, 2006) show that the radio-FIR correlation breaks down in very strongly star forming regions. The “supergiant shell” region of IC 2574 has induced strong variations of the “q” parameter (over an order of magnitude); the dwarf starburst galaxy NGC 1705 shows strong FIR emission but is a radio non-detection. Other types of galaxies can also be extremely radio-deficient, though likely for different reasons than those seen in NGC 6822 [see, e.g., the Roussel et al. (2006) study of the nascent starburst in the lenticular galaxy NGC 1377].
These results suggest that star formation intensity has a dramatic effect both on the appearance of radio continuum emission, and on the derived correlation between FIR emission and radio continuum luminosity, in galaxies with small potential wells (for comparison, note that more massive starburst galaxies in the Bell 2003 sample show little deviation from the derived radio-TIR relation). The intensity of star formation relative to the presence of a stable large-scale disk is important, since the ratio of activity to disk density and gravity will govern the amount of disruption and blow-out that takes place (thus, the irregular nature of NGC 6822 is likely also important in determining the ratio of IR to radio emission). The relatively uniform values of “q” found in larger spiral galaxies and quiescent dwarfs argues that disk disruption by star formation is minimal; the strongly varying values of “q” in starbursting dwarfs suggests that the small disks are being overwhelmed by the star formation activity.
4. Discussion and Conclusions
We have presented IR observations of the Local Group dwarf irregular galaxy NGC 6822 obtained with Spitzer as part of SINGS. The galaxy is highly resolved at all imaging bands; the resolution limit is driven by the FWHM of the 160 m PSF. At 130 pc physical resolution, we study the nature of FIR emission and compare to observations in the optical and radio. These sensitive data reveal a wealth of structure within the galaxy. Our study confirms some previous results, while also offering new insights into the nature of infrared emission in the metal-poor ISM. We discuss these topics in more detail below.
The total monochromatic FIR flux densities are found to be S 2.51 0.50 Jy; S 53.2 15 Jy; S 136.2 40 Jy. SED model fits to these data allow comparison with previous IRAS flux measurements; our Spitzer flux densities are in excellent agreement with the measurements in Israel et al. (1996). Using the relations presented in Dale & Helou (2002), these global flux densities correspond to a total IR flux of 5.7 10-12 W m-2 ( 4.3 107 L⊙).
IR emission at 24, 70 and 160 m is found only within the central, high-H i column density ( 1021 cm-2) region of NGC 6822. The total H i distribution is much more extended than the high-surface brightness stellar or dust emission components. The 24 m surface brightness profile closely traces that of H, delineating regions of ongoing star formation. The profiles of 70 and 160 m emission also trace local H i column density maxima.
Comparing (monochromatic and total) FIR emission with a sensitive H image reveals a strong morphological correlation between IR and H surface brightness; here we are directly observing the re-processing of photons by dust. Roughly 50% of the TIR flux is attributable to discrete FIR sources, all of which have at least a low-level H counterpart; the remaining FIR emission arises from a “diffuse” component of the ISM (slightly stronger at 70 and 160 m than at 24 m; see detailed discussion in § 3.1.1) that is apparently not associated with massive star formation. Gallagher et al. (1991) and Israel et al. (1996) find similar results from IRAS imaging of NGC 6822; we interpret this as the re-processing of non-ionizing photons in the ISM or as the escape of radiation from the star formation regions.
We find variations in the relative ratios of nebular and dust continuum emission. While differential extinction can cause some of the observed fluctuations, it cannot account for the full breadth of properties seen in the galaxy. Using SINGS observations of the starbursting dwarf galaxies IC 2574 and NGC 1705, Cannon et al. (2005, 2006) found similar variations and attributed them to the direct impact of recent star formation on the local ISM (i.e, production and re-processing of photons). The results presented here extend this trend to more typical, quiescent dwarfs.
Evidence is mounting from spatially resolved Spitzer observations of dwarf galaxies that these systems follow a different trend of 24 m vs. H luminosity than what is seen in more metal-rich systems (see, e.g., Calzetti et al. 2005). This result is in agreement with previous observations of dwarf galaxies (e.g., Hunter et al., 1989). Two different scenarios can account for this observational trend. The first one, physically simple and more commonly used, is related to the low dust content of low-metallicity galaxies. Here, low-metallicity galaxies simply do not have enough metals to form dust in the same fraction as more metal rich environments. The second scenario posits that dwarfs harbor massive components of cold dust (T 5–10 K) that is simply not heated by ongoing star formation. Such dust would peak past 200 m and remain undetected in the present Spitzer observations, contributing to part of the observed discrepancy; observational evidence exists both for and against such a component in nearby galaxies (see detailed discussion in § 3.2.2). Clearly, sensitive observations of a large sample of dwarf galaxies between 200 and 1000 m are needed to address this issue.
As mentioned previously, our global flux densities for NGC 6822 are in good agreement with those from Israel et al. (1996). We use sophisticated SED modeling techniques [Dale et al. (2001) and Dale & Helou (2002); Li & Draine (2001, 2002) and Draine & Li (2006)] to derive dust masses that are higher than those derived by Israel et al. (1996). The differences in mass are thus attributable solely to our more physical modeling approach, which takes into account the variety of dust species and heating levels in each region within the disk (see detailed discussion in § 3.2.2). For a given TIR luminosity, our models recover a higher dust mass than simple blackbody fits (see detailed discussion in § 3.2.2). The treatment of multiple grain populations likely means that the increased dust masses are a better representation of the mass radiating between 10 and 160 m. Using these techniques, we derive a total dust mass of 105 M⊙ (this value is derived using the Li & Draine models).
Comparing to our high-resolution H i imaging, we can explore the mass ratio of warm dust to H i gas () in the ISM. Given the low nebular abundance of the system (Z 30% Z⊙), we can thus provide constraints on a potential trend of with abundance. Metal-poor dwarf galaxies might be expected to have a lower (i.e., higher gas mass fraction) than more metal-rich galaxies such as the Milky Way (e.g., Thronson & Telesco, 1986). Lisenfeld & Ferrara (1998) have argued that dwarf irregular galaxies have a clear relation between these two quantities in a global sense (using dust masses derived from single-temperature blackbody fits).
Here, we derive a global 8 10-4. This is 25 times lower than the average global values found in the new SINGS study of Draine et al. (2006, in prep.), wherein dust masses are calculated for a large sample of galaxies (excluding dwarfs). On local scales (130 pc), the dust mass per unit H i mass is higher (by a factor of 5), though still lower than the global values found by Draine et al.
We propose a simple model for the relative ratios of dust mass to H i mass in the ISM. As noted above, dwarf galaxies may contain large reservoirs of cold dust (T 5–10 K) that are undetectable with Spitzer observations (e.g. Madden, 2002; Galliano et al., 2005). Note, however, that the dilution of the radiation field required for this dust to remain at such low temperatures may require it to be located at large distances from the star formation regions and thus essentially decoupled from the active ISM (note that other mechanisms may also be important in dwarfs, including dust destruction by supernova shocks; see, e.g., Bot et al. 2004). Superposed on this putative cool component are regions radiating between 10 and 160 m; here, photons are being absorbed and re-radiated as IR photons. The low dust contents of metal-poor galaxies plays an important role in the microphysics of this process. Galaxies with widespread, elevated star formation will heat more of their total dust component than more quiescent systems. When more sensitive observations are possible between 200 and 1000 m, we will be able to quantify the relative masses of these components in low-mass dwarf galaxies.
Finally, it is interesting that NGC 6822 seems to fall near the canonical measures of the radio-FIR relation (e.g., Bell, 2003; Murphy et al., 2006a). 20 cm radio continuum imaging reveals six high surface brightness sources, each of which appears to be of thermal origin. The monochromatic and total IR “q” parameters are similar to those found for more massive galaxies. This agreement is interesting, given that nonthermal emission dominates the radio continua of spiral disks. The simplest explanation is that depleted radio and far-IR emission strengths conspire to produce the observed values. These findings in NGC 6822 are in marked contrast to recent results for very active star-forming dwarf galaxies, where significant deviations from the canonical radio-FIR relation are found (Cannon et al., 2005, 2006). Taken together, these data suggest that star formation intensity is one of the important parameters that governs the observed radio-FIR relation in dwarf galaxies.
References
- Babul & Ferguson (1996) Babul, A., & Ferguson, H. C. 1996, ApJ, 458, 100
- Bell (2003) Bell, E. F. 2003, ApJ, 586, 794
- Bendo et al. (2006) Bendo, G. J., et al. 2006, ApJ, in press (astro-ph/0607669)
- Bianchi et al. (1999) Bianchi, S., Davies, J. I., & Alton, P. B. 1999, A&A, 344, L1
- Bolatto et al. (1999) Bolatto, A. D., Jackson, J. M., & Ingalls, J. G. 1999, ApJ, 513, 275
- Bot et al. (2004) Bot, C., Boulanger, F., Lagache, G., Cambrésy, L., & Egret, D. 2004, A&A, 423, 567
- Bresolin et al. (2004) Bresolin, F., Garnett, D. R., & Kennicutt, R. C., Jr. 2004, ApJ, 615, 228
- Calzetti et al. (2000) Calzetti, D., Armus, L., Bohlin, R. C., Kinney, A. L., Koornneef, J., & Storchi-Bergmann, T. 2000, ApJ, 533, 682
- Calzetti et al. (2005) Calzetti, D., et al. 2005, ApJ, 633, 871
- Cannon et al. (2005) Cannon, J. M., et al. 2005, ApJ, 630, L37
- Cannon et al. (2006) Cannon, J. M., et al. 2006, ApJ, 647, 293
- Caplan & Deharveng (1986) Caplan, J. & Deharveng, L. 1986, A&A, 155, 297
- Chyży et al. (2003) Chyży, K. T., Knapik, J., Bomans, D. J., Klein, U., Beck, R., Soida, M., & Urbanik, M. 2003, A&A, 405, 513
- Condon (1987) Condon, J. J. 1987, ApJS, 65, 485
- Condon (1992) Condon, J. J. 1992, ARA&A, 30, 575
- Dale et al. (1999) Dale, D. A., Helou, G., Silbermann, N. A., Contursi, A., Malhotra, S., & Rubin, R. H. 1999, AJ, 118, 2055
- Dale et al. (2000) Dale, D. A., et al. 2000, AJ, 120, 583
- Dale et al. (2001) Dale, D. A., Helou, G., Contursi, A., Silbermann, N. A., & Kolhatkar, S. 2001, ApJ, 549, 215
- Dale & Helou (2002) Dale, D. A., & Helou, G. 2002, ApJ, 576, 159
- Dale et al. (2005) Dale, D. A., et al. 2005, ApJ, 633, 857
- de Blok & Walter (2000) de Blok, W. J. G., & Walter, F. 2000, ApJ, 537, L95
- de Blok & Walter (2003) de Blok, W. J. G., & Walter, F. 2003, MNRAS, 341, L39
- de Blok & Walter (2006) de Blok, W. J. G., & Walter, F. 2006, AJ, 131, 343
- de Jong et al. (1985) de Jong, T., Klein, U., Wielebinski, R., & Wunderlich, E. 1985, A&A, 147, L6
- Devereux & Young (1990) Devereux, N. A., & Young, J. S. 1990, ApJ, 359, 42
- Draine & Li (2001) Draine, B. T., & Li, A. 2001, ApJ, 551, 807
- Draine & Li (2006) Draine, B. T., & Li, A. 2006, ApJ, submitted (astro-ph/0608003)
- Dumke et al. (2004) Dumke, M., Krause, M., & Wielebinski, R. 2004, A&A, 414, 475
- Eales et al. (1989) Eales, S. A., Wynn-Williams, C. G., & Duncan, W. D. 1989, ApJ, 339, 859
- Ellis (1997) Ellis, R. S. 1997, ARA&A, 35, 389
- Engelbracht et al. (2004) Engelbracht, C. W., et al. 2004, ApJS, 154, 248
- Engelbracht et al. (2005) Engelbracht, C. W., Gordon, K. D., Rieke, G. H., Werner, M. W., Dale, D. A., & Latter, W. B. 2005, ApJ, 628, L29
- Fazio et al. (2004) Fazio, G. G., et al. 2004, ApJS, 154, 10
- Gallagher et al. (1991) Gallagher, J. S., Hunter, D. A., Gillett, F. C., & Rice, W. L. 1991, ApJ, 371, 142
- Gallart et al. (1996a) Gallart, C., Aparicio, A., & Vilchez, J. M. 1996a, AJ, 112, 1928
- Gallart et al. (1996b) Gallart, C., Aparicio, A., Bertelli, G., & Chiosi, C. 1996b, AJ, 112, 2596
- Galliano et al. (2003) Galliano, F., Madden, S. C., Jones, A. P., Wilson, C. D., Bernard, J.-P., & Le Peintre, F. 2003, A&A, 407, 159
- Galliano et al. (2005) Galliano, F., Madden, S. C., Jones, A. P., Wilson, C. D., & Bernard, J.-P. 2005, A&A, 434, 867
- Gordon et al. (2005) Gordon, K.D., et al. 2005, PASP, 177, 503
- Helou et al. (1985) Helou, G., Soifer, B. T., & Rowan-Robinson, M. 1985, ApJ, 298, L7
- Helou et al. (2004) Helou, G., et al. 2004, ApJS, 154, 253
- Hildebrand (1983) Hildebrand, R. H. 1983, QJRAS, 24, 267
- Hodge et al. (1988) Hodge, P., Lee, M. G., & Kennicutt, R. C. 1988, PASP, 100, 917
- Hodge et al. (1989) Hodge, P., Lee, M. G., & Kennicutt, R. C. 1989, PASP, 101, 32
- Hubble (1925) Hubble, E. P. 1925, ApJ, 62, 409
- Hunter et al. (1989) Hunter, D. A., Gallagher, J. S., Rice, W. L., & Gillett, F. C. 1989, ApJ, 336, 152
- Hunter et al. (2001) Hunter, D. A., et al. 2001, ApJ, 553, 121
- Israel (1997) Israel, F. P. 1997, A&A, 317, 65
- Israel et al. (1996) Israel, F. P., Bontekoe, T. R., & Kester, D. J. M. 1996, A&A, 308, 723
- Jarrett et al. (2003) Jarrett, T. H., Chester, T., Cutri, R., Schneider, S. E., & Huchra, J. P. 2003, AJ, 125, 525
- Kennicutt (1998) Kennicutt, R. C. 1998, ApJ, 498, 541
- Kennicutt et al. (2003) Kennicutt, R. C., et al. 2003, PASP, 115, 928
- Klein et al. (1983) Klein, U., Gräve, R., & Wielebinski, R. 1983, A&A, 117, 332
- Klein & Gräeve (1986) Klein, U., & Gräve, R. 1986, A&A, 161, 155
- Kwan & Xie (1992) Kwan, J., & Xie, S. 1992, ApJ, 398, 105
- Lee et al. (2006a) Lee, H., Skillman, E. D., & Venn, K. 2006a, ApJ, 642, 813
- Lee et al. (2006b) Lee, H., Skillman, E. D., Cannon, J. M., Jackson, D. C., Gehrz, R. D., Polomski, E. F., & Woodward, C. E. ApJ, 647, 970
- Leroy et al. (2005) Leroy, A., Bolatto, A. D., Simon, J. D., & Blitz, L. 2005, ApJ, 625, 763
- Li & Draine (2001) Li, A., & Draine, B. T. 2001, ApJ, 554, 778
- Li & Draine (2002) Li, A., & Draine, B. T. 2002, ApJ, 576, 762
- Li (2004) Li, A. 2004, Penetrating Bars Through Masks of Cosmic Dust, 535
- Lisenfeld & Ferrara (1998) Lisenfeld, U., & Ferrara, A. 1998, ApJ, 496, 145
- Madden (2002) Madden, S. C. 2002, Ap&SS, 281, 247
- Maloney & Black (1988) Maloney, P., & Black, J. H. 1988, ApJ, 325, 389
- Mateo (1998) Mateo, M. L. 1998, ARA&A, 36, 435
- Murphy et al. (2006a) Murphy, E. J., et al. 2006a, ApJ, 638, 157
- Murphy et al. (2006b) Murphy, E. J., et al. 2006b, ApJ, submitted
- Popescu et al. (2002) Popescu, C. C., Tuffs, R. J., Völk, H. J., Pierini, D., & Madore, B. F. 2002, ApJ, 567, 221
- Regan et al. (2004) Regan, M. W., et al. 2004, ApJS, 154, 204
- Rieke et al. (2004) Rieke, G. H., et al. 2004, ApJS, 154, 25
- Roussel et al. (2006) Roussel, H., et al. 2006, ApJ, 646, 841
- Schlegel et al. (1998) Schlegel, D. J., Finkbeiner, D. P., & Davis, M. 1998, ApJ, 500, 525
- Skillman et al. (1989) Skillman, E. D., Terlevich, R., & Melnick, J. 1989, MNRAS, 240, 563
- Sodroski et al. (1997) Sodroski, T. J., Odegard, N., Arendt, R. G., Dwek, E., Weiland, J. L., Hauser, M. G., & Kelsall, T. 1997, ApJ, 480, 173
- Taylor et al. (1998) Taylor, C. L., Kobulnicky, H. A., & Skillman, E. D. 1998, AJ, 116, 2746
- Thronson & Telesco (1986) Thronson, H. A., Jr., & Telesco, C. M. 1986, ApJ, 311, 98
- Weldrake et al. (2003) Weldrake, D. T. F., de Blok, W. J. G., & Walter, F. 2003, MNRAS, 340, 12
- Werner et al. (2004) Werner, M. W., et al. 2004, ApJS, 154, 1
- Wyder (2001) Wyder, T. K. 2001, AJ, 122, 2490
- Wyder (2003) Wyder, T. K. 2003, AJ, 125, 3097