Quasi-simultaneous five-frequency VLBA observations of PKS 0528+134
We present results of Very Long Baseline Array (VLBA) observations of PKS 0528+134 at five frequencies (2.3, 5.0, 8.4, 15.4, and 22.2 GHz). These quasi-simultaneous data enable us to study the spectral distribution of Very Long Baseline Interferometer (VLBI) components for the first time in this highly variable source, from which the central compact core is identified. Our observations indicate that there are two bendings for the jet motion at parsec scale. We provide an approximate spatial fit to the curved jet trajectory using the Steffen et al. (Steffen95 (1995)) helical model. We further investigate the proper motions of three jet components, which all show superluminal motion. At high frequencies (15.4 and 22.2 GHz) we detected a new component, which is estimated to be related to a radio burst peaking at about 2000.
Key Words.:
galaxies: jets – quasars: individual (PKS 0528+134) – radio continuum: galaxies1 Introduction
As one of the brightest active galactic nuclei, PKS 0528+134 has been intensively studied at the radio, X-ray, and gamma-ray bands. It is one of the furthest blazars detected by EGRET above 100 Mev (Mukherjee et al. Mukherjee97 (1997)) with red-shift z=2.07 (Hunter et al. Hunter (1993)). There are relatively less optical observations compared with the observations at other bands because of its location close to the Galactic plane (galactic latitude b=) and thus high Galactic extinction. Whiting et al. (Whiting03 (2003)) obtained , at 2001.66 after the extinction corrections. But these are different from the previous values B=20.0 (Condon, Hicks & Jauncey Condon77 (1977)) and V=19.5 (Wall & Peacock Wall85 (1985)), implying its optical variability. People have observed its variability on a timescale as short as a few days at gamma-ray (Mukherjee et al. Mukherjee96 (1996)), as short as two days in the optical band (Ghosh et al. Ghosh00 (2000)), and from several months to a few years in the radio band (e.g., Pohl et al. Pohl95 (1995); Peng et al. Peng01 (2001)). There is a delay for the radio burst from high frequencies to low frequencies. Peng et al. (Peng01 (2001)) showed in their light curves that the delay for the 1996 burst is about 0.7 yr between 10.7 and 5.0 GHz. Mukherjee et al. (Mukherjee96 (1996)) showed that the delay between the gamma-ray flare and the radio burst is a few months.
Very Long Array (VLA) observations detected a diffuse emission 2′′ in extent and centered 1′′ north of the core with 0.2% and 1.2% of the peak brightness at 4.9 and 1.5 GHz, respectively (Perley Perley82 (1982)). PKS 0528+134 is frequently observed as a calibrator for VLBI observations (e.g. Shen et al. Shen05 (2005)). The first VLBI images of PKS 0528+134 (Charlot Charlot90 (1990)) show a one-sided extension at 2.3 GHz and a double structure at 8.4 GHz, indicating a core-jet structure at P.A. (position angle) . Zhang et al. (Zhang94 (1994)) studied in detail the geometry, radiation mechanism, and physical environment of the emission region in the source through the X-ray and VLBI observations, and found a bent jet extending toward the northeast on a parsec scale. Krichbaum et al. (Krichbaum95 (1995), hereafter K95) presented VLBI observations at 8, 22, 43 and 86 GHz, and also revealed a strongly bent one-sided core-jet structure with at least three superluminal components and two apparently stationary jet components. Their first 86 GHz VLBI observations of this source revealed an unresolved core (50as) and a new jet component (N2) whose ejection was believed to relate to an outburst in the mm-regime and a preceding gamma-ray flare observed in early 1993. Britzen et al. (1999, hereafter B99) studied in detail the morphology, kinetics, and the relations between the morphological changes in the source structure and the increased activity in the radio and gamma-ray bands through the eight-year 8 GHz geodetic VLBI observations composed of 20 epochs. They found seven distinct jet components that all showed superluminal motions. The jet trajectory was bent twice, and different components had different paths. But these radio observations cannot give the spectral distribution of VLBI components, because the source is strongly variable, while VLBI observations made at different frequencies were not simultaneous.
In Sect. 2, we present the first quasi-simultaneous VLBI mapping observations of PKS 0528+134 at five frequencies (2.3, 5.0, 8.4, 15.4, and 22.2 GHz). Then in Sect. 3 we discuss the structure of the jet, give the spectra of the jet components, identify the central core component based on its flat spectrum characteristic, study the proper motions of the jet components, estimate the ejection epochs of two components (a and n2), and describe the jet bending by means of the helical model, followed by the discussion and conclusion in Sects. 4 and 5, respectively.
Throughout this paper, the radio spectral index is defined as . By assuming kms-1 Mpc-1, , and (Spergel et al. Spergel03 (2003)), we have a scale for PKS 0528+134 (z = 2.07) of 1 mas pc.
2 Observations and data reduction
The observations were performed with the NRAO111The National Astronomy Observatory (NRAO) is operated by Associated Universities Inc., under cooperative agreement with the National Science Foundation. Very Long Baseline Array (VLBA) on August 20, 2001 (2001.64) at 2.3/8.4 (dual frequency), 5.0, 15.4, and 22.2 GHz. Observations at different frequencies were interlaced, so data at different frequencies have similar (u,v) coverage. At 2.3/8.4 and 5.0 GHz, each scan lasted about 2.6 mins, with total observing time about 36 mins each. At 15.4 and 22.2 GHz, scan lengths are about 25 and 8 seconds with a total observing time of 60 and 38 mins, respectively. The data were recorded in 1-bit sampling VLBA format with a total bandwidth of 64 MHz (eight 8MHz IF channels) at 5.0, 15.4, and 22.2 GHz, and the total bandwidth of 32 MHz (four 8 MHz IF channels ) at the dual frequency 2.3/8.4 GHz, per circular polarization at each station.
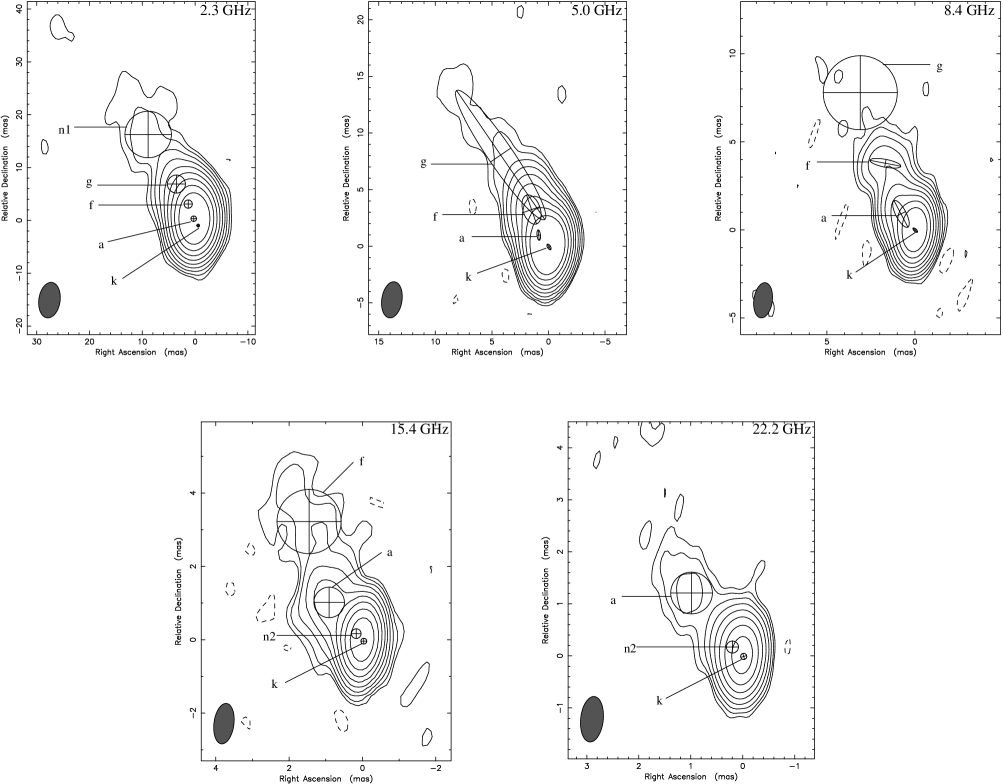
The data correlation was done with the VLBA correlator in Socorro, New Mexico, USA. Post-correlation data was exported to the NRAO AIPS software (Schwab & Cotton Schwab83 (1983)) for fringe fitting, then to the Caltech DIFMAP package (Shepherd Shepherd97 (1997)) for hybrid mapping. A prior visibility amplitude calibration was done using the antenna gain and the system temperature measured at each station. During the hybrid mapping, the CLEAN and phase-only self-calibration were iteratively used during the early processing, and the amplitude self-calibration was added for the later processing. The resulting VLBA maps at five frequencies are shown in Fig. 1. The quantitative description of the source structure is determined by model fitting to the calibrated visibility data at each frequency, and the results listed in Table 1.
We used the Difwrap program (Lovell Lovell00 (2000)) to estimate the errors in Gaussian model fitting. The parameter of interest was stepped in small increments near the best-fit value. At each step this parameter was kept fixed, while some related parameters were allowed to relax during the model fitting. In addition, errors caused by self-calibration during the mapping processes had to be considered. These are typically 10% at 2.3, 5.0, 8.4, and 15.4 GHz, and about 15% at 22.2 GHz. The errors listed in Table 1 were obtained by combining all these error budgets.
The single-dish flux density at the time close to our VLBA observations is 2.62, 2.40, and 2.52 Jy at 5.0, 8.4, and 15.4 GHz, respectively, from the University of Michigan Radio Observatory, 2.20 Jy at 2.3 GHz from the NRAO Green Bank Interferometer, and 2.14 Jy at 22.2 GHz from the Metsahovi Observatory. The total flux density observed by these single dishes is 1.07, 1.06, 1.06, 1.16, and 1.26 times higher than the integrated flux density in the VLBA maps at 2.3, 5.0, 8.4, 15.4, and 22.2 GHz, respectively. We note that the relatively high ratio at 22.2 GHz was also seen at three epochs of VLBA observations of PKS 0528+134 by Ojha et al. (Ojha04 (2004)). These corrections to the absolute flux densities at different frequencies are applied in Sect. 3.2, where the spectral indexes of VLBI components are estimated.
| Component | Flux(Jy) | Separation(mas) | (deg) | Major(mas) | Axial ratio | (deg) | Tb(k) |
| (1) | (2) | (3) | (4) | (5) | (6) | (7) | (8) |
| 2.3 GHz, | |||||||
| k | 0 | 0 | 1.0 | ||||
| a | 1.0 | ||||||
| f | 1.0 | ||||||
| g | 1.0 | ||||||
| n1 | 1.0 | ||||||
| 5.0 GHz, | |||||||
| k | 0 | 0 | |||||
| a | |||||||
| f | |||||||
| g | |||||||
| 8.4 GHz, | |||||||
| k | 0 | 0 | |||||
| a | |||||||
| f | |||||||
| g | 1.0 | ||||||
| 15.4 GHz, | |||||||
| k | 0 | 0 | 1.0 | ||||
| n2 | 1.0 | ||||||
| a | 1.0 | ||||||
| f | 1.0 | ||||||
| 22.2 GHz, | |||||||
| k | 0 | 0 | |||||
| n2 | 1.0 | ||||||
| a | 1.0 | ||||||
Notes: Col. (1): component registration, col. (2): component’s flux density in Jy, col. (3): component’s separation from core component k in mas, col. (4): component’s position angle relative to k from north to east in degree, col. (5): major axis of elliptical Gaussian component in mas, col. (6): ratio of the minor to major axis of elliptical Gaussian component, col. (7): position angle of the major axis of the elliptical Gaussian component from north to east in degree, col. (8): brightness temperature in K according to the formula given by Shen et al. (1997).
3 Results
The main results are given in this section beginning with the jet components and an analysis of the jet morphology in Sect. 3.1. Then in Sect. 3.2, the core is identified through an analysis of the spectra of the jet components, and we also give the fitting to the spectrum of the core. In Sect. 3.3, we study the kinematics of three jet components and discuss the ejections of the jet components. Last in Sect. 3.4, we try to use the helical model in S95 to describe the jet structure.
3.1 Registrations of jet components and morphology
After carefully analyzing the positions of each component at the five frequencies the registrations of the components are given in the first column of Table 1. From Fig. 1 and Table 1, we can see that component k in the south end is the most compact one and has the highest brightness temperature. B99 assumed it is the core, but we confirm it as the core from its spectral characteristics in the next subsection. The reason that n1 component is not detected at frequencies higher than 2.3 GHz is probably due to its extended and weak structure. The separations of component n2 from k at both 15.4 and 22.2 GHz are less than 0.3 mas. By considering that it is bigger than 0.3 mas size at frequencies lower than 15.4 GHz, we think that k component at 2.3, 5.0, and 8.4 GHz in fact contains n2 component. Therefore the flux densities at 2.3, 5.0, and 8.4 GHz for k component actually include n2 emission. We treat n2 as a new component. Our VLBA maps at 15.4 and 22.2 GHz also indicate that there seems to be a new but quite weak component between components a and n2, about 0.65 mas from the core at P.A. 50. However, the inclusion of this component affects the model fitting little, so we defer this to future observations. We also note that the map at 5 GHz in Fig. 1 shows a very elongated component g. We tried to add an additional component in the model fitting. The fitted new component is very weak (5 mJy) and has little effect on the fitting results. Thus, for simplicity we adopt component g only to represent the overall extended structure at 5 GHz (see Table 1).
It can be seen from the maps that the overall morphologies at each frequency are similar, they all extend in the north east direction with a moving tendency along the P.A.. It can also be seen from Table 1 that the jet’s P.A. changes from about at a separation from k component about 0.3 mas to at a separation about 1.4 mas and then to at a separation about 8 mas, clearly indicating the presence of jet bending. K95 obtained maps at 8, 22, 43, and 86 GHz, which enabled them to trace the jet down to sub-mas scale, and found a 60-90 misalignment between the sub-mas and mas-structures. B99 found from their 8-year-long monitoring data of 8 GHz geodetic VLBI observations that the bending appears more pronounced near the core area (1.5 mas) than farther away, and the jet appears to bend twice within the inner 1.5 mas. These results are consistent with ours, except that our P.A. misalignment of 25 is less than that seen by K95. Combined with the data in Table 3 in B99, we can see that almost every component’s P.A. decreases with the increasing separation from k until the P.A. reaches about 20. We refer this to as the position angle regression. In Sect. 3.4 we will try to interpret the position angle regression using the helical model proposed by Steffen et al. (Steffen95 (1995), hereafter S95).
3.2 Identfication of the core and the spectra of other components
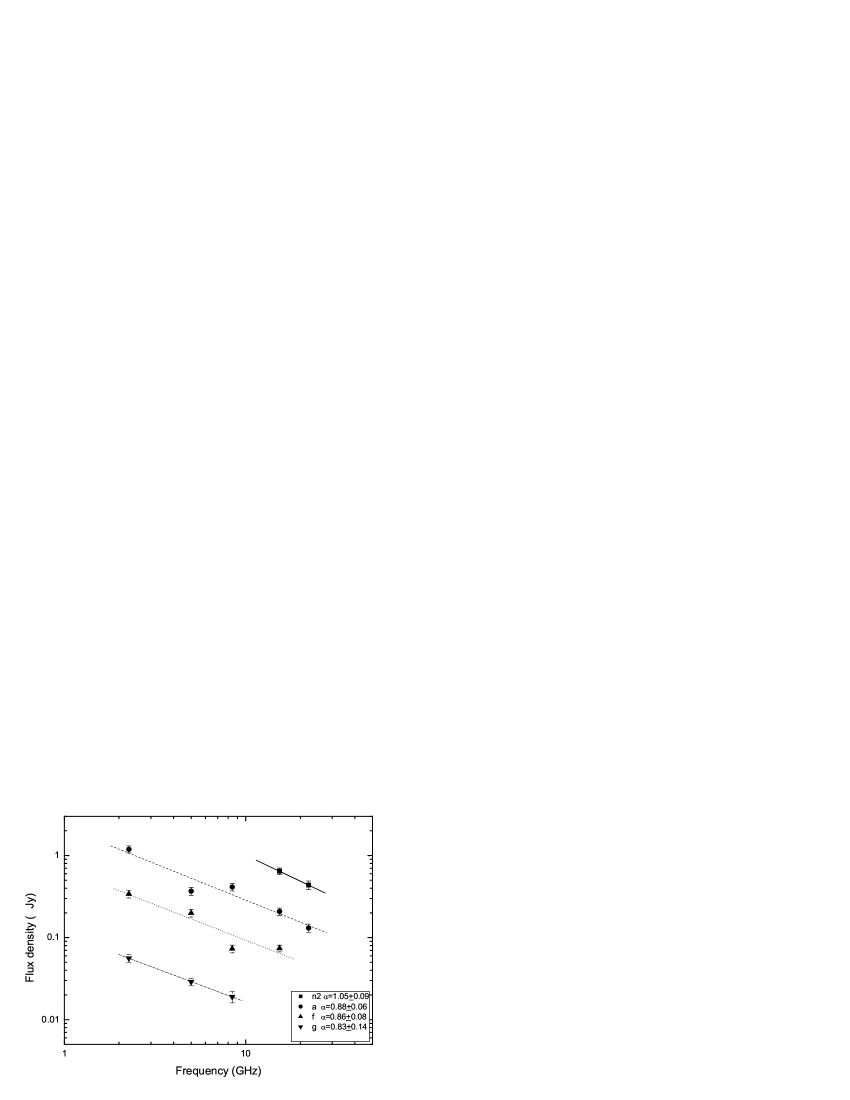
The multi-frequency data can be used to study the spectra of the jet components. The spectra of the k component and other components are plotted in Fig. 2 and Fig. 3, respectively. Note that we have applied the absolute flux density correction when calculating the spectral indexes. There is a spectral turnover for the component k (Fig. 2). Its spectral index between 15.4 and 22.2 GHz is , much flatter than any other components (Fig. 3). Component k is thus identified with the core. The identification of the core is important because it is thought to be related to the central engine in the AGN, and in general the jet is thought to be ejected from the core, powered by the central engine that is responsible for the activity of AGN. Other VLBI components (n2, a, f, and g) all have a typical, optically thin spectra (Fig. 3), consistent with the core identification. The flux density of n2 at 2.3, 5.0, and 8.4 GHz, extrapolated from its spectral measurements at 15.4 and 22.2 GHz without considering the spectral turnover, would be 4.76, 2.10, and 1.22 Jy, respectively. At 2.3 GHz, this is much greater than the flux density of 0.53 Jy for component k, which is contradicted by the emission of n2 being included in the emission of k at 2.3 GHz. Thus, the spectrum of n2 must be inverted at a frequency higher than 2.3 GHz.

Furthermore, we simply try to fit the spectrum of the k component by using the synchrotron self-absorption (SSA) and free-free absorption (FFA) formula. According to Kameno et al. (Kameno00 (2000)), the SSA formula is
where is the flux density in Jy at 1 GHz when the SSA optical depth at 1 GHz , and is the optically thin spectral index. The FFA formula is
where is the flux density in Jy at 1 GHz extrapolated from the optically thin spectrum, and is FFA optical depth at 1 GHz. Assuming is known to be 0.30, we list the fitting results in Table 2 with the corresponding fitting curves also plotted in Fig. 2. The inverted spectrum can be fitted equally well by both absorption models. It can be seen in Fig. 2 that the spectral turnover happens at about 6.95 GHz with the corresponding flux density 1.93 Jy. Using the relation for the SSA model (Kellermann & Pauliny Kellermann81 (1981)), we can estimate a constant magnetic field mG in the core region. Here GHz, Jy and mas are used. Following Marscher (Marscher87 (1987)), we adopt as the angular diameter of the core, where and are the major and minor axes of the Gaussian component. Since there is no VLBI size measurement at GHz, the adopted mas is an arithmetic average of the sizes at 5.0 and 8.4 GHz. The synchrotron cooling age is estimated to be at least yrs using the expression (e.g., Rybicki & Lightman RL79 (1979)). Here, B=0.35 mG, the turnover frequency in the source rest frame =21.33 GHz (after correcting the cosmological redshift effect), and the angle between the electron velocity and magnetic filed =.
| Model | (Jy) | ||
|---|---|---|---|
| SSA | 1.17 | ||
| FFA | 1.78 |
3.3 Proper motion and component ejection
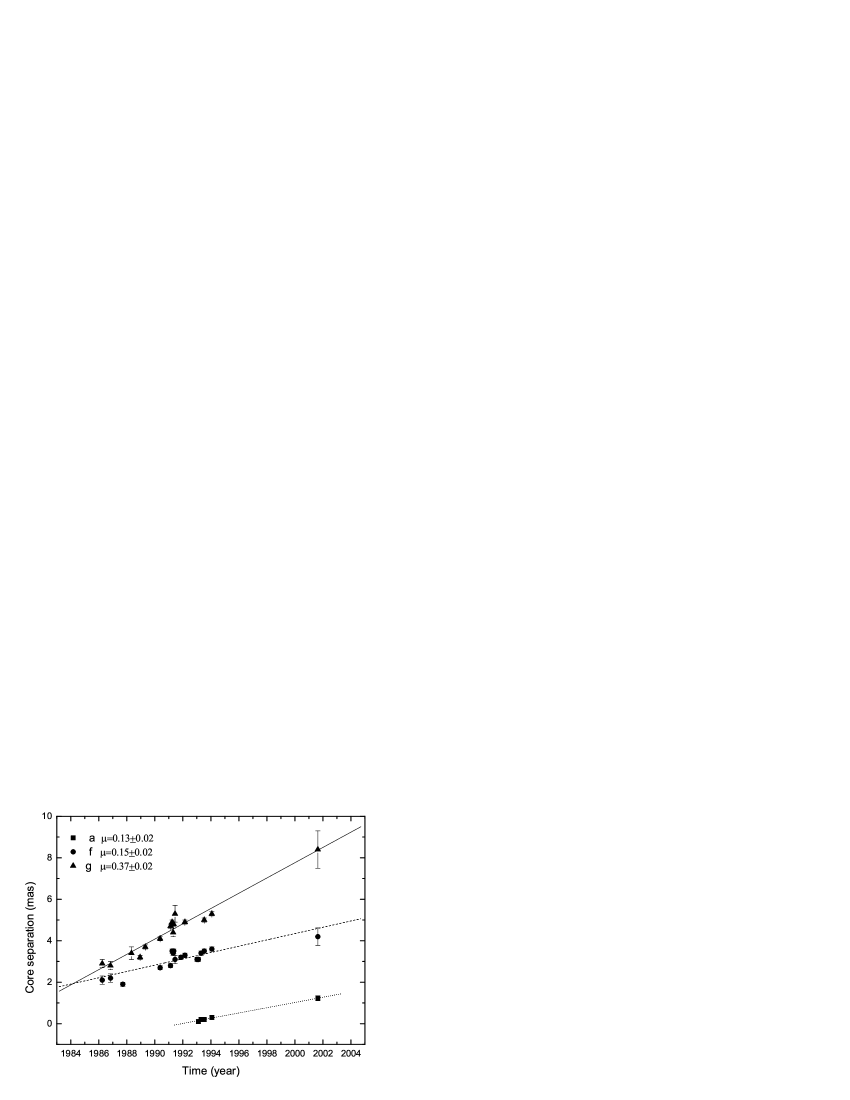
To find the relations between the seven components in B99 and the components in our paper, we extrapolate the proper motions of the seven components in B99 to our observing time and find that the positions of a, f, and g components in B99 are near the positions of our a, f and g, so we think that our a, f, and g are the same as a, f, and g in B99. This is also the reason we used the same component registration. The counterparts to other components (b, c, d, and e) in B99 are not found in our VLBA observations. Figure 4 shows the linear fit to the separations from the core of these VLBI jet components a, f, and g at 8.4 GHz. All the data before 2001.64 are from B99. Table 3 lists the proper motion values of each component; due to the non-detections of b, c, d, and e in our observations, the proper motion values of components b, c, d, and e are from B99, but their apparent velocities are re-calculated using the new cosmological constants ( kms-1 Mpc-1, , and ). It can be seen from Table 3 that the proper motion of the outmost component g (see Fig. 1) becomes about 3 times faster than those of other inner jet components a, b, c, d, e, and f, which are essentially the same about 10.2-12.7c within errors.
| ID. | a | b | c | d | e | f | g |
|---|---|---|---|---|---|---|---|
Usually, the ejection of a new VLBI component can be related to a flux outburst in the light curve (e.g. K95; B99), therefore, we also relate the ejection of n2 to one burst. Assuming that there is no big difference in proper motion between n2 and other components, we adopt 0.13 mas/yr (see Table 3) as the proper motion for n2. Thus the ejection (zero-separation) epoch of n2 is roughly around 1999.5. This just falls into a burst duration from 1999 to 2000.5 shown on the well-sampled light curves of PKS 0528+134 at 22 and 37 GHz (Teräsranta et al. Terasranta05 (2005)), suggesting that the ejection of n2 may be related to this radio burst, which peaks at about 2000. Likewise, the ejection epoch of component a is estimated to be about 1991.940.18 from its proper motion 0.13 mas/yr. This ejection epoch is consistent with the 1992.10.4 found by B99. Based on the radio light curve at 8 GHz (Fig. 5 in B99), B99 found that the ejection epoch of component a was near the beginning of the radio burst peaking around 1993.6, so they related the ejection of component a to this radio burst, which is preceded by a gamma-ray burst peaking at about 1993.23 (Mukherjee et al. Mukherjee99 (1999)). But the light curves at 22 and 37 GHz (Teräsranta et al. Terasranta05 (2005)) show another radio burst peaking at about 1992.32, and the flux-density variation at millimeter-bands shows a flux-density burst at about 1991.94 (K95), so we cannot exclude the possibility that the radio burst peaking at about 1992.32 or 1991.94 may be related to the ejection of component a. The relations between the ejection of a new VLBI component and the flux-density bursts at radio and gamma-ray bands deserve more study to ascertain which flux-density burst is related to the ejection of the new VLBI component.
3.4 Helical pattern of the jet structure
VLBI observations have revealed a helical structures in some AGNs, e.g., 3C 345 (S95), 3C 120 (Hardee et al. Hardee05 (2005)), and Mkn 501 (Villata & Raiteri Villata99 (1999)). Two bendings of the jet in PKS 0528+134 on the mas scale indicate the possible presence of the helical trajectory in PKS 0528+134. The helical structure may result from the orbital motion in a binary black-hole system, Newtonian precession, internal jet rotation, or global helical magnetic fields (e.g. Rieger Rieger05 (2005)). S95 discussed the jet component’s kinetics in detail through their helical models by using the conservation laws for kinetic energy, angular momentum, momentum, and jet opening angle.
Any three conservation quantities can give a jet trajectory, so there are four possible models. The first model assumes the conservations of momentum along the jet axis , the kinetic energy , and the specific angular momentum , and gives a rotational hyperboloid with less than a quarter revolution. The second model assumes the conservations of , , and the opening angle , and gives a helical trajectory; but the helix is self-similar in space and time, and its helical amplitude is not dampened. The third model assumes the conservations of , , and , and gives a helical trajectory that is not self-similar but has an asymptotic behavior; i.e., the pitch angle of the helix is the smallest at the origin, and it opens along the jet axis. The fourth model assumes the conservations of , , and and gives a similar trajectory to the one in the third model. The major difference between the third and fourth models lies in how the third model predicts a high level of component speeds as a component separates from the core. S95 applied the third model to fit the trajectories of C4 and C5 in 3C 345 simply because this model reflects the basic character of the trajectories and motion observed in 3C 345. From Sect. 3.1 we know that the jet in PKS 0528+134 experiences two bends, and there is a position-angle regression phenomenon for the P.A.s of the jet components, so obviously the first and second models are not applicable to the case of PKS 0528+134. From Table 3 we can find that the apparent velocities of the jet components of PKS 0528+134 remain on a high level as the components separate from the core and appear to increase with distance from the core, so we reject the fourth model and adopt the third model to describe the bending trajectory of the jet in PKS 0528+134.
The corresponding sets of equations for the third model in the cylindrical coordinates , and , are:
| (3) | |||||
| (4) | |||||
| (5) |
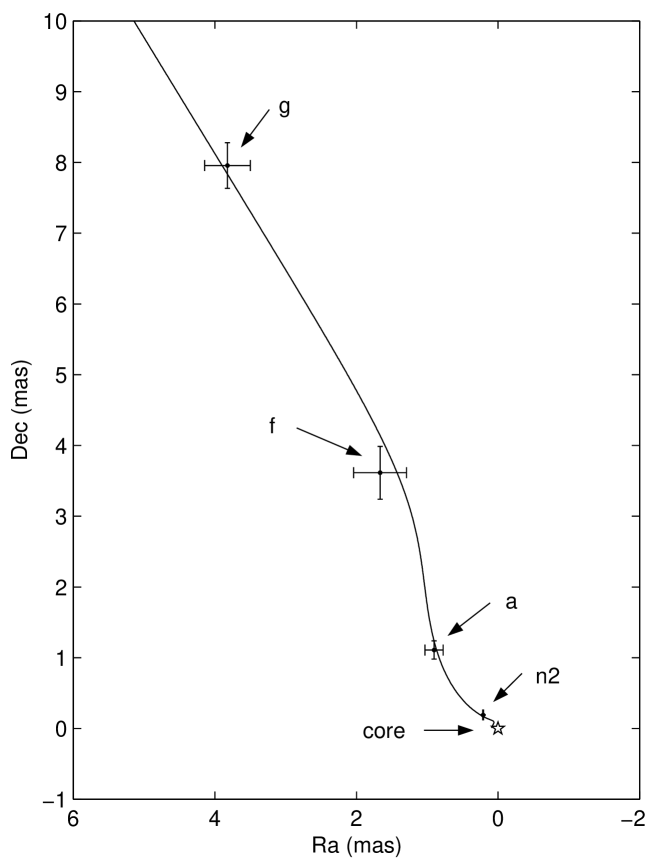
where sin, , , is the jet component’s intrinsic velocity in units of the light speed, and , and are the initial coordinates of the jet component (for simplicity, we set ). The best fit is not given here because the currently available observational data points are not enough to constrain the evolution of the VLBI jet position with time, which requires 10 parameters to describe (S95). We show an approximate fit in Fig. 5, which is obtained through gradually adjusting the fitting parameters to minimize the difference between the fitted trajectory and the observed data points. Some important fitting parameters are: the angle between the line of sight and the axis of cone is 3, the intrinsic velocity , the conical half opening angle , mas, and the initial angular velocity /yr. According to the relativistic beaming model, , where is the apparent velocity in units of the speed of light, and is viewing angle to the moving direction of the jet. The allowable maximal value of is (Pearson & Zensus Pearson87 (1987)), so when =13, =8.8. Therefore, our choice of a viewing angle of 3 in Fig. 5 is reasonable. We can also estimate a Doppler factor from . When , this gives , close to the value of 17 from ( is Lorentz factor) when using . We thus feel that the fit shown in Fig. 5 is physically reasonable.
Furthermore, this model can be used to explain the position-angle regression discussed in Sect. 3.1. Since is conservative ( is the velocity of the jet component rotating around the conical axis), is decreasing with the increasing r when the jet component is moving out along the conical surface. By differentiating Eq. (3), one can obtain the radial velocity component , which is perpendicular to and and which increases with the time. Similarly, from Eq. (4), one can get , which increases much faster than as tan; i.e., is mainly converted to . There is thus a reacceleration process of the velocity component moving along the jet axis, and finally the motion of the jet component is dominated by . Thus, the jet component moves just about along the conical axis, and the P.A. barely varies when the jet component moves into the outer region of the jet; i.e., the moving direction on the map of the jet component regresses to the projected direction of the cone axis on the sky.
4 Discussion
Our quasi-simultaneous VLBI observations at five frequencies allow us to study the spectral distribution of PKS 0528+134 for the first time. From the light curves at 22 and 37 GHz (Teräsranta et al. Terasranta05 (2005)), we can see that our observing time 2001.64 PKS 0528+134 is in the quiescent state, so the spectral distribution represents the spectral distribution of PKS 0528+134 in its quiescent state. The identification of the core in VLBI analysis is important because the registration, tracing, and kinematic analysis of the jet components are all based on such a core identification. B99 assumed that the brightest and most compact component at the southern end of the jet was the core, based on how all other VLBI components seemed to move away from it, and how it showed a pronounced flux density variation and an inverted spectrum (Pohl et al. 1995).
Our spectral analysis indicates that component k has a flat spectral index, , with the spectrum inverted at 6.95 GHz, consistent with the k component being the compact core. According to the SSA theory, the separation of an optically-thin jet component to the core increases with the increasing frequency (Lobanov Lobanov98 (1998)). However, due to large uncertainties in the position determination in our observations, we cannot tell whether there is such a core-position offset in PKS 0528+134. Phase-referenced VLBI observations can achieve a high positional precision of tens of microarcsecond (Ros Ros03 (2003)) and can thus be used to study the absorption mechanism in the core region of PKS 0528+134 through investigating the frequency-dependent position offset.
By tracing the components in B99, we find our a, f, and g components are identical to the a, f, and g components in B99. All three components show high apparent velocities, especially g up to 31.3c. The ejection times of component a and the newly detected n2 component can be estimated from the extrapolation of the proper motions to their zero separations from the core. The ejection of n2 at about 1999.5 could be related to the radio burst peaking at about 2000, but we cannot be sure which flux-density burst is related to the ejection of component a. We can see from the light curves at 22 and 37 GHz given by Teräsranta et al. (Terasranta05 (2005)) that there are six significant flux-density outbursts before our observation at epoch 2001.64, but only two outbursts could be related to the ejections of VLBI components. The reason that not every flux density outburst corresponds to an ejection of a VLBI component could be that the related VLBI components are too weak or have reached its radiation loss time before our observations. Also it is not so clear whether or not every outburst can be related to the ejection of a VLBI component.
According to the morphology of PKS 0528+134, we assume for the first time that it has a helical structure. New VLBA observations at 15 GHz (Lister & Homan Lister05 (2005)) have also confirmed the presence of a bending jet structure in PKS 0528+134. We used the third helical model in S95 to describe the jet trajectory in PKS 0528+134. S95 fitted this helical model to the trajectories of C4 and C5 in 3C 345. In 3C 345 there is a component, 18 mas from the core, whose P.A. is different from the P.A.s of its inner components by 20 (Unwin & Wehrle Unwin92 (1992)), which is contrary to the general prediction of this helical model that the jet component will move close to the jet axis little by little; i.e., there is a position-angle regression. Because of this, S95 only restricted their analysis to the inner 3 mas from the core. Our VLBA observations at 2.3 GHz (Fig. 1) show that there is no obvious P.A. change for the external jet components of PKS 0528+134. We then can apply this helical model to the jet of PKS 0528+134 until 20 mas from the core since there is no abrupt P.A. change for the external jet components as seen in 3C 345. Some core-dominated radio sources even show 90 misalignment between the P.A.s of the VLBI and VLA scale jets (Conway & Murphy Conway93 (1993)), which is difficult to explain by the helical model we adopted. Conway & Murphy (Conway93 (1993)) used their low-pitch helical model to explain this phenomenon, but this model is difficult to explain the several bends at the VLBI scale in radio sources like PKS 0528+134 and 3C 345. We think that the tremendous change of the P.A. on a large scale may be due to the interactions between the jet and ambient medium of the host galaxy or another external force performed on the jet, so the angular momentum conservation required by the helical model we used in Sect. 3.4 is violated. Additional dynamical analysis would be required in order to study the large-scale jet structure. Except that many extragalactic radio sources have the helical jets, recent VLBI observations show that some microquasars in our Galaxy also have these helical patterns. For example, both GRO J1655-40 (Hjellming & Rupen Hjellming95 (1995)) and SS433 (Blundell & Bowler Blundell04 (2004)) exhibit the helical jets.
We know from the analysis of the helical model that the velocity of jet component is dominated by the velocity component along the cone axis, i.e., . According to the helical jet model, should first increase rapidly and then approach its theoretical value gradually if the angle between the line of sight and the z-axis is constant. From Fig. 4 we find it impossible that the apparent velocities of components a and f are reaccelerated to that of component g by this helical model. A more realistic situation could be that the velocity component s of these jet components have been accelerated shortly after their emergence, and that the initial ejected velocity of g component is bigger than others’. Obviously, this scenario requires a very good time coverage of high-resolution VLBI observations to test it, especially during the period when the jet component is initially ejected.
5 Conclusions
The five high-resolution VLBI maps made at frequencies 2.3, 5.0, 8.4, 15.4, and 22.2 GHz show that PKS 0528+134 has a jet structure extending in the north east direction, and the jet bending is clearly seen at about 0.3 and 1.4 mas from the core. Our registration of VLBI components a, f, and g is consistent with the one in B99. We also detect a new VLBI jet component n2, which is likely to be ejected during the radio burst at about 1999.5. We estimate the ejection epoch of component a to be 1991.94 by the linear back-extrapolation of its proper motion, but cannot determine which flux-density burst is truly related to the ejection of component a. No counter-jet is seen in our maps, but its existence cannot be ruled out. We also find that the position angles of the jet components in PKS 0528+134 are large when they are initially ejected from the core, but gradually decrease with the increasing separation from the core until about 25, which is referred to as the position angle regression.
This first quasi-simultaneous VLBA observations at five frequencies provide a good condition to calculate the spectra of the jet components without taking the variations of the flux densities with the time into account. We identify k component as the core mainly based on its flat spectral index of and an inverted spectrum peaking at about 6.95 GHz. But we cannot determine which absorption mechanism (SSA, FFA, or others) is mainly responsible for the observed inverted spectrum; future low-frequency observation with sufficient spatial resolution may be useful for distinguishing these possible models. The brightness temperature of each component is given in Table 1; the brightness temperature of core component k does not exceed the equipartition brightness temperature cutoff of K (Readhead Readhead94 (1994)) if we take the Doppler boosting effect into account. The presence of fast superluminal motions indicates that the relativistic effects are important in this source.
We attempt to describe the trajectory of the jet in PKS 0528+134 using the helical jet model proposed by S95. The parameters of kinetics obtain from this helical model are consistent with ones from observations. We find from this helical model that there is a reacceleration process of the velocity component along the jet axis and that the jet finally moves nearly along the jet axis, which can be used to explain the position-angle regression. Since the reacceleration process in this helical model cannot explain this big difference in the jet’s velocities, we suggest further that a much higher apparent velocity of g component than its inner components’ may be due to the relatively higher initial velocity of g component than its inner components. To understand the reacceleraton process well in this helical model needs a good time coverage of high-resolution VLBI observation just as the jet component ejects.
Acknowledgements.
We thank the anonymous referee for critical comments and helpful suggestions on the manuscript. This research made use of data from the University of Michigan Radio Astronomy Observatory, which is supported by the University of Michigan and the National Science Foundation. The Green Bank Interferometer is a facility of the National Science foundation operated by NRAO with support from the NASA High Energy Astrophysics program. This work was supported in part by the National Natural Science Foundation of China (grant 10573029). Z.-Q. Shen acknowledges support by the One-Hundred-Talent Program of the Chinese Academy of Sciences.References
- (1) Blundell K. M. & Bowler M., 2004, ApJ,616, L159
- (2) Britzen S., Witzel A., Krichbaum T. P., Witzel A. & Qian S. J., 1999, A&A, 341, 418 (B99)
- (3) Charlot P. 1990, A&A, 229, 51
- (4) Condon J. J., Hicks P. D. & Jauncey D. L., 1977, AJ, 82, 692
- (5) Conway J. E. & Murphy D. W., 1993, ApJ, 411, 89
- (6) Ghosh K. K., Ramsey B. D., Sadun A. C. & Soundararajaperumal S., 2000, ApJ, 127, 11
- (7) Hardee P. E., Walker R. C. & Gomez J. L., 2005, ApJ, 620, 646
- (8) Hjemliming R. M. & Rupen M. P., 1995, Nature, 375, 464
- (9) Hunter S. D., Bertsch D. L., Dingus B. L., et al., 1993, ApJ, 409, 134
- (10) Kameno S., Horiuchi S., Shen Z.-Q., et al., 2000, PASJ, 52, 209
- (11) Kellermann K. I., & Pauliny-Toth I. I. K., 1981, ARA&A, 19, 373
- (12) Krichbaum T. ., Britzen S., Standke K. J., Witzel A., Schalinski C. J. & Zensus J. A., 1995, Proc. Natl. Acad. Sci., 92, 11377 (K95)
- (13) Lister M. L. & Homan D. C., 2005, AJ, 130,1389
- (14) Lobanov A. P., 1998, A&A, 330, 79
- (15) Lovell J. 2000, in Astronomical Phenomena Revealed by Space VLBI, eds. H. Hirabayashi, P.G. Edwards, & D.W. Murphy, ISAS, Tokyo, 301
- (16) Marscher A., 1987, in Superluminal Radio Sources, ed. J. A. Zensus, & T.J. Pearson (Cambridge University Press), 280
- (17) Mukherjee R., Dingus B. L., Gear W. K., et al., 1996, ApJ, 470, 831
- (18) Mukherjee R., Bertsch D. L., Bloom S. D., et al., 1997, ApJ, 490, 116
- (19) Mukherjee R., Böttcher M., Hartman R. C., et al., 1999, ApJ, 527, 132
- (20) Ojha R., Homan D. C., Roberts D. H., et al., 2004, ApJS, 150, 187
- (21) Pearson, T. J. & Zensus, J. A. 1987, in Superluminal Radio Sources, ed. J. A. Zensus, & T. J. Pearson (Cambridge University Press), 1
- (22) Peng B., Nan R., Kraus A., et al., 2001, ApJ, 551, 172
- (23) Perley R. A., 1982, ApJ, 87, 859
- (24) Pohl M., Reich W., Krichbaum T., et al., 1995, A&A, 303, 383
- (25) Readhead A. C. S., 1994, ApJ, 426, 51
- (26) Rieger F. M., 2005, ChJAA, 5S, 305
- (27) Ros E., 2003, Future Directions in High Resolution Astronomy: A Celebration of the 10th Anniversary of the VLBA, ed. J. D. Romney and M. J. Reid., 54
- (28) Rybicki G. B., & Lightman A. P., 1979, Radiation Processes in Astrophysics (New York: Wiley-Interscience)
- (29) Schwab F. R. & Cotton W. D., 1983, AJ, 88, 688
- (30) Shen Z.-Q., Wan T. S., Moran J. M., et al., 1997, AJ, 114, 1999
- (31) Shen Z.-Q., Shang L.-L., Cai H.-B., et al., 2005, ApJ, 622, 811
- (32) Shepherd M.C., 1997, in ASP Conf. Ser. 125, Astronomical Data Analysis Software and Systems VI, ed. G. Hunt & H. E. Payne (San Francisco: ASP)
- (33) Spergel D. N., Verde L., Peiris H. V., et al., 2003, ApJS, 148, 175
- (34) Steffen W., Zensus J. A., Krichbaum T. P., Witzel A. & Qian S. J., 1995, A&A 302, 335 (S95)
- (35) Teräsranta H., Achren J., Hanski M., et al., 2005, A&A, 427, 769
- (36) Unwin S. C. & Wehrle A. E., 1992, ApJ, 398, 74
- (37) Villata M. & Raiteri C. M., 1999, A&A, 347,30
- (38) Wall J. V. & Peacock J. A. 1985, MNRAS, 216, 173
- (39) Whiting M. T., Majewski P. & Webster R. L., 2003, Publicatons of the Astronomical Society of Austrania, 20, 196
- (40) Zhang Y. F., Marscher A. P., Aller H. D. et al., 1994, ApJ, 432, 91