On spatial distributions of old globular clusters in clusters of galaxies
Abstract
We investigate structural properties of old, metal-poor globular clusters (GCs) formed at high redshifts () and located inside and outside virialized galaxy-scale halos in clusters of galaxies with the total masses of based on high-resolution cosmological simulations with models of GC formation. We mainly derive the parameter dependences of physical properties of intracluster GCs (ICGCs) based on the results of 14 cluster models. Our principle results are summarized as follows.
(1) ICGCs are formed as a result of tidal stripping of GCs initially within galaxy-scale halos during hierarchical growth of clusters via halo merging. These ICGCs comprise 20-40 % of all GCs in clusters with and the number fraction of ICGCs does not depend on for the above cluster mass range.
(2) The projected radial density profiles () of ICGCs in clusters with different can be diverse, though ICGCs have inhomogeneous, asymmetric, and somewhat elongated distributions in most models. If , ranges from to for GCs in clusters with the above mass range.
(3) Although total number of GCs within the central 0.05 Mpc () and 0.2 Mpc () are diverse in different clusters, they can depend weakly on in such a way that both and are likely to be larger for clusters with larger .
(4) Total number of GCs per cluster masses (specific frequency of GCs for clusters of galaxies) are more likely to be larger in more massive clusters, mainly because a larger number of earlier virialized objects can be located in more massive clusters.
(5) Radial density distributions of all GCs including ICGCs and galactic GCs have steeper profiles than those of the background dark matter halos in the central regions of clusters (kpc) with different .
(6) Spatial distributions of old GCs in clusters can depend on the truncation epoch of GC formation () such that they can be steeper and more compact in the models with higher .
(7) The mean metallicity of ICGCs in a cluster can be smaller than that of GCs within the cluster member galaxy-scale halos by in [Fe/H]. Metallicity distribution functions (MDFs) of ICGCs show peak values around [Fe/H] and do not have remarkable bimodality.
keywords:
globular clusters: general – galaxies: star clusters — galaxies: elliptical and lenticular — galaxies:evolution – galaxies: interactions1 Introduction
Structural, kinematical, and chemical properties of globular cluster systems (GCSs) have long provided valuable clues to the better understanding of how galaxies form and evolve (e.g., Harris 1991; West et al. 2004). In particular, the specific frequencies (), colour bimodality, and structural properties of GCSs have been discussed extensively in many different contexts of galaxy formation (e.g., Searle & Zinn 1978; Forbes et al. 1997; Ashman & Zepf 1998; Brodie et al. 1998; Côte et al. 2001; Beasley et al. 2002; Bekki et al. 2002). The physical properties of globular clusters (GCs) however have not been so far considered as fossil records that contain valuable information on how groups and clusters of galaxies were formed and evolved. Furthermore, GC properties characteristics of giants Es located in the central regions of clusters (e.g., very high ) have not been extensively discussed in the context of cluster formation processes via hierarchical merging of smaller groups and clusters of galaxies.
| INGC | INtergalactic GCs |
|---|---|
| ICGC | IntraCluster GCs |
| IGGC | IntraGroup GCs |
| GGC | Galactic GCs |
| (1) | (2) | (3) | (4) | (5) | (6) | (7) | (8) | (9) |
| Model no. 111The results of the cluster-scale halos with the total masses () larger than are described. | () | 222Total number of GCs in a cluster-scale halo. | 333Specific frequency of cluster GCs. This is defined as total GC number per mass for a cluster of galaxies and given in units of . | (Mpc) | (Mpc) | 444Total number of GCs within 0.05 Mpc. | 555Total number of GCs within 0.2 Mpc. | |
| CL1 | 6.5 | 6868 | 0.11 | 0.026 | 0.76 | 0.29 | 1098 | 2084 |
| CL2 | 3.1 | 3449 | 0.11 | 0.014 | 0.21 | 0.31 | 962 | 1699 |
| CL3 | 2.9 | 3248 | 0.11 | 0.026 | 0.51 | 0.40 | 479 | 947 |
| CL4 | 2.3 | 3788 | 0.17 | 0.012 | 0.12 | 0.18 | 1348 | 2262 |
| CL5 | 2.0 | 2251 | 0.11 | 0.013 | 0.50 | 0.27 | 597 | 944 |
| CL6 | 1.8 | 2214 | 0.13 | 0.011 | 0.33 | 0.24 | 766 | 1052 |
| CL7 | 1.7 | 2197 | 0.13 | 0.068 | 0.32 | 0.37 | 145 | 762 |
| CL8 | 1.5 | 1905 | 0.12 | 0.030 | 0.23 | 0.27 | 292 | 883 |
| CL9 | 1.4 | 1685 | 0.12 | 0.013 | 0.24 | 0.25 | 470 | 801 |
| CL10 | 1.3 | 1649 | 0.13 | 0.028 | 0.31 | 0.29 | 311 | 717 |
| CL11 | 1.2 | 1347 | 0.11 | 0.028 | 0.23 | 0.29 | 224 | 620 |
| CL12 | 1.1 | 795 | 0.07 | 0.035 | 0.37 | 0.35 | 104 | 235 |
| CL13 | 1.0 | 1580 | 0.15 | 0.029 | 0.33 | 0.31 | 248 | 640 |
| CL14 | 1.0 | 1042 | 0.10 | 0.028 | 0.34 | 0.28 | 186 | 444 |
Observational studies of GCs in clusters of galaxies have suggested that there can be a population of GCs that are bounded by cluster gravitational potentials rather than those of cluster member galaxies (e.g., White 1987; Bassino et al. 2002, 2003; Jordán et al. 2003). Marín-Franch & Aparicio (2003) investigated whether these intracluster GCs (“ICGCs”) exist in the Coma cluster using surface brightness fluctuations, and concluded that ICGCs are highly unlikely to exist in the Coma. West et al. (1995) suggested that the observed large variations in GC number (or ) between central giant Es in different clusters are due to the existence of a population of GCs that are not bounded to individual galaxies but move freely throughout the core of clusters galaxies. If very high in central Es in some clusters (e.g., Abell 2052) are due to larger number of ICGCs in the clusters, it is an essentially important question why only some clusters of galaxies contain larger number of ICGCs.
A new type of sub-luminous and extremely compact “dwarf galaxy” has been recently discovered in an ‘all-object’ spectroscopic survey centred on the Fornax Cluster (Drinkwater et al. 2000; 2003). These “dwarf galaxies”, which are members of the Fornax Cluster, have intrinsic sizes of 100 pc and absolute band magnitude ranging from to mag and are thus called “ultra-compact dwarf” (UCD) galaxies. Structural and kinematical studies of this new population of very bright “star clusters” have also suggested that these clusters can be also freely floating intracluster objects (Mieske et al. 2004; Drinkwater et al. 2005; Jones et al. 2005). The observed compact spatial distribution and smaller velocity dispersion of this possible intracluster population in the Fornax cluster has not been clearly explained in a self-consistent manner by previous theoretical studies (e.g., Jones et al. 2005).
Physical properties of intracluster stellar objects such as ICGCs and PNe are considered to be sensitive to dark matter properties and cluster-related physical processes (e.g., tidal stripping of GCs and hierarchical growth of clusters) and thus provide some fossil information on formation of galaxies and clusters of galaxies (e.g., Arnaboldi 2004 for a recent review). However there has been little theoretical and numerical works carried out as to how ICGCs are formed in clusters environments (e.g., Forte et al. 1982; Muzzio 1987; Bekki et al. 2003). These previous models showed that tidal stripping of GCs from cluster member galaxies though galaxy-galaxy and galaxy-cluster interaction is a mechanism for ICGC formation. These previous works however used fixed gravitational potentials of already virialized clusters and accordingly could not discuss how ICGCs in a cluster are formed as the cluster grows through hierarchical merging of smaller groups and clusters.
These previous observational and theoretical studies have raised many questions, the most significant being: (i) How are ICGC formed under the currently favored cold dark matter (CDM) theory of galaxy formation ? (ii) What physical properties can ICGCs have if their formation is closely associated with hierarchical formation of clusters ? (iii) Are there any correlations between physical properties of ICGCs and global properties (e.g., masses and X-ray temperature) of their host clusters of galaxies ? (iv) Is the origin of very high of central giants Es in some clusters closely associated with the formation processes of clusters of galaxies (e.g., galaxy accretion from fields) ? and (v) Are there any differences in radial distributions and kinematics between UCDs and ICGCs ?
In order to answer these questions in a fully self-consistent manner, we need to model both (1) dynamical evolution of GCs (e.g., tidal stripping and accretion of GCs) during hierarchical growth of clusters of galaxies and (2) formation of GCs at low and high redshifts in clusters environments. Although recent high-resolution cosmological N-body simulations with total particle number of (e.g., Yahagi & Bekki 2005; YB) can allow us to address the above point (1), our poor understanding of the above point (2) on physical conditions required for GC formation in galaxies (e.g., Ashman & Zepf 1998) would make it difficult for us to have robust conclusions for the above five problems. However, considering recent significant development in observational studies on GCs in nearby clusters (e.g., Dirsch et al. 2003; Jordán et al. 2003; Richtler et al. 2004), it is still doubtlessly worthwhile to provide some theoretical predictions that can be tested against these latest and future observational results.
The purpose of this paper is thus to investigate extensively physical properties of GCs in clusters of galaxies based on high-resolution cosmological simulations that can follow both hierarchical growth of clusters through merging of smaller subhalos and dynamical evolution of old GCs. We particularly investigate global ( Mpc scale) density distributions and kinematics both for ICGCs and for GCs that are within galaxy-scale halos in clusters (referred to as “GGCs” for convenience). Because of some uncertainty in the modeling of the formation processes of young, metal-rich GCs (e.g., Bekki et al. 2002), we investigate physical properties of cluster GCs that were formed at high redshift . Accordingly, the present study is regarded as only the first step toward better understanding the nature of GCs in clusters of galaxies: The results of our simulations may well be compared with observations on “blue GCs” in a more reasonable way.
The plan of the paper is as follows: In the next section, we describe our numerical models for dynamical evolution of GCs in forming clusters of galaxies. In §3, we present the numerical results mainly on radial distributions and kinematics of GCs in clusters with different masses. In §4, we discuss (1) the origin of very high of giant Es in the central regions of some clusters, (2) the origin of UCDs, and (3) the importance of the epoch of the truncation of GC formation by reionization in spatial distributions of cluster GCs. These points were not discussed at all in YB. We summarize our conclusions in §5.
Throughout this paper, we use ICGCs rather than ICG (West et al. 1995) in order to distinguish between intragroup GCs (IGGCs) and intracluster GCs (ICGCs). GCs within any galaxy-scale halos in a cluster-scale halo are referred to as GGCs so that they can be distinguished from ICGCs (Note that these GGCs are not the Galactic GCs). GCs that were formed within subhalos at yet are not within any virialized halos at can be regarded as “intergalactic” (van den Bergh 1958) or “intercluster” (“intergroup”) GCs (YB). Intergalactic, intergroup, and intercluster GCs are simply referred to as INGCs, because these three GC populations would be difficult to be distinguished with one another in observations. For clarity and convenience, the meanings of these acronym are given in Table 1.
2 The model
We first identify hypothetical “GC particles” at high redshifts () in the high-resolution, collisionless cosmological N-body simulation and then follow their dynamical evolution till . We mainly investigate structural and kinematical properties of the simulated “GC particles” that are located in cluster-scale halos with at .
2.1 Identification of “GC” particles
We simulate the large scale structure of GCs in a CDM Universe with , , km , and by using the Adaptive Mesh Refinement body code developed by Yahagi (2005) and Yahagi et al. (2004), which is a vectorized and parallelized version of the code described in Yahagi & Yoshii (2001). We use collisionless dark matter (DM) particles in a simulation with the box size of Mpc and the total mass of . We start simulations at and follow it till in order to investigate physical properties of old GCs outside and inside virialized dark matter halos at . We used the COSMICS (Cosmological Initial Conditions and Microwave Anisotropy Codes), which is a package of fortran programs for generating Gaussian random initial conditions for nonlinear structure formation simulations (Bertschinger 1995, 2001).
The way of investigating GC properties is described as follows. Firstly we select virialized dark matter subhalos at by using the friends-of-friends (FoF) algorithm (Davis et al. 1985) with a fixed linking length of 0.2 times the mean DM particle separation. For each individual virialized subhalo with the half-mass radius of , some fraction () of particles within are labeled as “GC” particles. This procedure for defining GC particles is based on the assumption that energy dissipation via radiative cooling allows baryon to fall into the deepest potential well of dark-matter halos and finally to be converted into GCs. The value of is chosen, because the size of the Galactic GC system is similar to of the dark matter halo in the dynamical model of the Galaxy (Bekki et al. 2005). We assume that old, metal-poor globular cluster formation is truncated after , because previous theoretical studies demonstrated that such truncation of GC formation by some physical mechanisms (e.g., reionization) is necessary for explaining the color bimodality of GCs, very high specific frequency () in cluster Es, and structural properties of the Galactic old stars and GCs (e.g., Beasley et al. 2002; Santos 2003; Bekki 2005; Bekki & Chiba 2005).
Secondly we follow the dynamical evolution of GC particles formed before till and thereby derive locations () and velocities () of GCs at . We then identify virialized halos at with the FoF algorithm and investigate whether each of GCs is within the halos. If a GC is found to be within a halo, the mass of the host halo () and the distance of the GC from the center of the halo () are investigated. If a GC is not in any halos, it is regarded as an intergalactic GC (“INGC”) and the distance () between the INGC and the nearest neighbor halo and the mass of the halo () are investigated. If a GC is found to be within a cluster-size halo (), we investigate which galaxy-scale halo in the cluster-scale halo contains the GC. If we find the GC within the tidal radius of one of galaxy-scale halos in the cluster-scale halo, it is regarded as a galactic GC (GGC): Otherwise it is regarded as an ICGC. The way to select galaxy-scale halos within a cluster-scale halo is given in the Appendix A. Furthermore the details of the method to determine the tidal radius of the GCS in each galaxy-scale halo in a cluster are given and discussed in the Appendix B.
Thus, the present simulations enable us to investigate physical properties only for old GCS owing to the adopted assumptions of collisionless simulations: Physical properties of metal-rich GCs lately formed during secondary dissipative galaxy merger events at lower redshifts (e.g., Ashman & Zepf 1992) can not be predicted by this study. We present the results of the model with , 10, and 15. If is closely associated with the completion of cosmic reionization, may well range from 6 (Fan et al. 2003) to 20 (Kogut et al. 2003). Physical properties of hypothetical GC particles for ICGCs in clusters with are described for the models with in which the number ratio of GC particles to all particles is at .
This value of 0.2 for was chosen such that the typical subhalo at z=6 () can have at least one “GC particle” within in the simulation with the mass resolution of . The present results do not depend on at all as long as . The dependences of the present results on are discussed in the Appendix C. The minimum particle number () that is required for halo identification is set to be 10.
We assume that the initial radial () profiles of GCSs () in subhalos at are the same as those of the simulated dark matter halos that can have the universal “NFW” profiles (Navarro, Frenk, & White 1996) with in their outer parts. The mean mass of subhalos at z=6 in the present simulations is roughly , which is similar to the total mass of bright dwarf galaxies. Minniti et al. (1996) found that the projected () density profiles of GCSs in dwarfs is approximated as , which is translated roughly as by using a canonical conversion formula from into (Binney & Tremaine 1987). Therefore, the above assumption on can be regarded as reasonable. Thus we mainly show the fiducial model with similar to the NFW profiles and .
Although we base our GC models on observational results of GCSs at z=0, we can not confirm whether the above and of the fiducial model are really the most probable (and the best) for GCSs for low-mass subhalos at z=6 owing to the lack of observational studies of GCSs at high redshifts. As our previous paper (YB) showed, the numerical results can depend on initial and of subhalos at . For example, the number fraction of INGCs can be a factor of larger in the models with than in those with both for the NFW and the power-law GC density profiles. The number fraction of INGCs or ICGCs (IGGCs) can be larger for models with less centrally concentrated initial GC distributions in the present study. These suggest that the observed properties of INGCs and ICGCs (IGGCs) can give some constraints on initial GC distributions in subhalos at high , if they are compared with the corresponding simulations as those done in the present study.
2.2 “GN” particles
We consider that a GC particle in the very center of a galaxy-scale halo at is a “galactic nucleus” (GN) particle: The central particle within of each individual virialized subhalo at is labeled as GN and other particles within are labeled as GCs. It should be stressed here that although we follow dynamical evolution of GCs and GNs till , both GCs and GNs at are regarded as GCs at . We do not discriminate GC and GN particles in most investigation, because (1) results are not so remarkably different between GCs and GNs and (2) it would be very hard to observationally discriminate between GCs and (stripped) GNs owing to the observed similarity in physical properties of GCs and GNs (e.g., Walcher et al. 2005). However, in order to discuss the origin of dE,Ns and UCDs in §4, we try to investigate separately some physical properties of GCs at originating from GNs at and those from GCs at . Thus only some key results on GN particles (e.g., radial distributions of GNs at ) are described in §3.3.
Number ratio of GN to GC particles () is typically 0.1 in the model with for the cluster-scale halos with . However, the value of this should be carefully compared with the corresponding observations, because one GC particle (with the mass equal to ) does not mean one GC in the present study. Total number of GCs in the simulation is 207081 (for ), which means that the GC number per mass () is . McLaughlin (1999) showed that total number of initial GCs in a galaxy can decrease by a factor of 25 within the Hubble time owing to GC destruction by the combination effect of galactic tidal fields and internal GC evolution (e.g., mass loss from massive and evolved stars). This means that the initial GC number per mass () is about for the Galaxy with the mass of (Wilkinson & Evans 1999) and the observed GC number of 140 (van den Bergh 2000). Therefore it is quite reasonable to consider that (typically ) rather than simple for each cluster-scale halo is the value that should be compared with observation.


2.3 Main points of analysis
We select 14 virialized cluster-scale halos with the total virialized masses () larger than at from the abovementioned cosmological N-body simulation in which 27 cluster-scale halos can be formed within the Hubble time. Although we have already described some results of the most massive cluster model in YB, this paper first describes dependences of the physical properties of ICGCs on for different 14 cluster models. Therefore, we can discuss whether the results in YB can be also true for models with different cluster masses in the present study.
We first describe some generic results and then those that depend on and model parameters. We first describe physical properties of hypothetical GC particles for GGCs and ICGCs in the “fiducial model” with (§3.1), which show some generic results on radial density profiles and kinematics of GGCs and ICGCs. Then we show the dependences of the results on and (§3.2). In particular, we focus on how the total number and radial density profiles of GCs in the central regions of clusters can depend on , because recent wide-field photometric study of GCs in clusters (e.g., Dirsch et al. 2003) have begun to reveal global structure and kinematics of GCs in the central regions of clusters.
Table 2 summarises briefly the results for each model: Model number (column 1), total masses of cluster-scale halos (2), total number of GCs in the clusters (3), specific frequency of GCs for clusters (4), radius within which 10 % of GCs are included (5), radius within which 50 % of GCs are included (6), number fraction of ICGCs (7), total number of GCs within the central 0.05 Mpc (8), and total number of GCs within the central 0.2 Mpc (9). is defined as the total number of GCs per a cluster mass and given in units of . All of these results are for the model with and the derived parameter dependences on and does not depend on .
3 Results
3.1 The fiducial cluster model
Fig. 1 shows the large scale (Mpc) structure of old GCs formed at for the model with at . The simulated GC large scale distribution shows strong clustering and appears to be quite similar to dark matter distributions simulated in previous numerical works (e.g., Yahagi et al. 2002). About 28 % of all GCs are located within cluster-scale halos with About 99% of all GCs formed before are located in galaxy-scale or cluster-scale (or group-scale) halos at , which means that only 1% of the GCs can be outside any virialzied halos and thus can be identified as intergalactic or intercluster GCs (“INGCs”). The predicted physical properties of these INGCs are described in detail in our previous paper (YB).
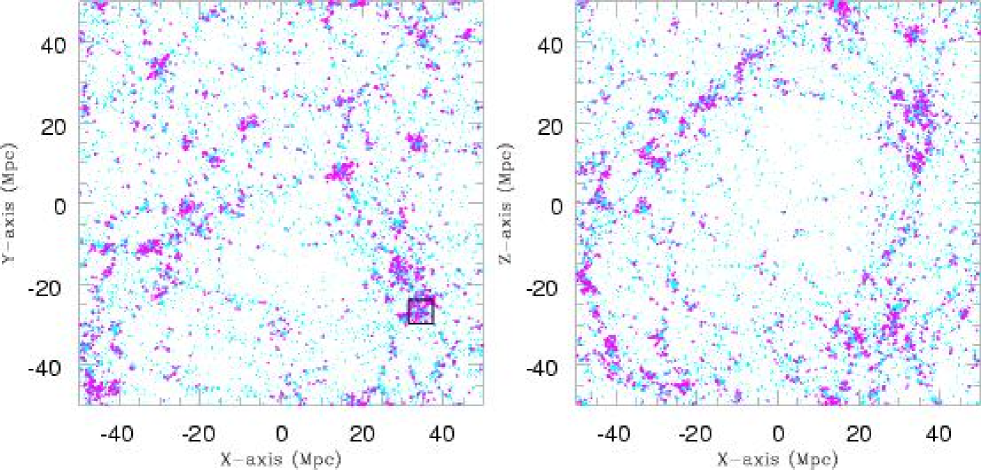
Fig. 2 shows the spatial distributions of GCs inside and outside galaxy-scale halos in the fiducial cluster model CL1 with (or ) = . About 29 % of GCs in the cluster CL1 are not within any galaxy-scale halos in the cluster so that they can be identified as ICGCs. These ICGCs were GCs and GNs of smaller galaxy-scale halos before and tidally stripped from the halos to become ICGCs during the growth of the cluster via hierarchical merging of the halos. The number fraction of GCs at that were previously nuclei at (i.e., GNs) is about 0.2, which implies that a significant fraction of ICGCs can show physical properties atypical of normal GCs (e.g., bimodal/multiple metallicity distributions seen in the most massive Galactic GC, Cen). The ICGCs that were initially nuclei of relatively massive halos ( corresponding to host halos of bright dwarf galaxies with mag for ) at can be the possible candidates of UCDs, because these halos (dwarfs) are observed to contain bright nuclei (i.e., progenitors of UCDs).
Fig.2 also shows that the distribution of ICGCs is inhomogeneous, asymmetric, and somewhat elongated, in particular, in the outer part of the cluster, where a substructure (corresponding to an infalling group of galaxies) can be seen (i.e., around Mpc)). The asymmetric structure of ICGC distribution seen in the simulation can be seen in the observation by Bassino et al. (2006) for the central region of the Fornax cluster. The simulated elongated structure is similar to the observed distributions of intracluster stellar light discovered by Zibetti et al. for clusters of galaxies (2005) at . The simulated inhomogeneous and elongated ICGC distributions can be seen in most models of the present study.
Fig. 3 clearly shows that the cluster grows slowly over the Hubble time via minor merging or accretion of group-scale or galaxy-scale halos rather than via violent major merging with the mass ratios of two groups and clusters as large as . This suggests that tidal stripping of GCs initially within smaller halos with GCs during accretion of the halos is one of the main mechanism of ICGC formation: Violent major merging that can significantly change spatial distributions of GCs is a rare event in this rich cluster. The cluster finally can contain about 3.4 % of all GCs formed at in the simulation box.
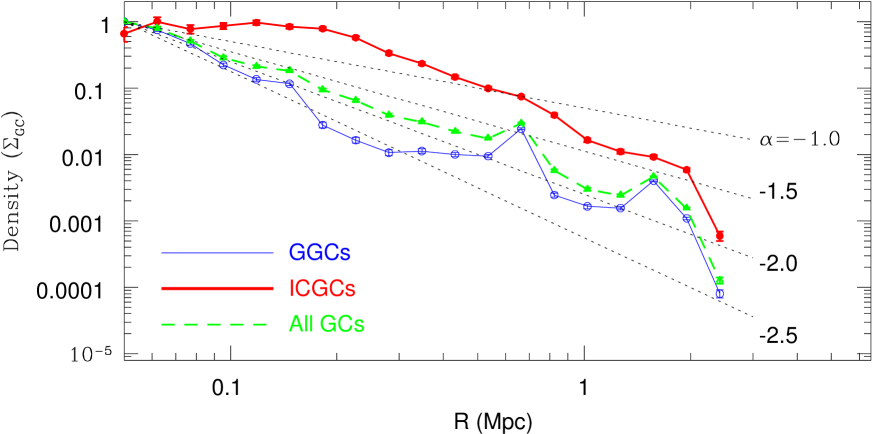
Fig. 4 shows that there is a significant difference in the slope of the projected GC distribution (i.e., ) between GGCs and INGCs: The distribution of ICGCs is significantly flatter than that of GGCs in the central few hundreds kpc of the cluster. A least square fit to the simulation data shown in Fig. 4 gives for GGCs and for ICGCs in the central region of the cluster. Since ICGCs are selected on the base of whether GCs are well outside the tidal radii of GCSs of galaxy-scale halos in the present simulation, it would not be so difficult for observational studies to select ICGCs from all GCs in clusters in the same way as the present study does. It is accordingly doubtlessly worthwhile to compare the results in Fig. 4 and those derived in future wide-field imaging of cluster GCs (e.g., Richtler et al. 2004) to understand the origin of ICGCs.
Fig.5 shows that of all GCs in the central region of the cluster CL1 is quite flat ( for 20kpc). Since these central GCs can be observationally identified as GCs within the central galaxy of a cluster (e.g., cDs and BCDs), the result in Fig. 5 implies that the GCS of the central giant galaxy in a cluster has a flat . The derived value of is actually similar to those observed for very bright Es with mag, most of which are central giant Es in clusters (Ashman & Zepf 1998). The total number of GCs within the central 50 kpc () and 200 kpc () is 1098 and 2084, respectively, which corresponds to 16 % and 30%, respetively, of all GCs in the cluster CL1. This centrally concentrated distribution of old GCs is one of generic results in the present study.
Fig. 6 shows the radial distribution of the number ratio of GCs formed at () and those at () in central 200 kpc of the cluster CL1. This radial distribution, which can be regarded as an age gradient of GCs, has a negative gradient and thus suggests that the inner cluster GCs are more likely to be older than the outer ones. This is probably because galaxy-scale halos that are formed and virialized at higher redshifts and have higher mass densities can finally reside in the inner regions of clusters. However, the derived age gradient is not so large ( Gyr for the adopted cosmology) that it would be observationally difficult to prove it.
Fig. 7 shows the difference in the radial velocity (; line-of-sight-velocity) between GGCs and ICGCs for the three projections for the cluster CL1. There are no remarkable differences in the distributions between the two GC populations, though ICGCs have only slightly larger velocity dispersion than GGCs in the - projection. Both GC populations show asymmetric distributions in the - and the - projections owing to the presence of infalling small groups of galaxies in this cluster CL1. These results suggest that the differences in kinematics between GGCs and ICGCs can not be so clearly observed.


3.2 Parameter dependences
Although the numerical results of some structural and kinematical properties of GCs (e.g., flat ICGC distributions) are similar to one another between the fiducial cluster model CL1 and other cluster models, several physical properties of cluster GCs are quite diverse depending on the cluster masses () and the model parameters (e.g., ). In Figs. , we illustrate the derived dependences on and .
3.2.1
We find the following results:
(i) The number fraction of ICGCs () does not depend on for the cluster mass range of 1.0 6.5 (Fig. 8). The derived is diverse ranging from 0.18 to 0.40 and this diversity is due to the differences of merging histories of clusters.
(ii) The projected radial density profiles () for all GCs can be diverse with in the models with different . These differences are due to the differences in merging histories between clusters with different (Fig. 9). Irrespective of , ICGCs show flat profiles in the central 0.2 Mpc of clusters. If we fit the profiles to , where corresponds to the core radius of a profile, we derive (Mpc) and .
(iii) The projected radial density profiles of GCs for the central 100 kpc is more likely to be significantly flatter than those for the entire cluster regions ( Mpc). The slopes of the inner GC profiles can become as flat as (Fig. 10), which is similar to those observed for the central giant Es in some clusters. The derived slopes are quite diverse ranging from to for the simulated cluster mass range.
(iv) Both and are more likely to be larger for larger (Fig. 11). This result implies that more massive cluster are more likely to have higher densities of old GCs. Also this suggests that central giants Es in more massive clusters can have higher of old GCs than those in less massive clusters owing to the higher central GC number densities. However there are no clear trends in the relationships between , , and (Fig. 12).
(v) The ratio of to (or ), which is referred to as “GC specific frequency for clusters (groups)” and represented as ), depends weakly on in the sense that is higher for more massive group-scale or cluster-scale halos (Fig. 13). This is because more massive groups/clusters are formed from a larger number of smaller halos that are formed at (i.e., ) and thus can have GCs. Larger dispersion of can be seen for groups and clusters with smaller masses.


3.2.2
As shown in Fig. 14, the GC distributions are quite different between models with different . The model with has a wider distribution and a larger number of substructures in the GC distribution whereas the model with has a very compact distribution with little substructures. The surface number densities of ICGCs in models with higher can be lower, which implies that the ICGC distributions can give some constraints on . The derived tendency that the models with higher have more compact distributions and less substructures is discussed later in §4.4 in the context of reionization influence of GC formation in clusters of galaxies.
3.3 GNs
The number ratio of GNs to GCs () ranges from 0.08 to 0.14 for the clusters (CL1 - CL14) and does not depend on (almost constant at ). The derived means that the possible GN-GC number ratio to be observed in clusters range from to (See §2.2 for the conversion from the simulated value to the observable one). The cluster CL1 with can have observable GCs at that were previously nuclei of smaller galaxy-scale halos at . Owing to the almost constant value of for different , more massive clusters are more likely to have a larger number of GCs that were galactic nuclei of galaxy-scale halos at .
We do not find any remarkable differences in radial distributions and kinematics within clusters between GNs and GCs when we separately investigate these properties of GNs and GCs. However we find that the distributions of GCs at that were formed from GNs of massive galaxy-scale halos with have different distributions from other GCs in clusters. For example, the half-number radius () of GCs formed from GNs of massive halos with at is 0.41 Mpc for the CL1 cluster and 0.026 Mpc for the CL14 one. These values of are significantly smaller than those of GCs in these clusters: =0.76 Mpc for GCs of the CL1 and 0.34 Mpc for GCs of the CL14. This is due to the fact that the central regions of clusters can be formed from more massive building blocks (that are formed earlier) of the clusters. Physical implications of these results are discussed later in §4.3.
3.4 IGGCs
The present simulation do not allow us to make robust conclusions on the physical properties of GCs within group-scale halos (), because of the smaller GC number per a group (less than 100 GCs for virialized halos with ). However, it is still useful to provide some qualitative results on the existence of intragroup GCs (IGGCs), given the fact that extensive survey to detect bright ICGCs or UCDs in several groups of galaxies are ongoing by using 2dF spectrograph (e.g., Drinkwater et al. 2005; Kilborn et al. 2005). Fig. 15 demonstrates that ICGCs can be formed in groups and the number fraction of IGGCs among all GCs () for this model is similar to derived for clusters. (). The results of GC properties in groups of galaxies (e.g., dependences of on ) will be presented in our forthcoming papers.

3.5 INGCs
Our previous paper (YB) has already described the results of INGC formation in detail. However it would be important for readers to compare the number fraction of INGCs with that of ICGCs derived in this paper. Accordingly we here briefly summarize the results (YB) as follows.
(i) INGCs comprise about 1% of all GCs formed at in galaxy-scale halos. These INGCs are formed as a result of tidal stripping of GCs from subhalos during hierarchical structure formation through interaction and merging of subhalos between and .
(ii) INGCs at were previously GCs located in the outer parts of lower mass subhalos, which are more susceptible to tidal stripping and destruction during hierarchical structure formation.
(iii) The number fraction of INGCs () is larger for and this dependence can be seen both in the model with initial GC density profile similar to the NFW one and that with the power-law one with the slope of (i.e., similar to the observed one of the Galactic GC system).For a reasonable set of parameters (e.g., and the FoF linking length), can range from an order of 0.1% to 1%.
4 Discussion
4.1 Comparison with observations
Recent observational studies based on wide-field imaging of GC systems (GCSs) have revealed structural properties of GCs not only around giant galaxies (e.g., Rhode & Zepf 2004) but also across the central regions of clusters of galaxies (e.g., Dirsch et al. 2003; Bassino et al. 2006; Tamura et al. 2006; West et al. 2006). Furthermore recent observations using Two-Degree Field (2dF) 400-fiber spectrograph on the Anglo-Australian Telescope have discovered not only UCDs but also possible candidates of ICGCs (Drinkwater et al. 2003; Firth et al. 2006). Since these observations cover the GC density distributions at most for the central kpc of a cluster of galaxies (e.g., Bassino et al. 2006), the simulated GC distributions over the entire regions in clusters of galaxies (i.e., Mpc-scale) can not be compared with the observations in a fully self-consistent manner. However, it would be important to investigate how well the simulated GC profiles can match with the observed central GC profiles in clusters of galaxies, because this investigation may well enable us to assess the viability of the present formation model of ICGCs.
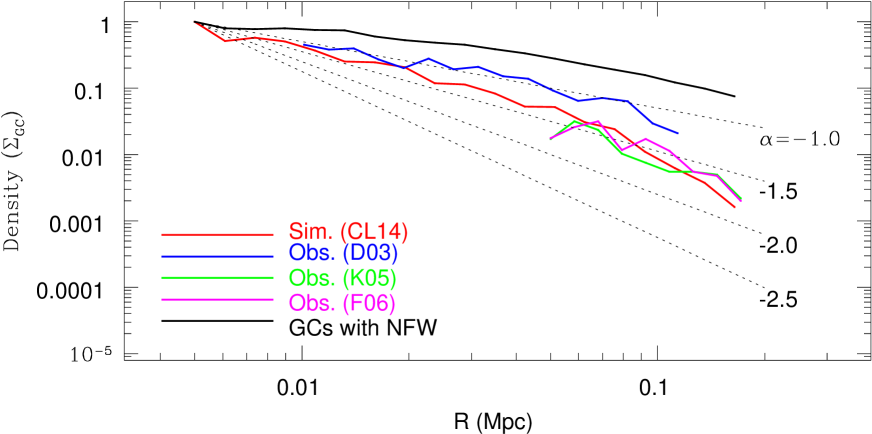
Figure 16 shows the comparison between the observed density profiles of GCs around NGC 1399 (Dirsch et al. 2003; D03), UCDs (Karick 2005; K05), and ICGC/UCD candidates (Firth et al. 2006; F06) in the central region (kpc) of the Fornax cluster and the simulated one for all GCs including ICGCs and galactic GCs in the model CL14 with the total mass similar to that of the Fornax cluster. For comparison, the radial profile of GCs that have the NFW density profile (model 15 in NFW) reasonable for the Fornax cluster is also shown in this figure. It is clear from this figure that (1) both simulated and observed GC profiles are significantly steeper than that of the NFW profile, (2) the profile of GCs in D03 is slightly shallower than that of UCDs in K05 (and ICGC/UCDs in F06), and (3) the simulated profile can be overall consistent with the results of K05 and P06 and with that of D03 in the inner part of the Fornax cluster.
The derived steeper profiles, which can be seen in models with different , can be due to the truncation of GC formation at high modeled in the present study. Because of the lack of extensive observational studies of GC density profiles in variously different clusters of galaxies, it still remains unclear whether such steeper density profiles of GCs are universal rather than exceptional for the Fornax cluster. Previous theoretical and numerical models of GC formation with the truncation of GC formation at high were suggested to be more consistent with observed GC properties, such as the color bimodality of galactic GCs and the radial density profile of the Galactic GCS (e.g, Beasley et al. 2002; Santos 2003; Bekki 2005; Moore et al. 2005). We accordingly suggest that future observations on GC density profiles in different clusters are quite important for proving the truncation of GC formation at high by some unknown cosmological processes (e.g., reionization).
4.2 Metallicity distribution function of ICGCs
Recent theoretical studies based on semi-analytic models (e.g., Beasley et al. 2002) and on high-resolution cosmological simulations (e.g., Rhode et al. 2005; Bekki et al. 2006) have started providing some theoretical predictions on GCS properties (e.g., relations between physical properties of GCSs and those of their host galaxies) in a hierarchical clustering scenario of galaxy formation (See Brodie & Strader 2006 for a recent review). However these studies have not yet provided useful predictions on ICGC physical properties (e.g., metallicity distributions functions that are referred to as MDFs in this paper) that can be compared with previous/ongoing observations of ICGCs (e.g., Hilker 2002; West et al. 2006). In particular, the observed color distributions of ICGCs, which contain information on metallicities of ICGC and thus on chemical evolution histories of ICGCs and their defunct host galaxies, can be important to be compared with the present results.
The methods to investigate MDFs of ICGCs and GCs within galay-scale halos in clusters of galaxies are described as follows. Firstly we allocate metallicities () to GCs within a virialized halo with the total mass () and the baryonic one () at by assuming a reasonable relation between and (and ). We here adopt the observationally suggested relation by Peng et al. (2006) that is described as (for a constant stellar mass-to-light-ratio). Since we do not have observational data sets that can give strong constraints on the relation at high redshifts, we consider that the adopt relation is a reasonable first step for better understanding MDFs of GCs in the CDM model. Secondly, we follow the dynamical evolution of GCs with different until , and then investigate of ICGCs and galactic GCs in halos identified as clusters of galaxies.
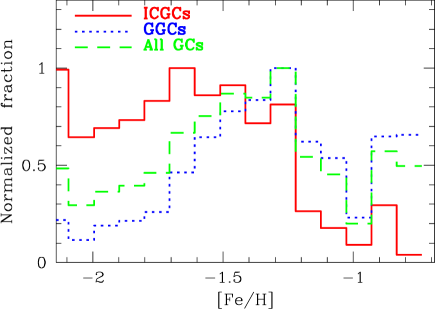
Fig. 17 shows that the MDF of ICGCs in the model CL1 is significantly different from that of GCs within galaxy-scale halos (GGCs) in the cluster in the sense that the MDF of ICGCs has a much higher fraction of metal-poor ([Fe/H] ) GCs than that of GGCs. The mean [Fe/H] for ICGCs, GGCs, and all GCs are , , and , respectively, in this model. The ICGC MDF does not show the remarkable bimodality that is observationally suggested to be common in bright galaxies (e.g., Brodie & Strader 2006). Interestingly, the MDF of GGCs shows relatively clear bimodality in this model without no GC formation via star formation at . The reason for the high fraction of metal-poor GCs in the ICGC population is that ICGCs originate from lower mass galaxy-scale halos that can be more easily destroyed by the cluster tidal to disperse their GCs into intracluster regions.
By using relations between colors and metallicity (e.g., Barmby et al. 2000), we can convert MDFs of ICGCs into their color distributions that can be compared with ongoing and future observations. The derived peak of [Fe/H] corresponds to , which is roughly consistent with the observed peak value of ICGC candidates for the “region 2” in the Centaurus cluster of galaxies (Hilker 2002). Because of the linear dependence of on [Fe/H] in the adopted -[Fe/H] relation (Barmby et al. 2002), the simulated MDF of ICGCs can not be consistent with the observed MDF similar to a Gaussian profile for ICGC candidates in the Centaurus cluster (Hilker 2002). This apparent inconsistency is due largely to the derived large fraction of metal-poor GCs in the simulated ICGC populations. It should be here noted that the observed MDF also shows no remarkable bimodality: It however remain unclear whether such an unimodal distribution is an unique character in MDFs of ICGCs.
Although the above apparent inconsistency between observations and simulations in MDFs (or color distributions) of ICGCs may well result either from numerical resolutions of the present study (i.e., not enough high-resolution to properly treat low-mass halos susceptible to tidal destruction) or from some uncertainties in the modeling of initial relations, this inconsistency most likely suggests that formation of GCs at high in low-mass halos (or galaxies), where most low- ICGC originate from, needs to be suppressed in order to explain more self-consistently observations. It is however unclear what physical mechanisms are responsible for such preferential suppression of GC formation in low-mass halos. We thus plan to investigate whether theoretical models with the preferential suppression of GC formation can better explain the observed MDFs of ICGCs by using more sophisticated and higher-resolution numerical simulations.
In the present models, all ICGCs are initially within galaxy-scale halos at very high redshifts () and later can become ICGCs owing to tidal stripping of GCs from the halos during slow hierarchical growth of clusters of galaxies via halo merging (See Fig. 3). GCs within the halos therefore can have enough time to be dynamically influenced by the tidal fields of the halos and galaxies embedded in the halos before they are stripped to form ICGCs. Recent dynamical studies of GCSs in galaxies have demonstrated that tidal fields of galaxies are highly likely to destroy preferentially low-mass GCs so that luminosity functions (LFs) of GCs can have log-normal shapes rather than power-law ones (e.g., Fall & Zhang 2001). If this result can be applied to GCs in galaxy-scale halos that are building blocks of clusters of galaxies, LFs of ICGCs are highly likely to have log-normal shapes. We thus suggest that the observed LFs of ICGCs can provide some clues for a question as to whether ICGCs were initially within galaxy-scale halos at high .
4.3 Origin of high of Es in clusters
It is well known that giant Es in the central regions of some clusters of galaxies (e.g., M87 in the Virgo and NGC 1399 in the Fornax) have much higher () in comparison with field Es (e.g., Harris 1991; West et al. 1995; Forbes et al. 1997). Forbes et al. (1997) found that Es with high have higher number ratios of metal-poor GCs (MPCs) to metal-rich ones (MRCs) and accordingly suggested that the secondary formation of MRCs does not explain clearly the origin of very high in some cluster Es. West (1993) proposed that the observed high of central Es in rich clusters can be naturally explained if GCs can form more efficiently in rare high-density peaks of primordial matter distributions. This “biased GC formation scenario” was suggested to be consistent with the observed dependence of on environments (e.g., mean galaxy density) and galaxy types (West 1993).
The present study has shown that a large fraction (up to 36 %) of old GCs formed before can be within the central 50 kpc of clusters, though the GC number can be quite different between clusters with different . For example, the model CL1 shows of 1098, which means that about 16 % of all GC particles are located within the central 50 kpc of the cluster. If the cluster has a central giant E with the luminosity similar to M87 ( mag in -band; West et al. 1995), this result can be interpreted as the cluster having the central E with 15350 GCs and of (See the Table 1 in West et al. 1995). As shown in the present simulations, the origin of a large number of GCs confined in the central region of a cluster is closely associated with the fact that the cluster central region is formed by hierarchical merging of halos which were virialized at very high redshift () and thus contained GCs. Thus the present simulations imply that the origin of very high of giant Es in the central regions of clusters can be understood in terms of the growth processes of the clusters.
The present study has also shown that is different by a factor of 13 between different clusters (for ). This result may well provide physical basis for the West et al’s (1995) scenario that the significant difference in between central giant Es in clusters is due to the difference in number of GCs trapped by cluster potential (rather than galaxy one) between different clusters. We suggest that the difference in the GC number can result from the differences in the growth histories of clusters via hierarchical merging:If a cluster is formed from a larger number of smaller halos that were virialized before (thus could have old GCs), it shows a higher in its central giant E(s). The derived weak dependence of on will be able to be tested against observational results based on wide-field photometric studies of GCs in clusters (e.g., Dirsch et al. 2003)
4.4 Formation of flatter GC density profiles in central giant Es in clusters
It has long been known that the radial density profiles of GCSs () in elliptical galaxies vary with the total luminosities of their host galaxies (e.g., Ashman & Zepf 1998). Observations show that if is described as , range from (for lower luminosity Es) to (for higher). The key point here is that very bright cluster Es with mag (e.g., M87) have very flat distributions with . Previous theoretical studies have pointed out that destruction of GCs is a key physical process that controls the radial profiles of GCSs (e.g., Baumgardt 1998; Fall & Zhang 2001; Vesperini et al. 2003), and some of these suggested that the very flat GC profiles for giants Es in clusters (e.g., M87) is due to GC destruction processes (e.g., Vesperini et al. 2003).
An alternative scenario has been proposed by Bekki & Forbes (2006), in which the radial density profiles of GCSs in Es become progressively flatter as the galaxies experience more major merger events. The expected effect of destruction mechanisms on the GC luminosity function with galactocentric radius was not found in the detailed studied by Harris et al. (1998) of M87, which implies that the former scenario is not so promising. However it remains unclear which of the above two scenarios is more realistic and convincing.
The present study has shown that the radial profiles of GCs in the central regions of clusters can become quite flat () without any destruction mechanisms of GCs around Es. This result may well lend support to the latter scenario of the above two (i.e., Bekki & Forbes 2005), though the present model does not consider (1) the formation of Es in the central regions of clusters and (2) the contribution of MRCs (which could be less than 30% in number of Es with high ) to the GC density profiles.
We accordingly suggest that the observed flat GC distributions of cluster giant Es are closely associated with the formation processes of the cluster central regions (thus central giant Es) via hierarchical merging. Since the merging histories of clusters are different in different clusters, the observed appreciable differences in between cluster Es (Ashman & Zepf 1998) could be due to the different merging histories of clusters.
4.5 UCDs as nuclei of oldest galaxies
One of the promising scenarios of UCD formation is the “galaxy threshing” one (Bekki et al. 2001, 2003) in which dE,Ns can be transformed into UCDs owing to complete tidal stripping of outer stellar envelopes of dE,Ns by strong tidal field of clusters of galaxies. In this scenario, dE,Ns that are transformed into UCDs are required to have higher eccentricity and pericenter distances of their orbits. This requirement naturally explain the observational result that bright UCDs in the Fornax cluster are confined within the central 200 kpc of the (Drinkwater et al. 2000; Bekki et al. 2003). In order for the threshing scenario to be consistent with the observed number of UCDs, clusters of galaxies should contain a large number of dE,Ns that could be progenitor galaxies of UCDs. Observations revealed that (1) dEs located near the center of the Virgo cluster are mostly nucleated and (2) only a fraction of dEs located outside the cluster core radius are non-nucleated (Binggeli & Cameron 1991). The threshing scenario alone has not yet explained why dEs are mostly nucleated in the central regions of clusters of galaxies.
The present study has shown that (1) cluster GCs at originating from GNs of massive galaxy-scale halos () at high redshifts have compact distributions and (2) GCs formed in halos virialized at very high redshift () can be located preferentially in the central regions of clusters at (See Fig. 14). Although cluster GC distributions can not be directly compared with UCD ones, these results may well imply that if UCDs were nuclei of dE,Ns formed in the massive halos virialized at very high redshifts and later became cluster member galaxies, then they can have very compact distributions in clusters at : The origin of the observed compact distributions of UCDs (and dE,Ns) can be due to the earlier formation of massive dE,Ns in comparisons with non-nucleated dEs. This somewhat speculative explanation needs to answer the question as to why massive halos virialized at very high redshift can develop stellar nuclei in their central regions and consequently become nucleated galaxies. We suggest that higher mass densities in halos virialized at earlier epoch can be responsible for more efficient nucleus formation either by merging of star clusters or by some dissipative mechanism in galactic centers (Oh & Lin 2000; Bekki et al. 2004; Bekki et al. 2006).
4.6 Reionization and GC properties in clusters
Recently several authors have discussed (1) whether reionization can trigger or suppress the formation of globular clusters (e.g., Cen 2001; Santos 2003) and (2) what observational properties of GCSs in galaxies have fossil information of the reionization influence on GC formation (Bekki 2005). These studies proposed that of MPCs in giant Es, the color bimodality of GCSs, and the projected radial density profile of GCSs can be influenced by reionization, if reionization can suppress GC formation in subgalactic clumps (i.e., progenitors of dwarf galaxies). These previous studies however did not discuss at all whether physical properties of GCs (i.e., radial distributions of ICGCs) in clusters of galaxies can have fossil records of reionization influence on GC formation in clusters.
The present study has shown that the spatial distributions of GCs in clusters depend strongly on in the sense that the cluster models with higher show more compact GC distribution. This result implies that if is physically related to the epoch of the completion of reionization (), after which GCs formation is strongly suppressed, the GC density distributions in clusters can have some valuable information on . Very deep ‘all-object’ spectroscopic surveys centered on some clusters are required for identifying cluster member GCs and thereby investigating radial density profiles of GCs. This type of observations might well be formidable tasks for 8m-telescopes with multi-object spectrograph and wide-field imaging facilities. Systematic observational studies of radial density profiles of cluster GCs by such telescopes will enable us to discuss differences in reionization influences on GC formation between different clusters and thus to understand better the origin of cluster GCs.
5 Conclusions and summary
We have investigated radial density profiles and kinematics of GCs located in clusters with the total masses () larger than based on high-resolution cosmological N-body simulations with a formation model of old GCs. Although YB has already described some preliminary results for only one cluster model, this paper first discussed the dependences of physical properties of ICGCs on based on the results on 14 cluster models. We summarize our principle result as follows.
(1) GCs located outside the tidal radii of galaxy-scale halos in clusters of galaxies are formed owing to tidal stripping of GCs initially within smaller halos during hierarchical growth of clusters via halo merging. These intracluster GCs (ICGCs) comprise 20-40 % of all GCs in clusters with and the number fraction () does not depend on for the above cluster mass range.
(2) The projected radial density profiles () of all GCs in clusters with different can be diverse. If , ranges from to for GCs in clusters with the above mass range. is more likely to be significantly flatter in ICGCs than in GCs located in virialized galaxy-scale halos (i.e., GGCs) in clusters. There are no remarkable difference in kinematical properties (e.g., distributions) between GGCs and ICGCs.
(3) Two-dimensional distributions of ICGCs are inhomogeneous, asymmetric, and somewhat elongated, in particular, in the outer parts of cluster for most models. The simulated inhomogeneous distributions of ICGCs suggest that observations based on wide-field imaging of GCs in clusters are doubtlessly worthwhile to understand real radial distributions of ICGCs.
(4) Although total number of GCs within the central 0.05 Mpc () and 0.2 Mpc () are diverse in different clusters, they can depend weakly on in such a way that both and are likely to be larger for clusters with larger . This result implies that central giant ellipticals (Es) in more massive clusters are likely to show a larger number of old, metal-poor GCs compared with those in less massive clusters. This result also provides a new clue as to why some central Es in clusters show high .
(5) of all GCs in the central 200 kpc in clusters is also diverse with the slopes ranging from to . The derived flat distributions of GCs in the central region of clusters suggest that the origin of the observed flat distributions of GCs around central giant Es in clusters (e.g., M87 in the Virgo) can be understood in terms of hierarchical growth processes of the cluster central regions via merging of halos with old GCs.
(6) The distributions of GCs depends on , after which GC formation is assumed to be truncated by some physical processes at high redshifts. For example, the projected radial GC distributions are more compact and steeper for the cluster models with higher . ICGC fraction can be smaller for the models with higher . This result suggests that if the suppression mechanism of GC formation is due to reionization (Santos 2003; Bekki 2005; Moore et al. 2005), the GC distributions in clusters can provide some useful constrains on the epoch of reionization.
(7) If ultra-compact dwarf galaxies (UCDs), which can be regarded as very massive INGCs, originate from nuclei of nucleated dwarfs (dE,Ns) that were virialized very high (), the origin of the observed compact spatial distributions can be more clearly understood.
(8) About 1% of all GCs formed before are not located within any virialized galaxy-scale, group-scale, and cluster-scale halos and thus can be regarded as INGCs that are freely drifting in intergroup and intercluster regions. This result is already discussed extensively by YB. Physical properties (e.g., metallicity distributions and luminosity function) of these intergroup and intercluster GCs can be quite different from those of GCs within galaxies.
(9) The mean metallicity of ICGCs in a cluster can be smaller than that of GCs within the cluster member galaxy-scale halos by in [Fe/H]. Metallicity distribution functions (MDFs) of ICGCs show peak values around [Fe/H] with a higher fraction of metal-poor GCs (with [Fe/H] ). The MDFs do not have remarkable bimodality that is observationally suggested to be common features of MDFs in bright galaxies.
(10) Radial density profiles of ICGCs and galactic GCs in clusters of galaxies can be significantly steeper than those of the background dark matter halos in the central regions (kpc) of the clusters with different . This is due mainly to the truncation of GC formation at high () in the simulations. The simulated GC profiles can be overall consistent with latest observations on radial density profiles of GCs and UCDs in the Fornax cluster of galaxies.
Acknowledgments
We are grateful to the referee for valuable comments, which contribute to improve the present paper. We are also grateful to Arna Karick and Peter Firth for their sending observational data sets of intracluster GCs and ultra-compact dwarfs. KB acknowledges the financial support of the Australian Research Council throughout the course of this work. The numerical simulations reported here were carried out on Fujitsu-made vector parallel processors VPP5000 kindly made available by the Astronomical Data Analysis Center (ADAC) at National Astronomical Observatory of Japan (NAOJ) for our research project why36b. H.Y. acknowledges the support of the research fellowships of the Japan Society for the Promotion of Science for Young Scientists (17-10511).
References
- (1) Arnaboldi, M. 2004, in ”Baryons in Dark Matter Halos”. Edited by R. Dettmar, U. Klein, P. Salucci. Published by SISSA, Proceedings of Science. p.26.1
- (2) Ashman, K. M., Zepf, S. E., 1992, ApJ, 384, 50
- (3) Ashman, K. M., Zepf, S. E., 1998, Globular Cluster Systems (Cambridge university press)
- (4) Barmby, P., Huchra, J. P., Brodie, J. P., Forbes, D. A., Schroder, L. L., Grillmair, C. J., 2000, AJ, 119, 727
- (5) Bassino, L. P., Cellone, S. A., Forte, J. C., Dirsch, B. 2003, A&A, 399, 489
- (6) Bassino, L. P., Cellone, S. A., Forte, J. C. 2002, in Extragalactic Star Clusters, IAU Symposium 207, Edited by D. Geisler, E.K. Grebel, and D. Minniti. San Francisco: Astronomical Society of the Pacific. p.345
- (7) Bassino, L. et al. 2006, A&A in press (astro-ph/0603349)
- (8) Baumgardt, H. 1988, A&A, 330, 480
- (9) Beasley, M. A., Baugh, C. M., Forbes, D. A., Sharples, R. M., Frenk, C. S. 2002, MNRAS, 333,
- (10) Bekki, K. 2005, ApJ, 626, L93
- (11) Bekki, K., Forbes, D. A., Beasley, M. A., Couch, W. J. 2002, MNRAS, 335, 1176
- (12) Bekki, K., Forbes, D. A., Beasley, M. A., Couch, W. J. 2003, MNRAS, 344, 1334
- (13) Bekki, K., Beasley, M. A., Brodie, J. P., Forbes, D. A. 2005, accepted in MNRAS.
- (14) Bekki, K., Couch, W. J., Drinkwater, M. J. 2001, ApJ, 552, L105
- (15) Bekki, K., Couch, W. J., Drinkwater, M. J., Shioya, Y. 2003, MNRAS, 344, 399
- (16) Bekki, K., Couch, W. J., Drinkwater, M. J., Shioya, Y. 2004, ApJ, 610, L13
- (17) Bekki, K., Chiba, M. 2005, ApJ, 625, L107
- (18) Bekki, K., Forbes, D. A. 2006, A&A, 445, 485
- (19) Bekki, K., Couch, W. J., Shioya, Y., 2006, ApJL, 642, 133
- (20) Bekki, K., Yahagi, Y., Forbes, D. A. 2006, ApJL, 645, 29
- (21) Bertschinger, E. 1995, astro-ph/9506070
- (22) Bertschinger, E. 2001, ApJS, 137, 1
- (23) Binggeli, B., Cameron, L. M. 1991, A&A, 252, 27
- (24) Blakeslee, J. P., 1997, ApJ, 481, L59
- (25) Brodie, J. P., Schroder, L. L., Huchra, J. P., Phillips, A. C., Kissler-Patig, M., Forbes, D. A., 1998, 116, 691
- (26) Brodie, J. P., Strader, J., 2006, ARA&A, in press (astro-ph/0602601)
- (27) Cen, R. 2001, ApJ, 560, 592
- (28) Côte, P., McLaughlin, D. E., Hanes, D. A., Bridges, T. J., Geisler, D., Merritt, D., Hesser, J. E., Harris, G. L. H., Lee, M. G., 2001, ApJ. 559, 828
- (29) Davis, M., Efstathiou, G., Frenk, C. S., White, S. D. M. 1985, ApJ, 292, 371
- (30) Dirsch, B., Richtler, T., Geisler, D., Forte, J. C., Bassino, L. P., Gieren, W. P. 2003, AJ, 125, 1908
- (31) Drinkwater, M. J., Jones, J. B., Gregg, M. D., Phillipps, S. 2000, PASA, 17, 227
- (32) Drinkwater, M. J., Gregg, M. D., Hilker, M., Bekki, K., Couch, W. J., Ferguson, J. B., Jones, J. B., Phillipps, S. 2003, Nature, 423, 519
- (33) Drinkwater, M. J., Evstigneeva, E., Jurek, R., Bridges, T., Gregg, M. D., Karick, A., Bekki, K., Couch, W. J., Jones, J. B., Phillipps, S., 2005, submitted to AJ.
- (34) Evans, N. W., Wilkinson, M. I., Guhathakurta, P., Grebel, Eva K., Vogt, S. S. 2000, ApJ, 540, L9
- (35) Faber, S. M., Lin, D. N. C. 1983, ApJ, 266, L17
- (36) Fall, S. M., Zhang, Q. 2001, ApJ, 561, 751
- (37) Fan, X. et al. 2003, AJ, 125, 1649
- (38) Firth, P. et al. 2006, in preparation.
- (39) Forbes, D. A., Brodie, J. P., Grillmair, C. J., 1997, AJ, 113, 1652
- (40) Forte, J. C.; Martinez, R. E., Muzzio, J. C., 1982, AJ, 87, 1465
- (41) Jones, J. B., Drinkwater, M. J., Jurek, R., Phillipps, S., Bekki, K., Couch, W. J., Karick, A., Parker, Q. A., Smith, R. M., 2006, AJ, 131, 312
- (42) Jordán, A., West, M. J., Côte, P., Marzke, R. O. 2003, AJ, 125, 1642
- (43) Karick, A. 2005, PhD thesis, Melbourne University
- (44) Harris, W. E. 1991, ARA&A, 29, 543
- (45) Harris, W. E., Harris, G. L. H., McLaughlin, D. E. 1998, AJ, 115, 1801
- (46) Hilker, M., 2002, Extragalactic Globular Cluster Systems, Proceedings of the ESO Workshop, p. 173.
- (47) Kilborn et al. 2005, PASA, 22, 326
- (48) Kogut, A. et al. 2003, ApJS, 148, 161
- (49) McLaughlin, D. E. 1999, AJ, 117, 2398
- (50) Marin-Franch, A., Aparicio, A. 2003, ApJ, 585, 714
- (51) Mieske, S., Hilker, M., Infante, L. 2004, A&A, 418, 445
- (52) Moore et al. 2005, submitted to MNRAS (astro-ph/0510370)
- (53) Muzzio, J., 1987, PASP, 99, 245
- (54) Navarro, J. F., Frenk, C. S., White, S. D. M. 1996, ApJ, 462, 563
- (55) Oh, K. S., Lin, D. N. C. 2000, ApJ, 543, 620 Peng, E. W., Jordán, A., Côte, P., Blakeslee, J. P., Ferrarese, L., Mei, S., West, M. J., Merritt, D., Milosavljevi, M., Tonry, J. L., 2006, ApJ, 639, 95
- (56) Richtler, T. et al. 2004, AJ, 127, 2094
- (57) Rhode, K. L., Zepf, S. E., Santos, M. R., 2005, ApJL, 630, 21
- (58) Rhode, K. L., Zepf, S. E., 2004, AJ, 127, 302
- (59) Santos, M. R. 2003, in Extragalactic Globular Cluster Systems, Proceedings of the ESO Workshop, p. 348
- (60) Searle, L., Zinn, R. 1978, ApJ, 225, 357
- (61) Tamura, N., et al. 2006, in preparation.
- (62) van den Bergh, S. 1958, The Observatory, Vol. 78, p85.
- (63) van den Bergh, S. 2000, The Galaxies of the Local Group, Cambridge: Cambridge Univ. Press.
- (64) Vesperini, E., Zepf, S. E., Kundu, A., Ashman, K. M. 2003, ApJ, 593, 760
- (65) West, M. J. 1993, MNRAS, 265, 755
- (66) West, M. J., Côte, P., Jones, C., Forman, W., Marzke, R. O. 1995, ApJ, 453, L77
- (67) West, M. J., Côte, P., Marzke, R. O., Jordán, A. 2004, Nat, 427, 31
- (68) West, M. J., et al., 2006, in preparation.
- (69) White, R. E. III. 1987, MNRAS, 227, 185
- (70) Yahagi, H. 2005., PASJ, 57, 779
- (71) Yahagi, H., Yoshii, Y. 2001, ApJ, 558, 463
- (72) Yahagi, H., Nagashima, M., Yoshii, Y., 2004, ApJ, 605, 709
- (73) Yahagi, H., Bekki, K. 2005, MNRAS, 364, L86 (YB)
- (74) Zibetti, S. White, S. D. M., Schneider, D. P., Brinkmann, J., 2005, MNRAS, 358, 949
Appendix A Identification of galaxy-scale halos in clusters
We adopted the following method in order to identify galaxy-scale halos in a cluster-scale halo. Firstly, we investigate the mass density () around each (-th) particle in a cluster-scale halo and thereby sort out for all particles in the cluster (i.e., the particle with highest is the first and that with the lowest is the last in order). Secondly, by assuming that the particle with the highest can be the “nuclear particle” which is located in the central region of a subhalo, we identify this nuclear particle. Thirdly, we look for the tidal radius (which is described in the Appendix B in detail) for this subhalo, and particles within are regarded as being the member particles of this halo. Fourthly, we assume that the particle with the second highest is the nuclear particle of an another subhalo and thereby look for the member particles of the halo. This process is repeated for 3rd, 4th, etc. until every galaxy-scale halos are found. The GC and GN (“galactic nucleus”) particles that do not belong to any subhalos are identified as ICGCs (intracluster GCs). We have confirmed that this method enables us to correctly identify subhalos though the above first process can be time-consuming in some cases.
Appendix B Methods to determine tidal radii of GCSs in galaxy-scale halos
In order to select ICGCs from GCs in a cluster-scale halo, we need to find GCs outside the tidal radii () of GCSs in galay-scale halos in the cluster. Because of tidal stripping of dark halo particles and GC ones, the radial density profiles of the outer parts of galaxy-scale halos can much more steeply decrease than dynamical equilibrium models predict. We define of a GCS as the radius beyond which the radial density profile of the GCS () drops much more sharply than the CDM model predicts. The universal density profiles of dark matter halos are predicted by extensive cosmological simulations such as Navarro, Frenk, & White (1996; hereafter NFW) and the NFW profile is described as:
| (1) |
where , , and are the distance from the center of the dark matter halo, the characteristic density, and the scale-length of the dark halo, respectively. This NFW profile means that if dark matter halo density profiles are described as for the outer parts (), . By assuming that for a GCS in a galaxy-scale halo, we first estimate the radius where becomes smaller than (which is significantly smaller than in the outer NFW profile), and then regard the radius as .
determined in the above way for a galaxy-scale halo in a cluster would not be exactly the same as the tidal radius that can be determined from the total mass of the cluster and the mass and the orbital eccentricity of the galaxy-scale halo (e.g., Faber & Lin 1983). However, we consider that the method described above is much more practical and thus better, because (1) observational studies can find for each individual GCS in the same way as the present simulation does so that we can compare simulations with observations in a fully self-consistent manner and (2) it is currently impossible to observationally determine the orbital eccentricity of each individual halo with respect to the cluster center owing to lack of proper motion data for cluster GCs. Since this new method of determining is based solely on the positions of GCs, we can efficiently find ICGCs that are outside of any galaxy-scale halos in a cluster.
Based on the above method to determine , we investigate total number of GCs within each individual halo in each cluster model (CL1-14). Fig. B1 shows the “GC number () function” (like galaxy luminosity function) for galaxy-scale halos in the cluster CL1 at and for all galaxy-scale halos at . This function describes how much fraction of galaxy-scale halos contain a given number of GCs. As shown in Fig. B1, the function depends on redshifts in the sense that a larger fraction of galaxy-scale halos can have more than 100 GCs within their tidal radii at as a result of hierarchical merging. Some halos in Fig. B1 show GCs within their tidal radii, and these halos are the central giant ones in the cluster CL1.

Appendix C Dependences of the results on
This parameter can set the level of statistical sampling of the GCs in the present simulations. To show the robustness of the present results, we investigated the models with different and the Fig. C1 shows one example of the -dependences of the results. As shown in Fig. C1, (number fraction of intergalactic GCs) does not depend on for . Considering that the baryonic fraction of halos (thus GC mass fraction) can be at most 0.2, the above result suggests that reasonable values of should be in the present simulations. We confirm that the present results do not depend on for .
