Ages, metallicities, and [/Fe] ratios of globular clusters in NGC 147, NGC 185, and NGC 205
Abstract
We present measurements of ages, metallicities, and [/Fe] ratios for 16 globular clusters (GC) in NGC 147, NGC 185, and NGC 205 and of the central regions of the diffuse galaxy light in NGC 185, and NGC 205. Our results are based on spectra obtained with the SCORPIO multi-slit spectrograph at the 6-m telescope of the Russian Academy of Sciences. We include in our analysis high-quality HST/WFPC2 photometry of individual stars in the studied GCs to investigate the influence of their horizontal branch (HB) morphology on the spectroscopic analysis. All our sample GCs appear to be old ( Gyr) and metal-poor (), except for the GCs Hubble V in NGC 205 ( Gyr, ), Hubble VI in NGC 205 ( Gyr, ), and FJJVII in NGC 185 ( Gyr, ). The majority of our GC sample has solar [/Fe] enhancement in contrast to the halo population of GCs in M31 and the Milky Way. The HB morphologies for our sample GCs follow the same behavior with metallicity as younger halo Galactic globular clusters. We show that it is unlikely that they bias our spectroscopic age estimates based on Balmer absorption line indices. Spectroscopic ages and metallicities of the central regions in NGC 205 and NGC 185 coincide with those obtained from color-magnitude diagrams. The central field stellar populations in these galaxies have approximately the same age as their most central GCs (Hubble V in NGC 205 and FJJIII in NGC 185), but are more metal-rich than the central globular clusters.
keywords:
galaxies: star clusters – globular clusters: general – galaxies: individual: NGC 147, NGC 185, NGC 205: abundances – globular clusters: statistics1 Introduction
Understanding the role of dwarf galaxies and their globular cluster systems as building blocks of massive early-type and spiral galaxies is one of the great challenges of modern astrophysics. Studying the chemical compositions and color-magnitude diagrams (CMDs) of globular clusters (GCs) in the nearby low-mass galaxies is critical to compare properties of these long-living objects situated in galaxies of different type and mass. Only the Local group (LG) dwarf galaxies are close enough so that their globular clusters can be resolved into single red giant and horizontal branch stars by today’s observatories.
Three close companions of the Andromeda galaxy, NGC 147, NGC 185 and NGC 205, comprise the brightest end of the LG dwarf early-type galaxy luminosity function. The proximity to M31 in combination with the unusual properties of these three galaxies have attracted great attention of astronomers since the beginning of the 20th century (we refer the reader to a monograph by Van den Bergh 2000 and a review by Mateo 1998 for details). NGC 205 and NGC 185 are very unusual galaxies and do not resemble any galaxy within Mpc. Both have a regular spheroidal shape and are composed mainly of old stars. At the same time, both galaxies have a considerable amount of gas, dust, and a significant intermediate-age stellar component. These unique properties are most likely tightly related their unusual evolutionary histories (e.g. Yong & Lo, 1997; Davidge, 1992; Lee et al., 1993; Butler & Martinez-Delgado, 2005; Davidge, 2005). Compared to its brighter cousins, NGC 147 is gas and dust free. Asymptotic giant branch (AGB) stars contribute only 2-3% of the total light of this galaxy (Davidge, 1994). By means of its stellar content, NGC 147 resembles a typical dwarf spheroidal galaxy in the Local Group. However, it is much more luminous. The distance to NGC 205, NGC 185 and NGC 147, their stellar populations and star formation histories are being studied actively (e.g. McConnachie 2005, Butler & Martinez-Delgado 2005, Dolphin 2005). Table 1 summarises their distances, brightnesses, and reddenings used in this paper for the studied galaxies. We use a standard reddening law with . We note that we find indications for a slightly smaller distance modulus, mag, for NGC 205 compared to the values derived by McConnachie (2005), mag, and Dolphin (2005), mag, based on the results of our stellar photometry (see Sect. 3).
| NGC | ||||
|---|---|---|---|---|
| 147 | 23.951 | 0.580 | ||
| 185 | 24.151 | 0.593 | ||
| 205 | 24.380 | 0.206 |
| Object | V | [Fe/H] | ||
|---|---|---|---|---|
| NGC 147 | ||||
| HodgeI | ||||
| HodgeII | …. | |||
| HodgeIII | ||||
| NGC 185 | ||||
| FJJI | ||||
| FJJII | …. | …. | ||
| FJJIII | , | |||
| FJJIV | , | |||
| FJJV | …. | , | ||
| FJJVII | …. | …. | ||
| NGC 205 | ||||
| HubbleI | …. | |||
| HubbleII | ||||
| HubbleV | …. | |||
| …. | ||||
| HubbleVI | ||||
| HubbleVII | ||||
| HubbleVIII |
| Object | Date | Exposure | Seeing |
|---|---|---|---|
| NGC 147 | |||
| Hodge I, II, III | 23.09.2003 | 3x900s | 1.2 |
| NGC 185 | |||
| FJJIII, IV, V, VI, VII | 22.09.2003 | 4x900s | 1.2 |
| FJJI, FJJII | 26.09.2003 | 3x900s | 1.2 |
| FJJVIII | 26.09.2003 | 3x600s | 1.2 |
| NGC 205 | |||
| Hubble II, V, VI, VII | 23.09.2003 | 4x900s | 1.2 |
| Hubble I | 25.09.2003 | 900s | 1.2 |
| Stars | |||
| HD10307 | 25.09.2003 | 2x30s | 1.2 |
| HD26784 | 26.09.2003 | 2x20s | 1.2 |
| HD26757 | 26.09.2003 | 2x20s | 1.2 |
| BD+26377 | 26.09.2003 | 2x30s | 1.2 |
Each of our sample galaxies hosts a sizable globular cluster system (GCS). The discovery of globular clusters in NGC 147, NGC 185 and NGC 205 includes the work of Hubble (1932), Baade (1944), Hodge (1974) and Ford, Jacoby, & Jenner (1977, hereafter FJJ77) (see Da Costa and Mould (1988) and van den Bergh (2000) for details). All searches of GCs were carried out on photographic plates. The clusters were classified as being associated with the galaxies by their galactocentric radius. However, recent studies of GCSs in dwarf galaxies reveal globular clusters situated far from optical bodies of their host galaxies (see e.g. Hwang et al. 2005). It is likely that detailed wide-field investigations may discover additional GC candidates around NGC 147, NGC 185 and NGC 205 using new observational facilities and improved classification schemes which would allow the measurement of real physical sizes of the GCSs in these dwarf galaxies. Four extended globular clusters were discovered in the outer halo of M31 by Huxor et al., 2005) using INT-WFS images. Recent HST based surveys reveal new globular cluster candidates in M31 (Barmby & Huchra 2001, see also the summary of optical and IR photometry in Galleti et al. 2004). For instance, there are objects in the catalog of Galleti et al. (2004) within a radius of 20 around the center of NGC 205. Galleti et al. (2006) emphasize that our knowledge about the M31 GCS is far from complete even in terms of simple membership and undertake a large spectroscopic survey of bona-fide globular clusters and cluster candidates in M31. Obtaining radial velocities for GCs in the M31 halo and in the dwarf galaxies, detailed CMD and abundance studies will certainly help to solve the problem of the origin of M31 and of the satellite galaxies.
The properties of the globular clusters in NGC 147, NGC 185 and NGC 205 from the literature are summarised in Table 2. Da Costa and Mould (1988) first obtained spectra for eight Hubble clusters, the nucleus of NGC 205, FJJ77 clusters I–V in NGC 185 and for the two clusters Hodge I and III in NGC 147. A comparison of line strengths relative to similar spectra of Galactic globular clusters indicated that with a single exception, of the central GC Hubble V in NGC 205, all the clusters in NGC 147, NGC 185 and NGC 205 are old and metal-poor. The age estimates for Hubble V fall in a wide range from Myr (based on photometry, Lee, 1996) to intermediate ages (based on optical and far-ultraviolet imaging with HST/WFPC2, Jones et al., 1996). Star cluster formation seems to be a more extended process in NGC 185. A star forming region of emission with a diameter of 50 pc near the center of NGC 185 may be a probable place of a massive young star cluster birth according to a modern evolutionary scheme (Gallagher & Grebel, 2001 and references therein). Young & Lo (1997) estimated the mass of the brightest central HI clump in NGC 185 and the corresponding virial mass a factor of 100 higher. The clump is associated with a massive giant molecular cloud.
In this paper, we derive ages, metallicities, and [/Fe] ratios for globular clusters in NGC 147, NGC 185 and NGC 205 based on measurements of absorption line indices as defined by the Lick standard system (Burstein et al. 1984; Worthey et al. 1994; Worthey & Ottaviani 1997; Trager et al. 1998). The main advantage of this system is its ability to disentangle age from metallicity using the information on the strength of prominent diagnostic absorption line features measured in the intermediate-resolution integrated-light spectra.
The paper is organised as follows. In Section 2 we describe our spectroscopic data, the data reduction, as well as our methods and results of measuring Lick line indices in the spectra of globular clusters and the diffuse host galaxy light. In Section 3 we present results from our CMD photometry analysis of globular clusters, where we compare the loci of red giant branch (RGB) and horizontal branch (HB) stars with the Victoria-Regina stellar models of VandenBerg et al. (2006). In Section 4 we discuss the derived evolutionary parameters for globular clusters and compare them with the data available in the literature.
2 Spectroscopic data
2.1 Observations and data reduction
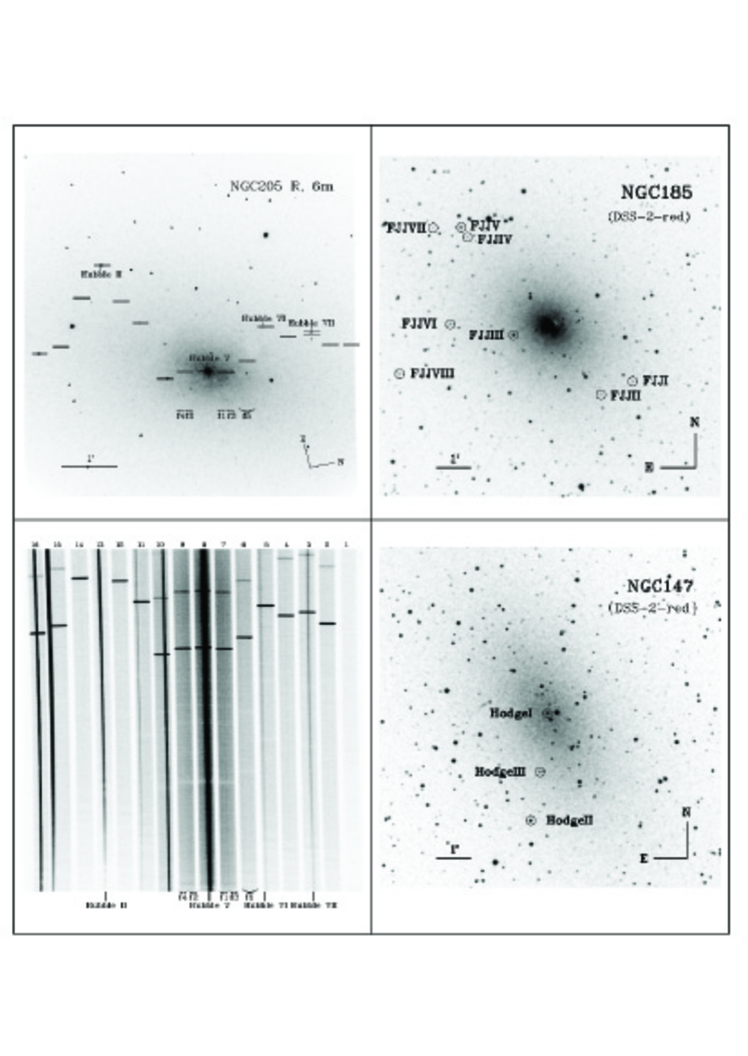
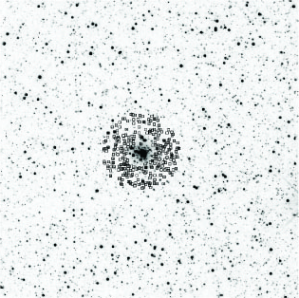
The observations were performed with the multi-slit unit of the SCORPIO spectrograph (Afanasiev & Moiseev, 2005), installed at the prime focus of the 6-m telescope of the Russian Academy of Sciences. Fig. 1 shows DSS-2-red images of NGC 147 and NGC 185 with marked globular clusters as well as the 6-m telescope image of NGC 205 with marked settings of the slits and an image of the corresponding raw spectra. In multi-slit mode SCORPIO has 16 movable slits (12 x 180) in the field of 29 x 59 in the focal plane of the telescope. We use the CCD detector EEV42-40 with 2048 x 2048 pixel elements and the scale per pixel. The grism GR1200g (1200 lines/mm) gives a spectral resolution Å. The exact spectral coverage of an individual spectrum depends on the distance of the slit position from the meridian of the field. Most of our spectra have good wavelength coverage between Å. Slit positions were set based on pre-imaging obtained with the same instrument.
A journal of observations is given in Table 3. Globular clusters covered by one slitmask pointing are listed in one row. All objects, including standard stars, were observed with the same setup of the multi-slit unit. Resulting spectra of the globular clusters and of diffuse light are shown in Fig. 2.
| Index | c | rms error | Index range | units |
|---|---|---|---|---|
| Ca4227 | 0.117 | 0.055 | [0.03 – 0.8] | Å |
| G4300 | 0.520 | 0.332 | [2.6 – 5.3] | Å |
| Fe4384 | 0.767 | 0.235 | [2.3 – 4.0] | Å |
| Ca4455 | 0.851 | 0.136 | [0.9 – 1.3] | Å |
| Fe4531 | 0.197 | 0.611 | [2.2 – 2.7] | Å |
| Fe4668 | 0.068 | 0.673 | [2.2 – 3.8] | Å |
| H | 0.024 | 0.197 | [2.3 – 3.8] | Å |
| Fe5015 | 0.577 | 0.284 | [3.4 – 4.2] | Å |
| Mg1 | 0.009 | 0.008 | [0.01 – 0.03] | mag |
| Mg2 | 0.019 | 0.006 | [0.08 – 0.16] | mag |
| Mgb | 0.243 | 0.162 | [1.9 – 3.0] | Å |
| Fe5270 | 0.223 | 0.546 | [1.5 – 2.3] | Å |
| Fe5335 | 0.201 | 0.398 | [1.4 – 1.7] | Å |
| Fe5406 | 0.120 | 0.049 | [0.7 – 1.2] | Å |
| H | 0.417 | 0.383 | [0.4 – 2.4] | Å |
| H | 0.191 | 0.364 | [0.0 – 2.0] | Å |
The detailed description of all reduction steps is given in Sharina et al. (2005). Here we briefly review major points of our reduction strategy.
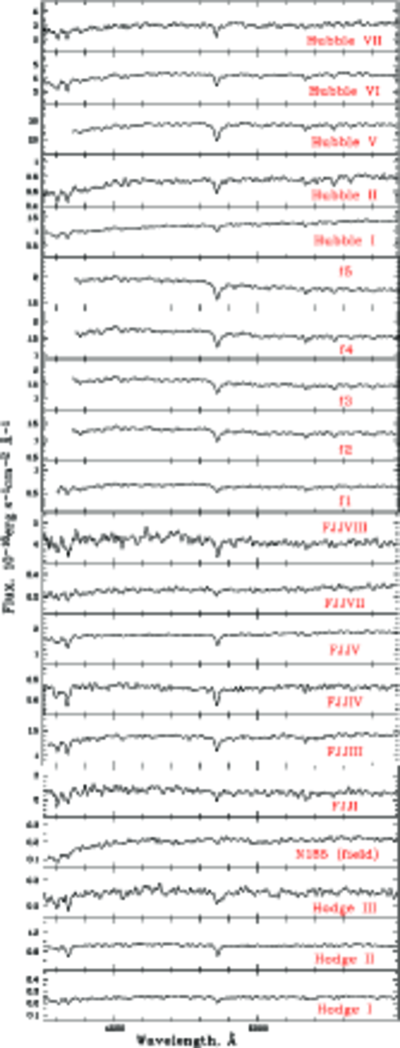
The basic data reduction was carried out using software packages within the Interactive Data Language (IDL). The subsequent data analysis was carried out in MIDAS. The data reduction included removing cosmics, bias subtraction, flat-field correction, and correction of geometric field distortion. After wavelength calibration and sky subtraction, aperture windows in the direction of the spatial axis were defined, and the spectra were extracted by summing the two-dimensional spectra in the spatial direction. Then the spectra were corrected for atmospheric extinction and were flux-calibrated. We use spectroscopic Lick standard stars, observed in the same night through the central slit of the slit mask, for flux calibration of all spectra. In those nights when radial velocity standard stars were not observed, we use spectra of the twilight sky to compute radial velocities relative to telluric lines. In addition to the spectra of globular clusters, we analysed spectra of the diffuse galaxy light in the same way. These spectra were obtained near the cluster FJJIII in NGC 185 and in fields f1 – f5 in NGC 205 (see Fig. 2 for details).
2.2 Calibration of Lick indices
Before measuring indices, we degraded our spectra to the resolution of the Lick system, taking into account its wavelength-dependent resolution (Worthey & Ottaviani, 1997). The effective resolution of our spectra has been determined using spectra of standard stars as a width (FWHM) of the corresponding autocorrelation function divided by (Tonry & Davis 1979). The resolution-correction technique is described in detail in Puzia et al. (2002). Lick indices were measured on spectra corrected for radial velocities (Table 7), with a typical radial velocity error of km s-1. Chilingarian et al. (2005) measured radial velocities for GCs FJJIV and HodgeII according to our request using his method and obtained and km s-1, correspondingly, in very good agreement with our measurements. The spectra of diffuse galactic light were corrected for velocity dispersion determined using algorithms of Tonry & Davis (1979). Broadening of lines in the spectra of diffuse galactic light due to velocity dispersion for the fields f1 – f5 in NGC 205 and the field in NGC 185, accordingly, was obtained to be 1.5 0.3 Å, 1.5 0.3 Å, 1.4 0.3 Å, 1.3 0.3 Å, 1.3 0.3 Å, 1.1 0.3 Å, 0.9 0.5 Å. The velocity dispersion determined by us for the central parts of the galaxies is slightly larger than that from the literature (Carter & Sadler 1990, Bender et al. 1991, Prugniel & Soubiran 2001), but still well within the errors. Table 4 summarizes zero points of the linear transformation of our index measurements to the Lick/IDS standard system with the corresponding rms errors. We obtained these zeropoints from observations of standard stars listed in Table 3. These zeropoints coincide well within the errors with those obtained in other nights from observations of a large set of Lick standard stars with the multi-slit unit of the SCORPIO spectrograph equipped with a grism VPHG1200g which provides a spectral resolution Å (Sharina et al., 2006). Lick indices were measured using the code GONZO (Puzia et al. 2002). The Lick index uncertainties were determined from bootstrapping the object spectrum. All index values and the errors for observed globular clusters, diffuse-light fields, and combined spectra of globular clusters are presented in Tables 5 and 6.
2.3 Ages, metallicities and [/Fe] ratios
In the following we compute ages, metallicities, [Z/H] 111We use the standard definition, , where X and Y are masses of specific elements. A designation [Z/H] implies the overall metallicity., and [/Fe] for our sample globular clusters using the information acquired from the measurements of the Lick indices.
| ID | S/N | Ca4227 | G4300 | H | H | Fe4383 | Ca4455 | Fe4531 | Fe4668 |
|---|---|---|---|---|---|---|---|---|---|
| (Å) | (Å) | (Å) | (Å) | (Å) | (Å) | (Å) | (Å) | ||
| HodgeI | 20 | 0.15 | 3.41 | 0.10 | 1.27 | 2.53 | 0.42 | 0.91 | 0.16 |
| 0.05 | 0.13 | 0.42 | 0.42 | 0.19 | 0.20 | 0.24 | 0.31 | ||
| HodgeII | 34 | 0.36 | 0.58 | 2.64 | 2.04 | 0.55 | 0.79 | 0.86 | -0.44 |
| 0.02 | 0.06 | 0.25 | 0.25 | 0.10 | 0.11 | 0.13 | 0.18 | ||
| HodgeIII | 14 | 0.14 | 2.30 | 0.72 | 1.60 | 0.12 | 0.53 | 1.62 | 1.94 |
| 0.08 | 0.21 | 0.70 | 0.71 | 0.29 | 0.32 | 0.37 | 0.51 | ||
| all N147 GCs | 43 | 0.30 | 1.39 | 1.35 | 1.80 | 1.05 | 0.66 | 1.08 | -0.01 |
| 0.02 | 0.04 | 0.15 | 0.15 | 0.06 | 0.07 | 0.08 | 0.11 | ||
| FJJI | 18 | 0.84 | 3.00 | 2.78 | 2.27 | 2.11 | 0.77 | 0.82 | -1.41 |
| 0.09 | 0.20 | 0.62 | 0.63 | 0.32 | 0.34 | 0.37 | 0.45 | ||
| FJJIII | 55 | …. | 0.92 | 0.88 | 1.65 | 0.51 | 0.74 | 1.11 | -0.21 |
| …. | 0.05 | 0.15 | 0.16 | 0.07 | 0.08 | 0.08 | 0.12 | ||
| FJJIV | 30 | …. | 1.02 | 2.32 | 2.17 | 0.69 | 0.84 | -0.28 | 0.36 |
| …. | 0.07 | 0.29 | 0.29 | 0.12 | 0.13 | 0.16 | 0.21 | ||
| FJJV | 70 | …. | 1.75 | 2.05 | 2.06 | 0.93 | 1.15 | 1.21 | -0.04 |
| …. | 0.03 | 0.12 | 0.13 | 0.05 | 0.06 | 0.07 | 0.10 | ||
| FJJVII | 16 | 0.74 | 2.55 | 0.33 | 1.60 | 3.37 | 1.59 | 3.15 | 0.45 |
| 0.10 | 0.20 | 0.72 | 0.73 | 0.31 | 0.33 | 0.39 | 0.58 | ||
| FJJVIII | 20 | -0.12 | 1.61 | 2.08 | 1.91 | 1.12 | 0.46 | 1.06 | 0.70 |
| 0.07 | 0.20 | 0.63 | 0.64 | 0.34 | 0.36 | 0.40 | 0.51 | ||
| NGC185 field | 27 | …. | …. | …. | 1.21 | 0.88 | 1.76 | 0.97 | 0.02 |
| …. | …. | …. | 0.06 | 0.21 | 0.24 | 0.28 | 0.36 | ||
| FJJI+III+IV+ | 106 | …. | …. | 1.70 | 2.05 | 1.22 | 0.68 | 1.21 | -0.54 |
| …. | …. | 0.06 | 0.06 | 0.02 | 0.03 | 0.03 | 0.04 | ||
| all N147 GC+ | 120 | …. | …. | 1.61 | 2.00 | 1.17 | 0.67 | 1.11 | -0.47 |
| +FJJI+III+IV+ | 0.05 | 0.05 | 0.02 | 0.02 | 0.03 | 0.03 | |||
| +V+VIII | |||||||||
| HubbleI | 20 | 0.70 | 2.59 | 0.10 | 1.31 | 1.44 | 0.72 | 1.19 | 1.24 |
| 0.08 | 0.18 | 0.64 | 0.65 | 0.29 | 0.30 | 0.33 | 0.46 | ||
| HubbleII | 86 | 0.33 | 2.47 | 0.53 | 1.53 | 1.82 | 1.14 | 1.82 | 0.08 |
| 0.00 | 0.02 | 0.07 | 0.07 | 0.03 | 0.04 | 0.04 | 0.05 | ||
| HubbleV | 180 | …. | …. | …. | …. | 0.79 | 1.15 | 1.66 | 1.18 |
| …. | …. | …. | …. | 0.00 | 0.01 | 0.01 | 0.01 | ||
| HubbleVI | 26 | 0.62 | 2.25 | 2.22 | 2.61 | 3.05 | 1.23 | 2.34 | 0.64 |
| 0.05 | 0.11 | 0.35 | 0.35 | 0.18 | 0.19 | 0.21 | 0.26 | ||
| HubbleVII | 36 | 0.47 | 2.68 | -0.03 | 1.42 | 1.52 | 0.55 | 1.76 | -1.21 |
| 0.03 | 0.07 | 0.23 | 0.23 | 0.11 | 0.12 | 0.14 | 0.17 | ||
| HubbleI+VII | 100 | 0.56 | 2.73 | 0.16 | 1.35 | 1.48 | 0.56 | 1.92 | 1.04 |
| 0.02 | 0.05 | 0.13 | 0.14 | 0.08 | 0.08 | 0.09 | 0.11 | ||
| HubbleVI+FJJVII | 30 | 0.55 | 2.42 | 1.06 | 1.51 | 3.56 | 1.44 | 2.49 | 0.31 |
| 0.03 | 0.07 | 0.27 | 0.27 | 0.12 | 0.13 | 0.15 | 0.20 | ||
| NGC205 f1 | 130 | …. | …. | …. | …. | 2.08 | 1.44 | 1.78 | 2.87 |
| …. | …. | …. | …. | 0.04 | 0.04 | 0.05 | 0.07 | ||
| NGC205 f2 | 80 | …. | …. | …. | …. | 1.57 | 1.46 | 2.25 | 1.60 |
| …. | …. | …. | …. | 0.03 | 0.04 | 0.04 | 0.06 | ||
| NGC205 f3 | 76 | …. | …. | …. | …. | 1.83 | 1.26 | 2.54 | 3.06 |
| …. | …. | …. | …. | 0.04 | 0.04 | 0.04 | 0.06 | ||
| NGC205 f4 | 80 | …. | …. | …. | …. | 0.94 | 1.46 | 1.73 | 2.90 |
| …. | …. | …. | …. | 0.04 | 0.04 | 0.05 | 0.06 | ||
| NGC205 f5 | 54 | …. | …. | …. | …. | 3.02 | 1.46 | 1.39 | 2.27 |
| …. | …. | …. | …. | 0.05 | 0.06 | 0.07 | 0.11 | ||
| NGC205 f1,f2,f3 | 180 | …. | …. | …. | …. | 1.63 | 1.35 | 2.12 | 2.17 |
| …. | …. | …. | …. | 0.01 | 0.01 | 0.01 | 0.02 | ||
| NGC205 f4,f5 | 100 | …. | …. | …. | …. | 2.41 | 1.57 | 1.54 | 2.64 |
| …. | …. | …. | …. | 0.03 | 0.03 | 0.03 | 0.04 |
| GCname | H | Fe5015 | Mg1 | Mg2 | Mgb | Fe5270 | Fe5335 | Fe5406 |
|---|---|---|---|---|---|---|---|---|
| (Å) | (Å) | (mag) | (mag) | (Å) | (Å) | (Å) | (Å) | |
| HodgeI | 2.71 | 1.48 | 0.013 | 0.076 | 0.67 | 1.07 | 0.35 | -0.55 |
| 0.31 | 0.34 | 0.009 | 0.009 | 0.37 | 0.37 | 0.38 | 0.38 | |
| HodgeII | 3.13 | 1.14 | 0.012 | 0.029 | 0.62 | 0.65 | 0.74 | 0.17 |
| 0.18 | 0.21 | 0.005 | 0.005 | 0.23 | 0.23 | 0.24 | 0.24 | |
| HodgeIII | 1.92 | 0.09 | 0.008 | 0.031 | 0.32 | 0.94 | 0.69 | 0.36 |
| 0.52 | 0.58 | 0.015 | 0.015 | 0.64 | 0.66 | 0.67 | 0.68 | |
| all N147 GCs | 2.85 | 1.24 | 0.015 | 0.046 | 0.66 | 0.97 | 0.61 | -0.02 |
| 0.11 | 0.12 | 0.003 | 0.003 | 0.14 | 0.14 | 0.14 | 0.14 | |
| FJJI | 2.00 | 1.04 | 0.003 | 0.077 | 2.09 | 0.97 | -0.13 | 0.86 |
| 0.46 | 0.51 | 0.015 | 0.015 | 0.55 | 0.56 | 0.57 | 0.57 | |
| FJJIII | 2.40 | 2.59 | 0.003 | 0.057 | 0.79 | 0.60 | 0.75 | 0.45 |
| 0.12 | 0.13 | 0.003 | 0.003 | 0.14 | 0.14 | 0.15 | 0.15 | |
| FJJIV | 2.70 | 0.61 | -0.026 | 0.018 | 0.78 | 0.35 | 0.75 | -0.00 |
| 0.21 | 0.24 | 0.005 | 0.005 | 0.26 | 0.26 | 0.27 | 0.27 | |
| FJJV | 2.73 | 1.94 | 0.010 | 0.048 | 0.60 | 0.63 | 0.41 | 0.37 |
| 0.10 | 0.11 | 0.002 | 0.002 | 0.12 | 0.12 | 0.12 | 0.12 | |
| FJJVII | 2.91 | 2.65 | 0.020 | 0.056 | 1.31 | 1.85 | 2.16 | 0.37 |
| 0.59 | 0.63 | 0.016 | 0.016 | 0.66 | 0.67 | 0.68 | 0.69 | |
| FJJVIII | 2.47 | 2.22 | 0.022 | 0.057 | 1.11 | 1.15 | -0.37 | 0.32 |
| 0.51 | 0.54 | 0.014 | 0.014 | 0.59 | 0.60 | 0.60 | 0.60 | |
| NGC185 field | 2.08 | 3.65 | 0.053 | 0.066 | 0.73 | -0.68 | 1.40 | 0.77 |
| 0.37 | 0.42 | 0.010 | 0.010 | 0.45 | 0.46 | 0.47 | 0.48 | |
| FJJI+III+IV+ | 2.37 | 1.77 | 0.011 | 0.058 | 0.99 | 0.90 | 0.02 | 0.18 |
| +V+VIII | 0.04 | 0.05 | 0.001 | 0.001 | 0.05 | 0.05 | 0.05 | 0.06 |
| all N147 GC+ | 2.41 | 1.65 | 0.012 | 0.057 | 0.94 | 0.85 | 0.13 | 0.14 |
| +FJJI+III+IV+ | 0.04 | 0.04 | 0.001 | 0.001 | 0.04 | 0.04 | 0.04 | 0.04 |
| +V+VIII | ||||||||
| HubbleI | 2.66 | 3.31 | 0.030 | 0.067 | 1.29 | 1.08 | 1.08 | 0.61 |
| 0.47 | 0.52 | 0.013 | 0.014 | 0.57 | 0.58 | 0.59 | 0.60 | |
| HubbleII | 2.32 | 2.75 | 0.017 | 0.071 | 1.23 | 1.17 | 1.09 | 0.68 |
| 0.05 | 0.06 | 0.002 | 0.002 | 0.06 | 0.06 | 0.06 | 0.06 | |
| HubbleV | 4.14 | 3.06 | 0.013 | 0.069 | 1.35 | 1.69 | 1.31 | 0.88 |
| 0.01 | 0.01 | 0.000 | 0.000 | 0.02 | 0.02 | 0.02 | 0.02 | |
| HubbleVI | 3.12 | 2.21 | 0.014 | 0.080 | 1.42 | 2.51 | 1.88 | 0.62 |
| 0.27 | 0.29 | 0.008 | 0.008 | 0.31 | 0.31 | 0.32 | 0.32 | |
| HubbleVII | 2.39 | 2.16 | 0.011 | 0.070 | 1.18 | 0.94 | 0.45 | 0.58 |
| 0.18 | 0.19 | 0.005 | 0.005 | 0.21 | 0.21 | 0.21 | 0.22 | |
| HubbleI+VII | 2.60 | 2.90 | 0.043 | 0.081 | 0.62 | 0.53 | 0.62 | 0.45 |
| 0.11 | 0.12 | 0.003 | 0.003 | 0.12 | 0.12 | 0.13 | 0.13 | |
| HubbleVI+FJJVII | 2.86 | 2.82 | 0.016 | 0.073 | 1.56 | 2.09 | 1.82 | 0.72 |
| 0.21 | 0.22 | 0.006 | 0.006 | 0.24 | 0.24 | 0.25 | 0.25 | |
| NGC205 f1 | 3.36 | 3.58 | 0.042 | 0.091 | 1.74 | 0.78 | 1.18 | 1.08 |
| 0.07 | 0.08 | 0.002 | 0.002 | 0.09 | 0.09 | 0.09 | 0.10 | |
| NGC205 f2 | 3.86 | 4.03 | 0.031 | 0.081 | 1.81 | 1.67 | 1.34 | 1.04 |
| 0.06 | 0.07 | 0.002 | 0.002 | 0.08 | 0.08 | 0.09 | 0.09 | |
| NGC205 f3 | 3.60 | 3.25 | 0.018 | 0.079 | 1.76 | 1.78 | 1.86 | 1.42 |
| 0.06 | 0.07 | 0.002 | 0.002 | 0.08 | 0.08 | 0.09 | 0.09 | |
| NGC205 f4 | 3.30 | 3.51 | 0.037 | 0.081 | 1.53 | 1.69 | 1.20 | 1.15 |
| 0.06 | 0.07 | 0.002 | 0.002 | 0.09 | 0.09 | 0.09 | 0.09 | |
| NGC205 f5 | 2.81 | 2.53 | 0.012 | 0.094 | 1.49 | 1.05 | 2.02 | 0.77 |
| 0.11 | 0.12 | 0.003 | 0.003 | 0.13 | 0.14 | 0.14 | 0.14 | |
| NGC205 f1,f2,f3 | 3.45 | 3.42 | 0.024 | 0.078 | 1.66 | 1.62 | 1.37 | 1.07 |
| 0.02 | 0.02 | 0.000 | 0.001 | 0.03 | 0.03 | 0.03 | 0.03 | |
| NGC205 f4,f5 | 3.12 | 3.21 | 0.029 | 0.091 | 1.43 | 1.37 | 1.47 | 0.93 |
| 0.04 | 0.05 | 0.001 | 0.001 | 0.06 | 0.06 | 0.06 | 0.06 |
2.3.1 A three-dimensional interpolation and minimization routine
We developed a program for age, metallicity and [/Fe] determination which involves fitting all available Lick indices using the SSP model predictions of Thomas et al. (2004). Our three-dimensional linear interpolation routine obtains a full set of theoretical Lick indices from required ages, [Z/H], and [/Fe] ratios by minimization of the function:
where is the number of Lick indices involved in the analysis, is an observed index, is the total uncertainty of the index, including rms error of transformations to the Lick/IDS system, is the theoretical index prediction. The program computes 95% confidence intervals and 1- errors of ages, [Z/H], and [/Fe]. Our routine works entirely within the three-dimensional space defined by the model grids. The ranges of estimated values are Age: Gyr, dex, and dex. The program makes determinations based on 100 combinations of initial conditions randomly distributed within this three-dimensional space, and the most frequent event is taken as a value of the global minimum. The errors in age, [Z/H] and [/Fe] depend primarily on random index uncertainties and uncertainties of transformations to the Lick/IDS standard system.
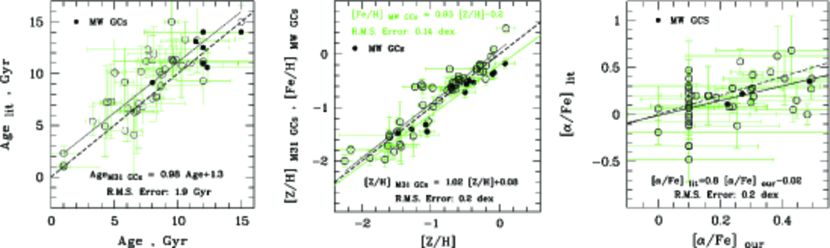
To test our routine we compare ages, [Z/H] and [/Fe] obtained by our program using the SSP model predictions from Thomas et al. (2004) with the ones available in the literature for 12 Galactic and 46 M31 globular clusters (see Figure 3). We use the Lick index data for M31 GCs with measurement uncertainties , , , and Å (see Puzia et al. 2005b) from Worthey et al. (1994), Kuntschner et al. (2002), Beasley et al. (2004), and Puzia et al. (2005a). The data on ages, [Z/H] and [/Fe] for M31 GCs were taken from Puzia et al. (2005a), and the Lick index data for Galactic globular clusters from Puzia et al. (2002). When applying our fitting routine to these Lick index data we use all available indices except for CN1 and CN2. We found that CN1 and CN2 increase the 1- errors of our results and can even skew them (see Proctor et al., 2004). Figure 3 demonstrates linear correlations between our determinations of age, metallicity and [/Fe] and the the corresponding data from the literature. We found the following linear relations: Gyr, dex, dex for the sample of MW GCs, and dex for M31 GCs.
Only three of the sample Galactic globular clusters have [/Fe] measurements from high-resolution spectroscopy of stars in 45 Milky Way globular clusters by Pritzl et al. (2005). We find that our results for Galactic GCs are close to the literature data. However, the data for M31 GCs scatter relative to the best least-square fit shown by a solid line on the third panel in Figure 3 with a rms error 0.2 dex. More high-resolution spectroscopy of individual stars in young and of low-[/Fe] GCs are needed to determine the real accuracy of our [/Fe] determination method. It should be pointed out that the relative error is fairly constant at around 0.3. Unfortunately, there are no GCs with young ages and low-[/Fe] in our comparison sample to check for potential biases in our spectroscopic age estimates. The middle panel of Figure 3 shows a tight correlation between [Fe/H] data from Harris for Galactic GCs (1996) and our estimates. The existence of the tight correlation between [Fe/H] data for Galactic GCs and [Z/H] values from SSP models was also noticed by Thomas et al. (2003) and Proctor et al. (2004). Proctor et al. (2004) referred this result to problems in the calibration of the Lick indices or the metallicity scale in SSP models. According to our exercise the [Fe/H]-[Z/H] correlation is not a one-to-one relation.
2.3.2 Results
Resulting ages, metallicities, and [/Fe] ratios obtained with our routine for GCs, diffuse-light fields and the stacked spectra of GCs in NGC 147, NGC 185, and NGC 205 are listed in Table 7. 1- uncertainties of our results for each object are summarized in Table 7.
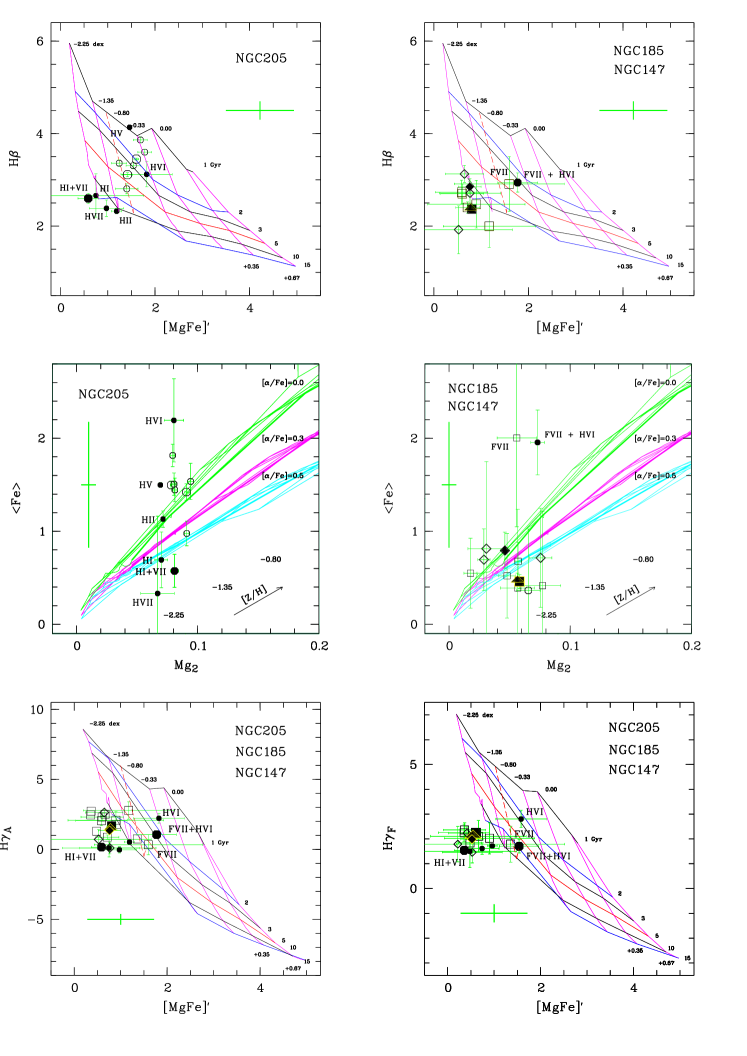
For all studied globular clusters we construct age-metallicity and [/Fe] diagnostic plots (see Fig. 4) similar to the techniques described in Puzia et al. (2005b). It is of interest to see whether the information coming from the age-metallicity plots coincides well with the results obtained by applying of our fitting routine. We use the SSP model predictions of Thomas et al. (2004) and an [/Fe]-insensitive metallicity index [MgFe]′ .
| Object | Age | [/Fe] | [Z/H] | ||
|---|---|---|---|---|---|
| (Gyr) | (dex) | (dex) | (km/s) | (kpc) | |
| NGC 147 | |||||
| HodgeI | 93 | 0.10.3 | 0.2 | 0.0 | |
| HodgeII | 82 | 0.10.3 | 0.2 | 0.6 | |
| HodgeIII | 103 | 0.50.4 | 0.2 | 0.3 | |
| all N147 GCs | 91 | 0.00.3 | 0.1 | ||
| NGC 185 | |||||
| FJJI | 94 | 0.30.3 | 0.2 | 0.7 | |
| FJJIII | 102 | 0.10.3 | 0.3 | 0.3 | |
| FJJIV | 92 | 0.00.2 | 0.3 | 0.8 | |
| FJJV | 92 | 0.00.3 | 0.2 | 0.9 | |
| FJJVII | 73 | 0.00.3 | 0.2 | 1.0 | |
| FJJVIII | 84 | 0.00.5 | 0.3 | 1.0 | |
| FJJVII+ | 52 | 0.00.3 | 0.2 | ||
| +HubbleVI | |||||
| FJJI+III+ | 92 | 0.30.2 | 0.2 | ||
| +IV+V+VIII | |||||
| field | 85 | 0.10.4 | 0.2 | 0.3 | |
| all N147 GC+ | 102 | 0.30.2 | 0.1 | ||
| +FJJI+III+ | |||||
| +IV+V+VIII | |||||
| NGC 205 | |||||
| HubbleI | 72 | 0.20.2 | 0.1 | 1.0 | |
| HubbleII | 102 | 0.00.2 | 0.1 | 0.7 | |
| HubbleV | 1.20.6 | 0.00.1 | 0.2 | 0.0 | |
| HubbleVI | 42 | 0.00.2 | 0.2 | 0.3 | |
| HubbleVII | 112 | 0.10.2 | 0.1 | 0.4 | |
| HubbleI+VII | 102 | 0.10.2 | 0.1 | ||
| f1 | 1.90.8 | 0.00.2 | 0.3 | 0.05 | |
| f2 | 1.20.8 | 0.00.2 | 0.3 | 0.07 | |
| f3 | 1.61.1 | 0.00.2 | 0.3 | 0.07 | |
| f4 | 1.81 | 0.50.4 | 0.3 | 0.10 | |
| f5 | 65 | 0.00.2 | 0.2 | 0.12 | |
| f1+f2+f3 | 1.60.8 | 0.00.2 | 0.2 | ||
| f4+f5 | 42 | 0.00.2 | 0.2 |
Inspection of Fig. 4 shows that for those globular clusters with multiple Balmer line indices the ages, metallicities, and [/Fe] ratios derived from different diagnostic plots are consistent with each other. The location of objects in these diagrams correspond well with our fitting results (Table 7). The problem of age determination for very metal-poor globular clusters arises, first, since the model lines cross in this region, and, second, because GCs tend to fall below the oldest model sequence (see Covino et al. 1995).
Our results reveal solar [/Fe] ratios for most of our sample globular clusters, which is consistent with slow and/or extended globular-cluster/star formation histories in their host dSph galaxies. Low [/Fe] enhancements were also found in individual red giant stars in dwarf spheroidal galaxies (dSph) with high-dispersion spectroscopy (e.g. Shetrone, Bolte & Stetson 1998, Smecker-Hane & McWilliam 1999, Bonifacio et al. 2000, Shetrone et al. 2001, Shetrone et al. 2003, Tolstoy et al. 2003, Geisler et al. 2005). Shetrone et al. (2001) and Tolstoy et al. (2003) suggested that the low abundance ratios at low metallicities could result from a slow star formation rate. Tolstoy et al. suggested that dSph galaxies experienced a fairly uniform chemical evolution despite their different SF histories. This conclusion was backed by theoretical model predictions (see e.g. Lanfranchi & Matteucci, 2003).
Suppose that our three samples of globular clusters with measured ages, [Z/H], and [/Fe] ratios in NGC 147, NGC 185, and NGC 205 were drawn from the same normally-distributed parent populations. To check the hypothesis we compare our three samples in pairs and apply the F-test (comparison of variances) and Student’s t-test (comparison of means, see e.g. Stuart & Ord 1994). The results of our statistical tests are summarised in Table 8. The F-test shows that at a significance level of 5% the variances are equal. That is the quotient of two variances is always less than the corresponding critical value of F-distribution. We compute the T-statistics where is a critical value of T-distribution at a significance level of ; and are numbers of degrees of freedom in the first and the second samples, and is a mean weighted variance , where and are variances for the two samples. One can see from Table 8 that the difference between mean values for the three samples taken in pairs is always less than the corresponding value. Hence, at a significance level of 5% the [/Fe] enhancements for the studied globular clusters in NGC 147, NGC 185, and NGC 205 have similar approximately zero values.
2.3.3 Individual globular cluster systems
NGC 205: We stack the spectra of the diffuse galaxy in NGC 205 in order to achieve a higher S/N. The measurements for fields f1–f5 are indicated by open circles in Fig. 4. Large open circles in the top and middle left panels of Fig. 4 illustrate the Lick index values for averaged spectra for the fields of diffuse light in NGC 205: f1+f2+f3 and f4+f5. Measurements for the combined spectrum for the clusters HubbleI + HubbleVII are shown as a large filled circle.
It is clear from the H diagnostic plot in the upper left panel of Fig. 4 and from Table 7 that the central globular cluster in NGC 205, Hubble V, and its surrounding fields f1, f2, f3 are consistent with the youngest ages in NGC 205 and in our entire sample. However, the metallicity of Hubble V appears to be lower than that of the surrounding fields. On the other hand, the second nearest globular cluster to the optical center of NGC 205, Hubble VI, has about the same metallicity but an older age relative to the very central stellar population. Finally, the more metal-poor globular clusters Hubble I, Hubble II, and Hubble VII are the oldest GCs in NGC 205. All three clusters are located at large galactocentric distances. Hence, our measurements show that there is a tendency of increasing age with increasing galactocentric distance for stellar populations in NGC 205. This fact is confirmed by extensive CMD studies of stellar populations in NGC 205 as it will be shown in Section 4.3.
NGC 185: This galaxy hosts eight off-center globular clusters. All of them are located at the projected distance [0.6 – 1.0] kpc from the optical center of the galaxy, except FJJIII with kpc. Fig. 4 shows that all observed GCs in NGC 185 are old and metal-poor with the exception of FJJVII, which appears to be the youngest and most metal-rich globular cluster in NGC 185 (see Tab. 7). FJJVII has approximately the same age and metallicity as HubbleVI in NGC 205 according to our measurements. The diagnostic plots and Table 7 show that the stacked spectrum of these two clusters shows the same intermediate-age and metallicity. Those two globular clusters may have formed some 4-6 Gyr ago. It will be shown in Sect. 4.2 that similar intermediate-age and metallicity GCs exist in the halo of M31.
NGC 147: All three observed globular clusters in NGC 147 are old and metal-poor, similar to what is found for globular clusters in NGC 185. It can be seen in Fig. 4 that the chemical compositions obtained from the stacked spectra for all GCs except FJJVII in NGC 185 (filled square), NGC 147 (filled diamond) and GCs Hubble I, and VII in NGC 205 (filled circle), as well as for all old and low metallicity GCs in NGC 185 and NGC 147 (filled triangle), coincide within the errors.
| Galaxy | N | F0.95 | T | t0.95 | ||
|---|---|---|---|---|---|---|
| NGC205 (1) | 5 | 0.008 | 5.01,2 | 0.06 | 0.111,2 | 1.78 |
| NGC185 (2) | 6 | 0.012 | 19.32,3 | 0.07 | 0.192,3 | 1.81 |
| NGC147 (3) | 2 | 0.05 | 19.31,3 | 0.23 | 0.171,3 | 1.86 |
3 Stellar photometry data
| Object | RA (J2000) DEC | Filter, chip | Dataset | Exposure time | [Fe/H] | age | ||
|---|---|---|---|---|---|---|---|---|
| (sec.) | (dex) | (Gyr) | (″) | |||||
| NGC 147 | ||||||||
| HodgeIIs | 00 33 15.20 +48 27 23.2 | F555W, F814W, 3 | U2OB01 | 4x1300, 4x1300 | 0.1 | 10 | 1: | 4.8 |
| NGC 185 | ||||||||
| FJJIs | 00 38 42.90 +48 18 41.2 | F555W, F814W, PC | U3KL01 | 3x2800, 2x1300 | 0.2 | 10 | 0.20.2 | 4.6 |
| FJJII | 00 38 48.30 +48 18 17.0 | F555W, F814W, PC | U3KL02 | 3x2800, 2x1300 | 0.2 | 10 | 0.2 | 3.5 |
| FJJIIIs | 00 39 03.90 +48 19 58.2 | F555W, F814W, PC | U3KL03 | 3x2800, 2x1300 | 0.1 | 10 | 0.50.3 | 4.1 |
| FJJIVs | 00 39 12.38 +48 22 49.2 | F555W, F814W, PC | U3KL04 | 3x2800, 2x1300 | 0.2 | 10 | 0.70.2 | 3.5 |
| FJJVs | 00 39 13.58 +48 23 05.8 | F555W, F814W, PC | U3KL04 | 3x2800, 2x1300 | 0.1 | 10 | 0.90.1 | 4.0 |
| NGC 205 | ||||||||
| HubbleIIs | 00 40 33.81 +41 39 40.2 | F555W, F814W, PC | U3KL06 | 3x2800, 2x1300 | 0.1 | 10 | 0.3 | 3.2 |
| HubbleVIII | 00 39 53.99 +41 47 19.2 | F555W, F814W, PC | U3KL10 | 3x2800, 2x1300 | 0.2 | 10 | 0.70.2 | 3.8 |
3.1 Data Reduction
In order to test whether our spectroscopic results are consistent with fundamental parameters derived from CMDs, we search the HST archive for available photometry for our sample globular clusters. Table 9 summarises the result of our search, which recovered useful WFPC2 data for eight globular clusters. We use the HSTphot package (Dolphin, 2000a) to perform stellar photometry and artificial star tests. We use the charge transfer efficiency and zero-point magnitude correction derived by Dolphin (2000b). Stars with S/N , , and , were eliminated from the final photometry list. The uncertainty of transformations from the WFPC2 instrumental system to the standard Johnson-Cousins system contains many factors. The most important of them are uncertainties of photometric zeropoints (0003 for the F555W filter, 0002 for F814W filter), the CTE correction (001) and the aperture corrections (005) (Dolphin, 2000b).
3.2 Color-Magnitude and Hess Diagrams
In order to avoid crowding we analyze in the following only globular clusters imaged with the PC chip (00455/pixel). One exception is the cluster Hodge II which is located in a very sparse field of NGC 147 and is imaged with the WF3 chip of WFPC2. However, the surrounding field of this cluster is sparse enough to provide reliable stellar photometry. In general, photometric data for globular clusters imaged with lower resolution and/or located in the central dense regions of the galaxies reveal too high photometric errors to confidently determine ages and [Fe/H]. We calculate absolute stellar magnitudes using reddening and distance estimates listed in Table 1.
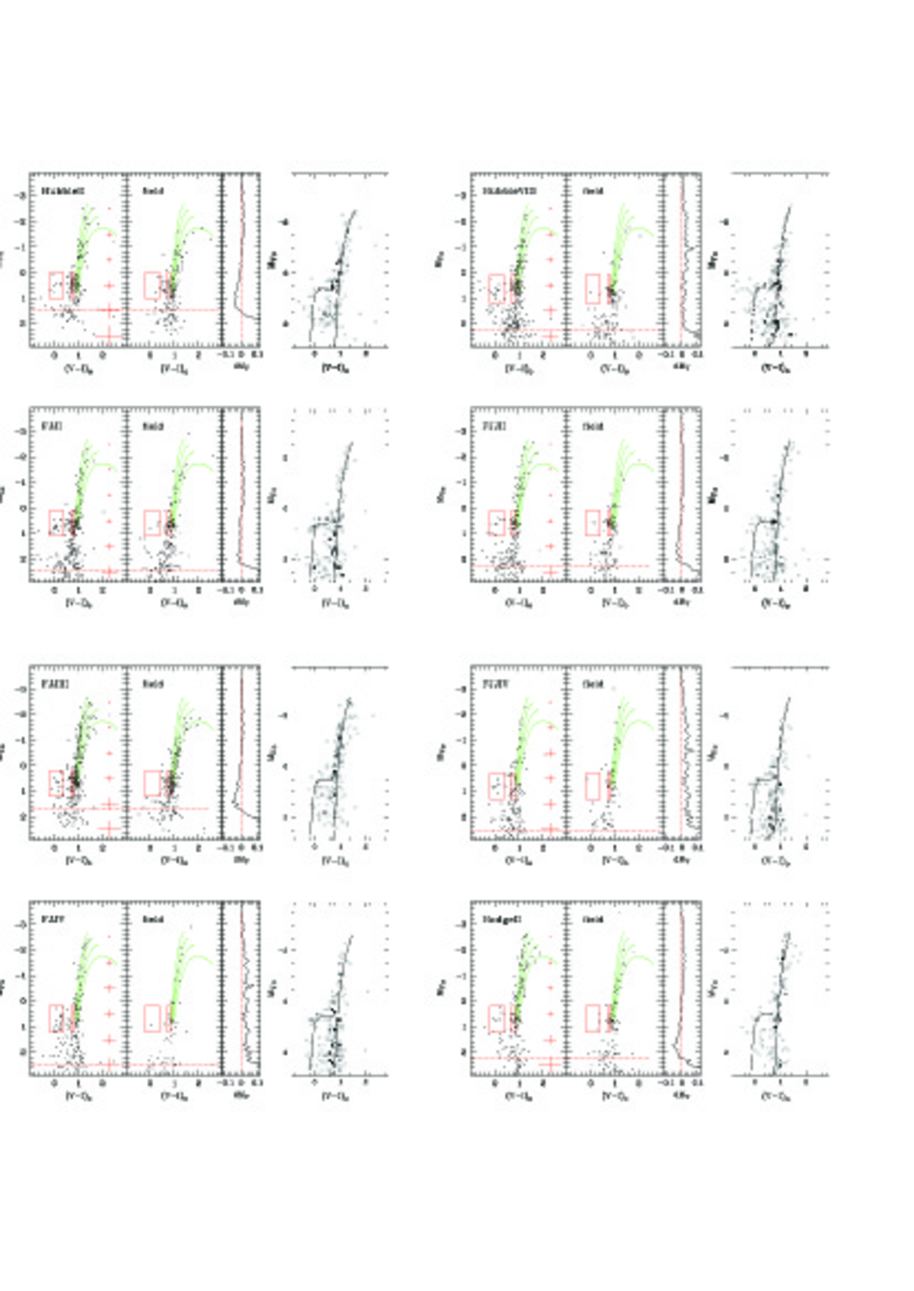
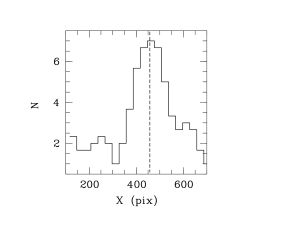
Fig. 5 shows CMDs and Hess diagrams for stars within the radius for all our sample GCs. 222The figures for each globular cluster can be downloaded from the anonymous ftp site: ftp.sao.ru (directory: /pub/sme/GCsM31dEs). We consider the radius of a GC to be defined by the full area occupied by the bluest stars (old HB stars). To illustrate how was derived, we demonstrate spatial distribution of blue stars in the globular cluster FJJI along X axis (Fig. 6). Blue stars with were selected in a 200 by 800 pixel rectangular area centered on the cluster. The distribution shows a clear maximum towards the center of the cluster. Similar distributions were constructed for each of the studied clusters in X and Y directions, and the determined two values of were averaged. We adopt the size roughly 10 – 20% smaller than the full area outlined by blue stars to reduce contamination effects. This area roughly corresponds to at a level of the number of blue stars: , where is the mean number of blue stars around the studied cluster, and is the standard deviation of this number. Structural parameters of globular clusters in NGC 205, NGC 185 and NGC 147 will be studied in our follow-up paper. Here we note that the sizes of the clusters measured using the distributions of blue stars are times larger than the corresponding effective radii. For example, FJJI has , whereas its is . It should be noted that central regions of the clusters do not show the presence of resolved stars which pass our goodness-of-fit criteria. This fact was taken into account in selection of field stars surrounding a cluster. The area for selection of such stars was computed as , where is the radius of a globular cluster determined via spatial distribution of blue stars and is the radius of the central unresolved area.
Fig. 5 consists of four panels for each globular cluster. An uncleaned CMD for stars within of each globular cluster is illustrated in the left panel. Empirical loci of RGBs for Galactic globular clusters are shown for comparison (Lee et al., 1993). CMDs for field stars from an equal area is shown in the second panel. The third panel represents the difference between recovered magnitude and input magnitude for recovered stars obtained from artificial star tests. It is clear that systematic effects do not exceed 005 for stars with the completeness limit of %, which is indicated by a dotted line. Given the quality of the data we are able to estimate the horizontal branch morphology index (see below) with a high level of confidence.
The forth panel represents Hess-diagrams after decontamination from the field contribution. The statistical field subtraction was done in the following way: 1. We constructed a Hess-diagram for stars within of each globular cluster. 2. Similar Hess-diagrams were obtained for stars surrounding the corresponding globular cluster. To take into account statistical fluctuations of the number of stars we consider stars in an annulus around the studied cluster. Our simulations show that four separate areas around the studied cluster are representative enough to construct Hess-diagrams for field stars, which alleviates the problems of constructing background samples when a GC is located near to the image edge. 3. A mean Hess-diagram was computed from these four Hess-diagrams. 4. A cleaned Hess-diagram was calculated as a difference between the contaminated Hess-diagram and the mean Hess-diagram for field stars. Positive data indicate the locus of GC stars in the cleaned Hess-diagram. Solid lines represent the fundamental Zero Age Horizontal Branches (ZAHB) and isochrones taken from the Victoria-Regina stellar models of VandenBerg et al. (2006). Corresponding ages and metallicities are listed in Table 9.
3.3 Comparison with Victoria-Regina Models
To fit theoretical isochrones to our stellar photometry data we use the ages, [Z/H] and [/Fe] obtained in our spectroscopic study. We note that was adopted for all studied globular clusters according to our spectroscopic results (see Section 2.3). Pipino et al. (2006) adopted a relation for Thomas et al. (2003) SSP models on the basis of a calibration on Galactic globular clusters. Since we found that GCs in NGC 147, 185 and 205 have approximately solar [/Fe], it means that in our case. We have no spectroscopic data for Hubble VIII and FJJII. As a starting point for the spectroscopy-CMD comparison we adopt for these two clusters the age, metallicity, and [/Fe] values obtained from the averaged spectra of Hubble I+VII and all GCs in NGC 185.
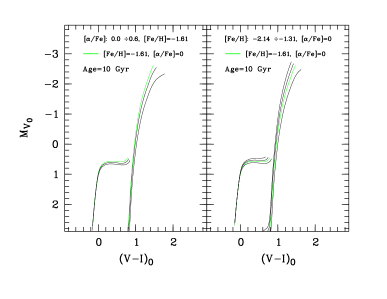
To show how the choice of different isochrones affects our results we plot isochrones and ZAHBs (VandenBerg et al., 2006) for different [Fe/H] and [/Fe] (Fig. 7), and adopt the age of 10 Gyr. The isochrones and ZAHBs for Gyr, and are drawn by grey lines. The difference in between isochrones that differ by 2 Gyr is of the order of a few hundredth of a magnitude. So, if we know the metallicity and [/Fe], the typical error of age determinations for the globular clusters studied photometrically is Gyr given the accuracy of our photometry and the scatter of the data for individual red-giant stars relative to fitted isochrones. However, since the accuracy of our spectroscopic metallicity and [/Fe] determinations is low in some cases, the uncertainties of the transformations into the standard VI system are 005, and due to the effect of age-metallicity degeneracy on the color of the RGB (e.g. Saviane et al. 2000, Dolphin et al., 2003), we estimate the error of our photometric age determinations to be Gyr.
For all GCs, except Hubble II in NGC 205, the ages, metallicities, and [/Fe] ratios derived by measuring the Lick indices provide a good correspondence between the loci of RGB and HB stars and the theoretical models. The HB stars in Hubble II seem too bright for their metallicity, whereas the loci of RGB stars agree well with the spectroscopically derived metallicity. Our analysis indicates that in order to achieve good agreement between our spectroscopic and photometric results we have to reduce the distance modulus to NGC 205, (McConnachie, 2005), by 0.2 mag. The resulting distance modulus is given in Table 1. The same distance modulus was applied to Hubble VIII in NGC 205.
There is a discrepancy between our spectroscopic () and photometric () metallicity estimates for FJJI. We adopt a mean value for this cluster [ which coincides with a value obtained by Da Costa & Mould (1988).
3.4 Horizontal-Branch Morphology
Blue HB (BHB) and red HB stars (RHB) in our sample globular clusters were selected according to the boxes marked in Fig. 5. The boundaries of the instability strip in the filter set were taken from Harbeck et al. (2001): . We determine the HB morphology index (Zinn et al. 1994) for each cluster. The resulting HB morphology indices are listed in Table 9. Errors of the HB morphology indices were determined by taking into account variations of a number of blue and red HB stars in the field regions. All globular clusters studied here appear to contain a significant population of BHB stars within their radius.
4 Discussion
4.1 The Second Parameter Effect
The morphology of the HB and the mean luminosity of the HB stars depend primarily on metallicity. Age is suspected to be the ”second parameter” (Lee et al. 1994). In general, metal-poor old globular clusters have blue HBs and metal-rich 1–2 Gyr younger clusters have predominantly red HBs. However, it is known that more parameters may influence the HB morphology such as helium abundance, CNO abundance etc. (Lee et al. 1994). We suggest that the photometric data presented in our paper are accurate enough to consider the influence of age and metallicity on the HB morphology and to compare this effect with the one studied in the literature for globular clusters in our Milky Way and other nearby galaxies.
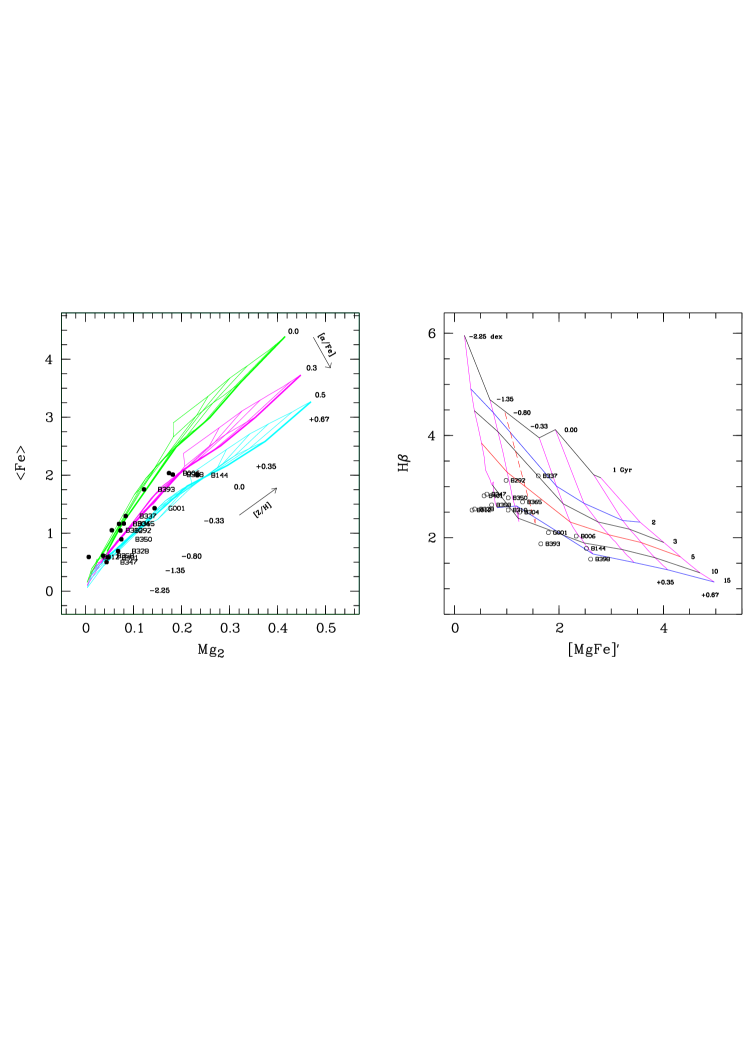
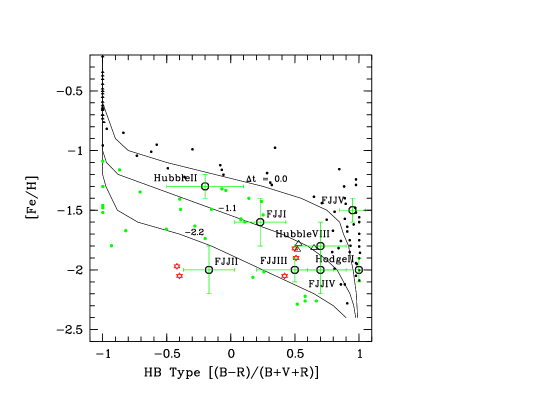
Fig. 8 shows the HB-type versus metallicity diagram for our eight sample globular clusters studied photometrically. The overplotted isochrones were taken from Rey et al. (2001). It can be seen that the HB morphologies for six of eight of our sample globular clusters follow the same behavior as a function of metallicity as the ’young halo’ Galactic globular clusters. Mackey & Gilmore (2004) performed a comparison between ’old halo’, ’young halo’, and ’bulge/disc’ Galactic globular cluster sub-populations (Zinn, 1993) using the HB-type versus metallicity diagram. The authors showed that the majority of external GCs are indistinguishable from Galactic young halo GCs. Our analysis shows that six of our sample globular clusters follow a similar trend, typical for ’young halo’ Galactic GCs. We conclude that, as the ’young halo’ Galactic GCs, the HB morphologies for the majority of our sample globular clusters might be, at least partly, influenced by age, in the sense that our sample GCs have redder HBs at a given metallicity.
Globular clusters in nearby dwarf galaxies Sagittarius dSph, Fornax dSph, Magellanic Clouds show similar second-parameter globular clusters which resemble the ’young halo’ Galactic globular clusters in the HB-type versus [Fe/H] diagram (see e.g. Mackey & Gilmore 2004a,b; Buonanno et al. 1998, 1999; Strader et al. 2003). Rich et al. (2005) studied HB morphologies of 10 GCs in M31 using HST/WFPC2 photometry and found metal-poor globular clusters with HB morphologies resembling those of the Fornax dSph galaxy globular clusters. It is of interest to continue the CMD studies using high resolution HST imaging for GCs in dwarf galaxies and the outskirts of nearby massive galaxies (e.g. M31) to establish the role of dwarf galaxies and their globular cluster systems as building blocks of massive galaxies in the Local group and other nearby groups within 10 Mpc. If most younger halo GCs in massive galaxies were accreted from low-mass satellites, globular clusters in dwarf galaxies should resemble these younger halo GCs in terms of HB type at a given metallicity. However, we do not know whether these results could be appropriate for probing the formation of more distant galaxies situated in denser environments like Virgo or Fornax clusters.
4.2 Comparison with Globular Clusters in M31
Perrett et al. 2002, Beasley et al. 2004, Beasley et al. 2005, Fusi Pecci et al. 2005, and Puzia et al. (2005a) studied GCs in the halo of M31 spectroscopically and found that the M31 globular clusters have essentially distinct properties from those of the MW globular clusters. The main conclusions from these studies could be summarised as follows: 1. three types of GC populations exist in the halo of M31: old GCs (10 Gyr) with a wide range of metallicities, intermediate-age GCs with metallicity , and young GCs ( Gyr) with slightly higher metallicities; 2. the M31 GCs have lower [/Fe] ratios than the MW GCs (a mean dex, Puzia et al., 2005a); 3. the detailed abundances of some elements (e.g. C, N) show a different behaviour with age and metallicity than that of Galactic GCs.
We select halo globular clusters located at projected galactocentric distances larger than that of NGC 205 ( kpc) from the samples of Worthey et al. (1994), Kuntschner et al. (2002), Beasley et al. (2004) and Puzia et al. (2005a). Fig. 9 shows [/Fe] and age-metallicity diagnostic plots for these globular clusters. We expect such clusters to be the most likely candidates for accreted objects resembling ages and chemical compositions similar to globular clusters in NGC 147, NGC 185, and NGC 205. Indeed, ten of sixteen globular clusters selected from the sample of Puzia et al. (2005a) are old and metal poor and are located at similar places in the age-metallicity diagnostic plots as our sample GCs in dwarf galaxies. Only three of them have according to the data of Puzia et al. (2005a): B304: (, age Gyr, ), B310: (, age Gyr, ), B358: (, age Gyr, ). Some of the selected M31 globular cluster show high metallicities and old ages (see right panel of Fig. 9). There are no GCs with such properties in our sample.
One noteworthy case is the M31 globular cluster B337, which is located at a projected distance kpc from the center of M31 near the northern stellar spur kinematically associated with NGC 205 (McConnachie et al. 2004). The cluster has an intermediate age of Gyr and dex, and a solar [/Fe] ratio (Puzia et al., 2005a) similar to that found for Hubble VI in NGC 205 and FJJVII in NGC 185. There are also indication for intermediate-age field stellar populations in the halo of M31 (e.g. Brown et al. 2003, 2006).
Guhathakurta et al. (2006) discovered an extended halo of metal-poor RGB stars out to a projected distance of 165 kpc from M31’s center. Hence, NGC 147, NGC 185, and NGC 205 with their globular cluster systems are embedded in this halo and some clusters may have properties similar to the M31 halo GCs. Pritzl et al. (2005) demonstrated that most Galactic globular cluster stars show similar [/Fe] ratios as field stars of similar metallicities, and neither clearly resembles the stellar abundances in dwarf galaxies. The situation can be more complex for M31, where the processes of merging and tidal disruption are still active. Additional spectroscopic and CMD studies of GCs in M31 and dwarf satellites are needed to establish the fraction of M31 halo GCs which are twins of the globular clusters in NGC 147, NGC 185, and NGC 205.
4.3 The Diffuse Stellar Populations
Many authors pointed out the large abundance spread across the red giant branches of our sample galaxies. Mould et al. (1984) found a mean metallicity for NGC 205 [M/H] and a metallicity dispersion [M/H] dex. Additionally, these authors obtained a large age spread of RGB stars in the range 2–8 Gyr. Mould et al. (1983) estimated a mean metallicity of RGB stars in the outer parts of NGC 147 [M/H] and a metallicity spread of 0.3 dex. Lee et al. (1993) obtained a metallicity dispersion in NGC 185 in the range dex from the dispersion of the mean color of RGB stars measured at . Grebel (2000) derived the following values of metallicity and the metallicity spread for NGC 205, NGC 185, and NGC 147 correspondingly: , and . Mean metallicities estimated by McConnachie et al. (2005) for RGB stars in our sample galaxies are consistent with the data from the aforementioned studies: [M/H] for NGC 205, [M/H] for NGC185, and [M/H] for NGC 147.
High resolution HST images made it possible to study RGB stars closer to the centers of our sample galaxies. Butler and Martinez-Delgado (2005) identified ancient stars in NGC 185 with dex with the mean metallicity dex and the last period of active star formation dating about 4x yr ago. The most metal-rich RGB stars in NGC 205 were found to reach dex, while a median value of metallicity for ancient stars in this galaxy is . Dolphin (2005) using the same observational material and the DOLPHOT program obtained mean metallicities and dex for NGC 205, NGC 185, and NGC 147, respectively.
Our spectroscopic study deals with the integrated light from stars in NGC 205 and NGC 185 very near to the centres of the host galaxies. Hence, it is worth to note that our study supplements the results obtained by the extensive CMD studies. We found dex for the central regions of NGC 205 and a large spread of metallicity dex which could not be explained by measurement uncertainties, because the spread is considerably less for globular clusters having the same S/N ratio in their spectra. We estimate the metallicity of the region of diffuse galactic light in NGC185 near the globular cluster FJJIII ( kpc) to be in a good consent with the CMD studies. As it was also mentioned by Da Costa & Mould (1988) the mean abundance of the associated globular clusters in each of the studied galaxies is considerably less than that observed for the corresponding field halo stars. So, one could suggest that globular cluster systems of these galaxies formed at the earliest epochs of galactic formation along with the first stars.
We found indications for increasing age with increasing galactocentric distance for the field stellar population in NGC 205. The same trend was found in deep CMD studies for stellar populations in NGC 205 and NGC 185. According to Cappellari et al. (1999) there is a central population of stars in NGC 205 with ages in the range 50 – 100 Myr. AGB stars have solar metallicity and are distributed uniformly over the inner (Davidge 1992). Old stars in NGC 185 form the less concentrated system (Martinez-Delgado et al. 1999). The youngest stars are located in the central 150x90 parsec2 region (Butler & Martinez-Delgado, 2005). Outside this area only stars with ages Gyr are found.
5 Conclusion
Although the modest S/N of some of our GC spectra and the relatively moderate photometric depth of our CMDs do not allow us to derive very accurate ages, we conclude that all our sample GCs appear to be old ( Gyr) and metal-poor (), except for the GCs Hubble V in NGC 205 ( Gyr, ), Hubble VI in NGC 205 ( Gyr, ), and FJJVII in NGC 185 ( Gyr, ). We find two intermediate-age GCs (HubbleVI and FJJVII) which are located at projected distances and 1.0 kpc from the centers of their host galaxies. Deep images taken with HST/ACS are necessary to understand whether these relatively faint star clusters are genuine globular clusters (i.e. simple stellar populations) born during Gyr old star-formation events in their host galaxies. They could consist also of multiple stellar populations similar to Cen (see e.g. Sollima et al. 2005).
The HB morphologies for our sample GCs follow the same behavior with metallicity as younger halo Galactic globular clusters. It was found for Galactic GC, that age may not be the dominant second parameter determining the shape of globular clusters’ HBs (see e.g. Stetson et al., 1996). GCs having blue HBs are in general older than 10 Gyr (Lee et al. 1994). So, we suggest here that the HB morphologies for our sample GCs likely do not bias our spectroscopic age estimates based on Balmer absorption line indices.
We find that most of the GCs in the studied galaxies are weakly or not -enhanced, in contrast to the population of GCs in nearby early-type galaxies (see Puzia et al. 2006). The chemical composition of globular clusters may turn out to be a powerful tool to discriminate between clusters which formed in situ in massive galaxies and those that were formed in smaller sub-units and later accreted in more massive halos.
Spectroscopic ages and metallicities of the central regions in NGC 205 and NGC 185 coincide with those obtained from color-magnitude diagrams. The central field stellar populations in these galaxies have approximately the same age as their most central GCs Hubble V in NGC 205 and FJJIII in NGC 185, respectively, but are more metal-rich than the central globular clusters.
Acknowledgments
MES acknowledges all participants of the project SCORPIO at scientific advisory of V.L. Afanasiev for their extensive work on designing, producing and testing the SCORPIO spectrograph with the multislit unit at the 6m telescope. THP is supported by an ESA Research Fellowship, which is gratefully acknowledged. THP also acknowledges partial financial support through grant GO-10129 from the Space Telescope Science Institute, which is operated by AURA, Inc., under NASA Contract NAS5-26555. MES thanks Don VandenBerg for his help in applying his models to the analysis of the CMDs for GCs in NGC 205, N.A. Tiknonov, D.I. Makarov, O.K. Sil’chenko, O.A. Galazutdinova, G.M. Beskin. We thank the anonymous referee for valuable comments. VLA acknowledges the INTAS grant (96-0315), the ”Astronomy” Federal Science and Technology Program (contract no. 40.022.1.1.1101 from February 1, 2002) and the Program of the Department of Physical Sciences of the Russian Academy of Sciences for partial support of his work. The 6-m telescope of the Special Astrophysical Observatory of the Russian Academy of Sciences is operated under the financial support of the Science Department of Russia (registration number 01-43). Some of the data presented in this paper were obtained from the Multimission Archive at the Space Telescope Science Institute (MAST). STScI is operated by the Association of Universities for Research in Astronomy, Inc., under NASA contract NAS5-26555. Support for MAST for non-HST data is provided by the NASA Office of Space Science via grant NAG5-7584 and by other grants and contracts. This research has made use of NASA’s Astrophysics Data System Bibliographic Services.
References
- [\citeauthoryearAfanasiev & Moiseev2005] Afanasiev V.L, Moiseev A.V., 2005, AstL, 31, 216
- [\citeauthoryearBaade1944] Baade W., 1944, ApJ, 100, 147 Borngen F., 1987, A&AS, 67,447
- [\citeauthoryearBarmby & Huchra2001] Barmby P. & Huchra J.P., 2001, AJ, 122, 2468
- [\citeauthoryearBeasley et al.2005] Beasley M.A., Brodie J.P., Strader J., Forbes D.A., Proctor R.N., Barmby P. & Huchra J.P., 2005, AJ, 129, 1412
- [\citeauthoryearBeasley et al.2004] Beasley M.A., Brodie J.P., Strader J., Forbes D.A., Proctor R.N., Barmby P. & Huchra J.P., 2004, AJ, 128, 1623
- [\citeauthoryearBender et al.1991] Bender R., Paquet A., Nieto J.-L., 1991, A&A, 246, 349
- [\citeauthoryearBrown et al.2003] Brown, T. M., Ferguson, H. C., Smith, E., Kimble, R. A., Sweigart, A. V., Renzini, A., Rich, R. M., & VandenBerg, D. A. 2003, ApJL, 592, L17
- [\citeauthoryearBrown et al.2006] Brown, T. M., Smith, E., Guhathakurta, P., Rich, R. M., Ferguson, H. C., Renzini, A., Sweigart, A. V., & Kimble, R. A. 2006, ApJL, 636, L89
- [\citeauthoryearBuonanno et al.1998] Buonanno R., Corsi C.E., Zinn R., Fusi Pecci F., Hardy E., Suntzeff N.B., 1998, ApJ, 501, L33
- [\citeauthoryearBuonanno et al.1999] Buonanno R., Corsi C.E., Castellani M., Marconi G., Fusi Pecci F., Zinn R., 1999, AJ, 118, 1671
- [\citeauthoryearButler & Martinez-Delgado2005] Butler D.J. & Martinez-Delgado D., 2005, AJ, 129, 2217
- [\citeauthoryearBurstein et al.1984] Burstein D., Faber S.M., Gaskell C.M., & Krumm N. 1984, ApJ, 287, 586
- [\citeauthoryearBrusual & Charlot2003] Brusual G., Charlot S., 2003, MNRAS, 344, 1000
- [\citeauthoryearCarter & Sadler1990] Carter D., Sadler E.M., 1990, MNRAS, 245, 12
- [\citeauthoryearCappellari et al.1999] Cappellari M., Bertola F., Burstein D., Buson L.M., Greggio L., Renzini A., 1999, ApJ, 515, L17
- [\citeauthoryearChilingarian et al.2005] Chilingarian I., Prugniel P., Sil’chenko O., Afanasiev V. in Near-field Cosmology with Dwarf Elliptical Galaxies (IAU Colloqium No. 198), H.Jerjen and B.Binggeli, eds., Cambridge Univ. Press, p.105
- [\citeauthoryearCovino et al.1995] Covino S., Galletti S., and Pasinetti L.E., 1995, A&A, 303, 79
- [\citeauthoryearChoi et al.2002] Choi P.I., Guhathakurta P., and Johnston K., 2002, AJ, 124, 310
- [\citeauthoryearDa Costa & Mould1988] Da Costa G.S. and Mould J.R., 1988, ApJ, 334, 159
- [\citeauthoryearDavidge2005] Davidge T.J., 2005, AJ, 130, 2087
- [\citeauthoryearDavidge1994] Davidge T.J., 1994, AJ, 108, 2123
- [\citeauthoryearDavidge1992] Davidge T.J., 1992, ApJ, 397, 457
- [\citeauthoryearDolphin2003] Dolphin A.E., Saha A., Skillman E.D., Dohm-Palmer R.C., Tolstoy E., Cole A.A., Gallagher J.S., Hoessel J.G., 2003, AJ, 126, 187
- [\citeauthoryearDolphin2000] Dolphin A.E. 2000, PASP, 112, 1383
- [\citeauthoryearDolphin2000] Dolphin A.E. 2000, PASP, 112, 1397
- [\citeauthoryearDolphin2005] Dolphin A.E., 2005, in Resolved Stellar Populations, D.Valls-Gabaud & M. Chavez eds., ASP Conference Ser. Vol TBA, p. 74
- [\citeauthoryearFJJ1977] Ford H.C., Jacoby G.& Jenner D.C., 1977, ApJ, 213, 18
- [\citeauthoryearFusi Pecci et al.2005] Fusi Pecci F., Bellazzini M., Buzzoni A., De Simone E., Federici L., 2005, AJ, 130, 554
- [\citeauthoryearGallagher & Grebel2001] Gallagher J.S. & Grebel E.K., 2001 in Extragalactic Star Clusters (IAU Symposium No. 207), D. Geisler, E. Grebel and D. Minniti, eds., San Francisco: ASP, p.745
- [\citeauthoryearGalleti2006] Galleti S., Federici L., Bellazzini M., Buzzoni A., Fusi Pecci F., ArXiv Astrophysics e-prints, arXiv:astro-ph/0605718
- [\citeauthoryearGalleti2004] Galleti S., Federici L., Bellazzini M., Fusi Pecci F., Macrina S 2004, A&A 416, 917
- [\citeauthoryearGeisler2005] Geisler D. Smith V.V., Wallerstein G., Gonzalez G., Charbonnel C., 2005, AJ, 129, 1428
- [\citeauthoryearGeisler1999] Geisler D. 1999, in Stellar Content of the Local Group (IAU Symposium No. 192), P. Whitelock and R.D. Cannon, eds., San Francisco: ASP, 231
- [\citeauthoryearGrebel2000] Grebel E.K., 2000 in Star Formation from the Small to the Large Scale, 33rd ESLAB Symp., SP-445, eds. F. Favata, A.A.Kaas, & A.Wilson, Noordwijk: ESA, 87
- [\citeauthoryearGuhathakurta et al.2006] Guhathakurta P., Ostheimer J.O., Gilbert K.M., et al., 2006, astro-ph/0605172
- [\citeauthoryearHarbeck et al.2001] Harbeck D., Grebel E.K., Holtzman J., Guhathakurta P., Brandner W., Geisler D., Sarajedini A., Dolphin A, Hurley-Keller D., Mateo M., 2001, AJ, 122, 3092
- [\citeauthoryearHarris1996] Harris W.E., 1996, AJ, 112, 1487, for the 2003 update see http://physun.physics.mcmaster.ca/~harris/mwgc.dat
- [\citeauthoryearHodge1973] Hodge P.W., ApJ 182, 671
- [\citeauthoryearHodge1974] Hodge P.W., 1974, PASP, 86,289
- [\citeauthoryearHodge1976] Hodge P.W., 1976, AJ, 81, 25
- [\citeauthoryearHubble1932] Hubble E., 1932, ApJ, 76, 44
- [\citeauthoryearHuxor et al.2005] Huxor A.P., Tanvir N.R., Irwin M.J., Ibata R., Collett J.L, Ferguson A.M.N., Bridges T., Lewis G.F., 2005, MNRAS, 360, 1007
- [\citeauthoryearHwang et al.2005] Hwang N., Lee M.G., Lee J.C., Park W.-K, Park H.S., Park J.-H., Sohn S.T. et al. in Near-field Cosmology with Dwarf Elliptical Galaxies (IAU Colloqium No. 198), H.Jerjen and B.Binggeli, eds., Cambridge Univ. Press, p.257
- [\citeauthoryearJones et al.1996] Jones D.H., Mould J.R., Watson A.M. et al., 1996, ApJ, 466, 742
- [\citeauthoryearLee et al.1993] Lee M.G., Freedman W.L. & Madore B.F., 1993, AJ, 106, 964
- [\citeauthoryearLee1994] Lee Y.-W., Demarque P., Zinn R., 1994, AJ, 423, 248
- [\citeauthoryearLee1996] Lee M.G., 1996, AJ, 112, 1483
- [\citeauthoryearMackey & Gilmore] Mackey A.D. & Gilmore G.F., 2004, MNRAS, 352, 153
- [\citeauthoryearMackey & Gilmore] Mackey A.D. & Gilmore G.F., 2004, MNRAS, 355, 504
- [\citeauthoryearMartinez-Delgado et al.1999] Martinez-Delgado D., Aparicio A., Gallart C., 1999, AJ, 118, 2229
- [\citeauthoryearMateo1998] Mateo M., 1998, ARA&A, 36, 435
- [\citeauthoryearMcConnachie et al.2004] McConnachie A.W., Irwin M.J., Lewis G.F., Ibata R.A., Chapman S.C. Ferguson A.M.N., Tanvir N., 2004, MNRAS, 351, L94
- [\citeauthoryearMcConnachie et al.2005] McConnachie A.W., Irwin M.J., Ferguson A.M.N., Ibata R.A., Lewis G.F., Tanvir N., 2005, MNRAS, 356, 979
- [\citeauthoryearMould et al.1983] Mould J., Kristian J., Da Costa G.S., 1983, ApJ, 270, 471
- [\citeauthoryearMould et al.1984] Mould J., Kristian J., Da Costa G.S., 1984, ApJ, 278, 575
- [\citeauthoryearPipino et al.2006] Pipino A., Matteucci F., Chiappini C., 2006, AJ, 638, 739
- [\citeauthoryearProctor et al.2004] Proctor R.N., Forbes D.A., Beasley M.A., 2004, MNRAS, 355, 1327
- [\citeauthoryearPritzl et al.2005] Pritzl B.J., Venn K.A., Irwin M., 2005, AJ, 130, 2140
- [\citeauthoryearPrugniel P., Soubiran C.2001] 2001, A&A, 369, 1048
- [\citeauthoryearPuzia et al.2006] Puzia, T. H., Kissler-Patig, M., & Goudfrooij, P. 2006, ApJ in press, ArXiv Astrophysics e-prints, arXiv:astro-ph/0605210
- [\citeauthoryearPuzia et al.2005a] Puzia T.H., Perrett K.M., Bridges T.J., 2005a, A&A, 434, 909
- [\citeauthoryearPuzia et al.2005b] Puzia T.H., Kissler-Patig M., Thomas D., Maraston C., Saglia R.P., Bender R., Richtler T., Goudfrooij P., Hempel M., 2005b, A&A, 439, 997
- [\citeauthoryearPuzia et al.2004] Puzia T.H., Kissler-Patig M., Thomas D., Maraston C., Saglia R.P., Bender R., Richtler T., Goudfrooij P., Hempel M., 2004, A&A, 415, 123
- [\citeauthoryearPuzia et al.2002] Puzia T.H., Saglia R. P., Kissler-Patig M. et al., 2002, A&A, 395, 45
- [\citeauthoryearRey et al.2001] Rey S.-C., Yoon S.-J., Lee Y.-W., Chaboyer B., Sarajedini A., 2001, AJ, 122, 3219
- [\citeauthoryearRich et al.2005] Rich .M., Corsi C.E., Cacciari C., Federici L., Fusi Pecci F., Djorgovski S.G., Freedman W.L., 2005, AJ, 129,2670
- [\citeauthoryearSalaris & Weiss2002] Salaris M., Weiss A., 2002, A&A, 388, 492
- [\citeauthoryearSharina et al.2006] Sharina M.E., Afanasiev V.L., Puzia T.H., 2006, AstL, 32, 185, astro-ph/0605416
- [\citeauthoryearSharov & Lyuty1983] Sharov A.C. & Lyuty V.M., 1983, Ap&SS, 90, 371
- [\citeauthoryearSchlegel et al.1998] Schlegel D.J., Finkbeiner D.P., Davis M., 1998, ApJ, 500, 525
- [\citeauthoryearSollima et al.2005] Sollima, A., Pancino, E., Ferraro, F. R., Bellazzini, M., Straniero, O., & Pasquini, L. 2005, ApJ, 634, 332
- [\citeauthoryearStetson et al.1996] Stetson P.B. Vandenberg D.A., Bolte M., 1996, PASP, 108, 560
- [\citeauthoryearStrader et al.2003] Strader J., Brodie J.P.,Forbes D.A., Beasley M.A., Huchra J.P., 2003, AJ, 125, 1291
- [\citeauthoryearThomas et al.2003] Thomas D., Maraston C., Bender R., MNRAS, 339, 897
- [\citeauthoryearTrager et al.1998] Trager, S.C., Worthey G., Faber S.M., Burstein D., Gonzalez J. J., 1998, ApJS, 116, 1
- [\citeauthoryearTonry & Davis1979] Tonry J., Davis M., 1979, AJ, 84, 1511
- [\citeauthoryearVandenBerg et al.2006] VandenBerg, D. A., Bergbusch, P. A., & Dowler, P. D. 2006, ApJS, 162, 375
- [\citeauthoryearVazdekis1999] Vazdekis A., 1999, ApJ, 513, 224
- [\citeauthoryearvan den Bergh1969] van den Bergh S., 1969, ApJS, 19, 145
- [\citeauthoryearvan den Bergh2000] van den Bergh S., 2000, The Galaxies of the Local Group (Cambridge: Cambridge Univ. Press)
- [\citeauthoryearWorthey1994] Worthey G., 1994, ApJS, 95, 107
- [\citeauthoryearWorthey et al.1994] Worthey G., Faber S.M., Gonzalez J.J., & Burstein D. 1994, ApJS, 94, 687
- [\citeauthoryearWorthey & Ottaviani1997] Worthey G., Ottaviani D.L., 1997, ApJS, 111, 377
- [\citeauthoryearWorthey et al.1994] Worthey G., Faber S.M., Gonzalez J.J., Burstein D., 1994, ApJS 94, 687
- [\citeauthoryearYoung & Lo1997] Young L.M. & Lo K.Y. 1997, AJ, 476, 127
- [\citeauthoryearZinn1993] Zinn R., 1993, in The Globular Cluster-Galaxy Connection, ed. G.H. Smith & J.P. Brodie (San Francisco:ASP),38