Formation of quasars from hierarchical galaxy mergers
Abstract
The discovery of luminous quasars at redshift indicates the presence of supermassive black holes (SMBHs) of mass when the Universe was less than one billion years old. This finding presents several challenges for theoretical models, because whether such massive objects can form so early in the -cold dark matter (CDM) cosmology, the leading theory for cosmic structure formation, is an open question. Furthermore, whether the formation process requires exotic physics such as super-Eddington accretion remains undecided. Here, we present the first multi-scale simulations that, together with a self-regulated model for the SMBH growth, produce a luminous quasar at in the CDM paradigm. We follow the hierarchical assembly history of the most massive halo in a volume, and find that this halo of forming at after several major mergers is able to reproduce a number of observed properties of SDSS J1148+5251, the most distant quasar detected at (Fan et al., 2003). Moreover, the SMBHs grow through gas accretion below the Eddington limit in a self-regulated manner owing to feedback. We find that the progenitors experience vigorous star formation (up to ) preceding the major quasar phase such that the stellar mass of the quasar host reaches at , consistent with observations of significant metal enrichment in SDSS J1148+5251. The merger remnant thus obeys similar scaling relation observed locally as a consequence of coeval growth and evolution of the SMBH and its host galaxy. Our results provide a viable formation mechanism for quasars in the standard CDM cosmology, and demonstrate a common, merger-driven origin for the rarest quasars and the fundamental correlation in a hierarchical Universe.
Subject headings:
black hole physics — cosmology: theory, early Universe — galaxies: active, formation, evolution, starburst, high-redshift, ISM — methods: numerical — quasars: general, individual (SDSS J1148+5251)1. INTRODUCTION
Quasars rank among the most luminous objects in the Universe and are believed to be powered by SMBHs (e.g., Salpeter 1964; Lynden-Bell 1969). They constrain the formation and evolution of galaxies and SMBHs throughout cosmic time. The similarity between the cosmic star formation history (e.g., Madau et al. 1996; Bunker et al. 2004; Bouwens et al. 2004) and the evolution of quasar abundances (e.g., Shaver et al. 1996) suggests an intriguing link between galaxy formation and black hole growth. This is strengthened by tight correlations measured locally between the masses of the black holes and the global properties of the spheroid components of their hosts, such as their luminosities and masses (Magorrian et al. 1998; Marconi & Hunt 2003), light concentration (Graham et al. 2001), and velocity dispersions (Ferrarese & Merritt 2000; Gebhardt et al. 2000; Tremaine et al. 2002).
Distant, highly luminous quasars are important cosmological probes for studying the first generation of galaxies, the star formation history and metal enrichment in the early Universe, the growth of the first supermassive black holes (SMBHs), the role of feedback from quasars and black holes in galaxy evolution, and the epoch of reionization. The Sloan Digital Sky Survey (SDSS, York et al. 2000) has contributed significantly to the discovery of high redshift quasars. Currently, there are over 1000 quasars known at and 12 at (Fan et al. 2001, 2003, 2004, 2006). As reviewed by Fan (2006), quasars at are characterized by: (1) a low space density ( comoving); (2) high luminosities (absolute luminosity at rest-frame ), believed to be powered by SMBHs of ; (3) Gunn-Peterson absorption troughs (Gunn & Peterson, 1965) in their spectra, which place these quasars at the end of the epoch of reionization (e.g., Fan et al. 2001; Becker et al. 2001; Djorgovski et al. 2001; Lidz et al. 2002; Songaila & Cowie 2002; White et al. 2003; Sokasian et al. 2003); and (4) a lack of evolution in the spectral energy distribution compared to lower-shift counterparts (e.g., Elvis et al. 1994; Glikman et al. 2006; Richards et al. 2006), which demonstrates the existence of “mature” quasars at early times and comparable metal enrichment in quasars at all cosmic epochs.
The most distant quasar known, SDSS J1148+5251 (hereafter J1148+5251), was discovered by SDSS at z = 6.42 (Fan et al., 2003). It is extremely bright optically with = -27.8, and deep imaging surveys in both optical and radio (Carilli et al. 2004; White et al. 2005; Willott et al. 2005) show no sign of gravitational lensing or other companions at the same redshift in the vicinity. Over the past few years, this quasar has been extensively studied at many wavelengths. Near-infrared observations by Willott et al. (2003) and Barth et al. (2003) imply a bolometric luminosity of powered by accretion onto a SMBH of mass 1–5 . Radio observations by Bertoldi et al. (2003a) and Carilli et al. (2004) suggest that the host is a hyper-luminous far-infrared (FIR) galaxy, with , and these authors estimate a star formation rate of by assuming most of the FIR luminosity comes from young stars. Emission from carbon monoxide (CO) has been detected (Walter et al. 2003; Bertoldi et al. 2003b; Walter et al. 2004) corresponding to a mass of . Dust has been seen by several groups (e.g., Robson et al. 2004; Bertoldi et al. 2003a; Carilli et al. 2004; Beelen et al. 2006) with an estimated mass of . In particular, Spitzer observations by Charmandaris et al. (2004) and Hines et al. (2006) indicate that the dust is heated by an active galactic nucleus (AGN). Furthermore, the detection of iron by Barth et al. (2003), the carbon fine structure line [CII] by Maiolino et al. (2005) and excess OI absorption by Becker et al. (2006) indicate near-solar metallicity in the quasar host.
These observations raise many fundamental questions for models of quasar and galaxy formation: Where do such high-redshift, luminous quasars originate? How do they form? What are the mechanisms and physical conditions for SMBH growth? And, do these quasar hosts obey the same SMBH–host correlations as observed in the local Universe?
Interpretations of various observations of J1148+5251 have painted a rather conflicting picture for the formation site of the quasar halo and the SMBH–host relationship. The low abundance of these quasars leads to the view that they are hosted by massive halos () in the rarest density peaks of the dark matter distribution (Fan et al., 2003). However, it has been argued, based on the lack of companion galaxies in the field, that this quasar may reside in a much lower mass halo in a less overdense region (Carilli et al. 2004; Willott et al. 2005). Moreover, Walter et al. (2004) suggest, based on the dynamical mass estimate from CO measurements, that J1148+5251 contains a small stellar spheroid, and that the SMBH may have largely formed before the host galaxy. However, the detection of metal lines (Walter et al. 2004; Barth et al. 2003; Maiolino et al. 2005), along with dust (Bertoldi et al. 2003a; Carilli et al. 2004; Robson et al. 2004; Charmandaris et al. 2004; Hines et al. 2006; Beelen et al. 2006), indicates that the interstellar medium (ISM) of J1148+5251 was significantly enriched by heavy elements produced through massive star formation at rates of occurring as early as , and that large stellar bulges form before accreting SMBHs undergo luminous quasar activity.
In an expanding Universe that is dominated by cold dark matter and is accelerated by dark energy, the -cold dark matter (CDM) cosmology, the leading theoretical model for structure formation, assumes that structure grows from weak density fluctuations amplified by gravity, with small objects collapsing first and subsequently merging to form progressively more massive ones, a process known as “hierarchical assembly” (e.g., see Barkana & Loeb 2001 for a review). The formation of galaxies and quasars is therefore determined by the abundance of dark matter halos; i.e., the number density of halos as a function of mass and redshift. The most widely used analytic model for the halo mass function was first developed by Press & Schechter (1974) (hereafter PS), which is based on Gaussian density perturbations, linear gravitational growth, and spherical collapse of dark matter. Using the PS mass functions, Efstathiou & Rees (1988) studied the abundance of rare objects, such as luminous quasars at high redshifts. These authors predicted a sharp “cut-off” of the quasar population at . However, while the initial, linear growth of density perturbations can be calculated analytically, the gravitational collapse and subsequent hierarchical build-up of structure is a highly nonlinear process that can be followed only through numerical simulations. It has been shown by previous numerical studies (e.g., Jenkins et al. 2001; Sheth & Tormen 2002; Springel & Hernquist 2003b), and more recently by the state-of-the-art Millennium Simulation by Springel et al. (2005c), that the PS formula underestimates the abundance of high-mass halos by up to an order of magnitude. Therefore, whether or not rare quasars such as J1148+5251 can form in the CDM cosmology remains an open question and an important test of the theory.
To date, only a limited number of analytical or semi-analytic models have addressed the early formation of a SMBH at (Haiman & Loeb 2001; Haiman 2004; Yoo & Miralda-Escudé 2004; Volonteri & Rees 2005). These approaches use merger trees of dark matter halos generated using the PS theory, and assume a black hole accretion rate at or above the Eddington limit. However, as discussed above, the PS–based approach may be inaccurate. Moreover, it is not clear whether sufficient physical conditions for such large accretion rates exist in quasar systems as the hydrodynamics of the large-scale gas flow and feedback from black holes have not been incorporated in earlier modeling.
It is believed that the growth of SMBHs is closely linked to galaxy formation (e.g., Magorrian et al. 1998; Ferrarese & Merritt 2000; Gebhardt et al. 2000; Graham et al. 2001; Tremaine et al. 2002; Marconi & Hunt 2003; Haiman 2004; Kazantzidis et al. 2005; Li et al. 2006a), and that the growth is self-regulated by feedback (e.g., Silk & Rees 1998; Haehnelt et al. 1998; Fabian 1999; King 2003; Wyithe & Loeb 2003; Di Matteo et al. 2005; Springel et al. 2005b; Sazonov et al. 2005; Murray et al. 2005; Wyithe & Loeb 2005). Remarkably, self-regulated models with SMBH feedback in the form of thermal energy coupled to the ambient gas have been demonstrated to successfully reproduce many observations of galaxies, including the relation (Di Matteo et al. 2005; Robertson et al. 2006b), galaxy colors (Springel et al. 2005a; Hopkins et al. 2006c), X-ray gas emission (Cox et al., 2006b), elliptical kinematics (Cox et al., 2006c) and the fundamental plane (Robertson et al., 2006a), quasar properties (Hopkins et al. 2005d, a), luminosity functions (Hopkins et al. 2005b, c, 2006b), and populations (Hopkins et al. 2006a, e, d), and the luminosity function of low-level AGN (Hopkins & Hernquist, 2006). Furthermore, these simulations of binary mergers identify a plausible, merger-driven formation mechanism for massive black holes and luminous quasars (e.g., Di Matteo et al. 2005; Hopkins et al. 2006a; Robertson et al. 2006b).
Here, we present a model that accounts for the SMBH growth, quasar activity and host galaxy properties of the most distant quasar known. In our scenario, the quasar and its host galaxy form in a massive halo that originates from a rare density peak in the standard CDM paradigm, and they grow hierarchically through multiple gas-rich mergers, supporting an average star formation rate of that peaks at . Once the progenitors undergo sufficient dynamical friction to coalesce, the multiple SMBHs from the progenitor galaxies merge and exponentially increase their mass and feedback energy via accretion. At when the SMBH mass exceeds , black hole accretion drives a sufficiently energetic wind to clear obscuring material from the central regions of the system and powers an optically luminous quasar similar to J1148+5251. We have devised a set of novel multi-scale simulations, which include cosmological N-body calculations on large scales and hydrodynamic simulations of galaxy mergers on galactic scales, coupled with the self-regulated growth of SMBHs, enabling us to follow galaxy assembly and quasar formation at .
This paper is organized as follows. In § 2, we describe our computational methods and models, which includes a set of large scale cosmological N-body simulations, and hydrodynamical galaxy mergers along the merging history of the quasar halo. In § 3, we present the formation and evolution of the quasar and its host galaxy, including the assembly of the galaxy progenitors, star formation, and SMBH growth, as well as the SMBH–host correlations, and properties of the quasar such as luminosities and lifetimes. We discuss feedback from starburst-driven winds, quasar abundances for cosmological models with different parameters, the implication of black hole mergers, and galaxies in the epoch of reionization in § 4, and summarize in § 5.
2. Methodology
Rare, high-redshift quasars originate in highly overdense regions in the initial dark matter density distribution and grow through hierarchical mergers, as predicted by the CDM theory. Simulations of high-redshift quasar formation must model a large cosmological volume to accommodate the low abundance of this population, have a large dynamic range to follow the hierarchical build-up of the quasar hosts, and include the hydrodynamics of the gas flows in galaxy mergers. The cutting-edge Millennium Simulation by Springel et al. (2005c) follows structure formation in a box with side length of using dark matter particles. It reproduces the large-scale galaxy distribution as observed (Springel et al., 2006), and identifies an early quasar halo candidate at which ends up in the richest cluster at the present day. However, even such a large dynamic range still falls short of being able to follow the formation and evolution of the rarest quasars observed at the highest redshifts. Moreover, in order to address the properties of quasars and host galaxies, gasdynamics and physical processes related to star formation and black hole growth must be included. To satisfy these requirements, we have performed a set of novel multi-scale simulations that enable us to resolve individual mergers on galactic scales and retain the context of large-scale structure formation, as well as the evolution of black holes and stars.
First, we perform a coarse dark matter simulation in a volume of designed to accommodate the low number density of quasars. The largest halo at , within which the descendants of early, luminous quasars are assumed to reside (Springel et al., 2005c), is then selected for resimulation with higher resolution using a multi-grid zoom-in technique developed by Gao et al. (2005). The merging history of the largest halo at , which has reached a mass of through 7 major (mass ratio 5:1) mergers between redshifts 14.4 and 6.5, is extracted. These major mergers are again re-simulated hydrodynamically using galaxy models scaled appropriately for redshift (Robertson et al., 2006b) and adjusted to account for mass accretion through minor mergers. The simulations include prescriptions for star formation (Springel & Hernquist, 2003a), and for SMBH growth and feedback (Di Matteo et al. 2005; Springel et al. 2005b), as described below.
2.1. Code and Parameters
Our multi-scale simulations were performed using the parallel, N-body/Smoothed Particle Hydrodynamics (SPH) code GADGET2 developed by Springel (2005) that is well tested in a wide range of applications from large scale structure formation to star formation. For the computation of gravitational forces, the code uses the “TreePM” method (Xu, 1995) that combines a “tree” algorithm (Barnes & Hut, 1986) for short-range forces and a Fourier transform particle-mesh method (Hockney & Eastwood, 1981) for long-range forces. The PM-method works efficiently in large scale cosmological simulations, while the tree-method provides accurate forces for the large dynamic range of galaxy merger simulations.
GADGET2 implements the entropy-conserving formulation of SPH (Springel & Hernquist, 2002) with adaptive particle smoothing, as in Hernquist & Katz (1989). Radiative cooling and heating processes are calculated assuming collisional ionization equilibrium (Katz et al., 1996; Davé et al., 1999). Star formation is modeled in a multi-phase ISM, with a rate that follows the Schmidt-Kennicutt Law (Schmidt 1959; Kennicutt 1998). Feedback from supernovae is captured through a multi-phase model of the ISM by an effective equation of state for star-forming gas (Springel & Hernquist, 2003a). A prescription for supermassive black hole growth and feedback is also included, where black holes are represented by collisionless “sink” particles that interact gravitationally with other components and accrete gas from their surroundings. The accretion rate is estimated from the local gas density and sound speed using a spherical Bondi-Hoyle (Bondi & Hoyle, 1944; Bondi, 1952) model that is limited by the Eddington rate. Feedback from black hole accretion is modeled as thermal energy injected into surrounding gas, as described in Springel et al. (2005b) and Di Matteo et al. (2005).
The simulations presented in this paper adopt the CDM model with cosmological parameters chosen according to the first year Wilkinson Microwave Anisotropy Probe data (WMAP1, Spergel et al. 2003), (, , , , , )= (0.3, 0.04, 0.7, 0.7, 1, 0.9). Here, is the total matter density in units of the critical density for closure, . Similarly, and denote the densities of baryons and dark energy at the present day. The Hubble constant is parameterized as , while is the root-mean-squared linear mass fluctuation within a sphere of radius extrapolated to . We have also done the same cosmological simulations with WMAP third year results (WMAP3, Spergel et al. 2006), (, , , , , )= (0.236, 0.042, 0.759, 0.732, 0.95, 0.74) for comparison.
2.2. Cosmological Simulations
The quasars at have an extremely low comoving space density, , and are believed to reside in massive dark matter halos with (Fan et al., 2003). Cosmological simulations of quasar formation must therefore model a volume of to account for the rarity of such objects. However, in order to resolve a halo at in a cosmological simulation with uniform resolution, a dark matter particle mass at least as small as and particle numbers of are required. Tracking the merger history of such halos requires orders of magnitude higher resolution and would be computationally prohibitive with standard techniques.
We achieve the mass resolution requirements for the merger history of a halo at by means of a two-step re-simulation. First, coarse dark matter cosmological simulations are performed to identify a candidate halo for the quasar host. A cubic volume on a side is simulated with particles, achieving mass and force resolutions of and (comoving), respectively. To generate the initial conditions, we use the Boltzmann code CMBFAST by Seljak & Zaldarriaga (1996) to compute a linear theory power spectrum for our chosen cosmology. A random realization of the power spectrum is constructed in Fourier space, sampling modes in a sphere up to the Nyquist frequency of the mesh. The particle distribution is evolved forward in time to from its initial displacement at determined using the Zel’dovich approximation.
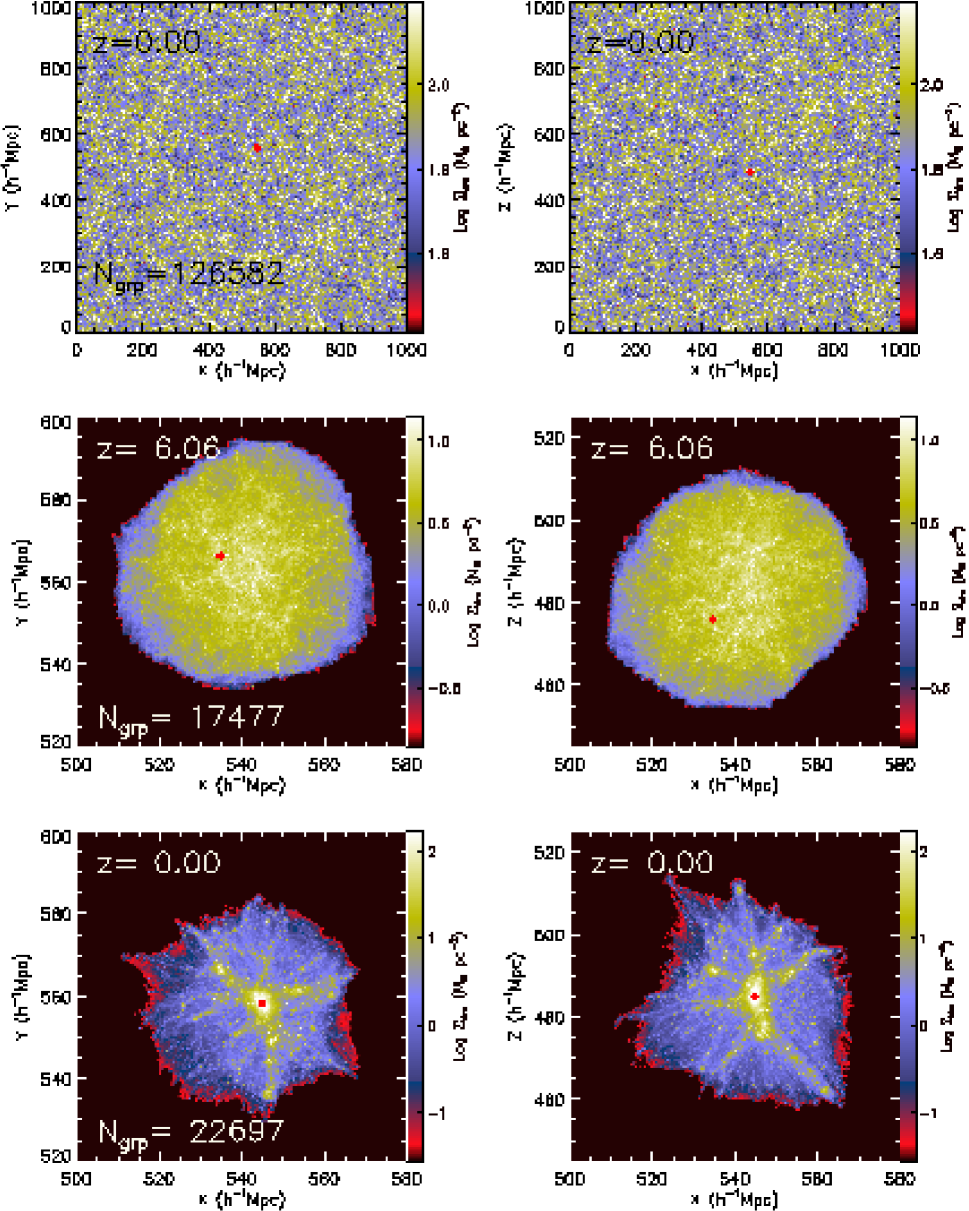
At the end of the simulation, halos are identified using a “friends-of-friends” (FOF) group-finding algorithm (Davis et al., 1985) with a fixed comoving linking length equal to 0.2 times the mean dark matter interparticle separation and a minimum of 32 particles per group (Springel & Hernquist, 2003b). The mean overdensity of the groups corresponds approximately to the expected density of virialized halos (Springel et al., 2005c). From the more than 126000 groups identified in the volume at the largest halo with is selected as a candidate halo for modeling the formation of a quasar at .
A multi-grid technique developed by Gao et al. (2005) and Power et al. (2003) is used to “ zoom in” with high resolution on the selected halo region which has an effective side length of . Large-scale tidal forces are captured by binning exterior particles into cells according to their distance from the high-resolution region. To ensure proper treatment of small-scale structure, the initial displacements of the high resolution particles are calculated assuming a higher initial redshift of and normalized to at . The re-simulation uses particles, with particles inside the high-resolution region. With this technique, the mass resolution increases by almost four orders of magnitude to while the spatial resolution reaches .
Figure 1 shows snapshots of both the coarse and high-resolution zoom-in runs that locate the quasar halo candidate. In the coarse run, the “cosmic web” is clearly seen, although the distribution appears nearly homogeneous on such large scales. In the zoom-in run, filamentary structures are prominent. Dark matter collapses along the filaments, and the largest halo forms in the deepest potential wells at the intersections of the filaments. The high resolution of the zoom-in run enables the identification of more halos with lower masses both at and at high redshifts as early as , which is sufficient to identify the halo progenitors of the candidate quasar at . It appears that the halo progenitor of the largest one at the present day is also the most massive halo at , when it reaches a mass of , making it a plausible candidate for hosting a rare quasar.
2.3. Halo Mass Functions with Different Cosmological Parameters
The impact that variations in the cosmological parameters can have on large-scale structure formation can be understood from the theoretical mass function of halos, as derived by Press & Schechter (1974) and later developed by Lacey & Cole (1993). The comoving number density of halos of mass between and can be described as,
| (1) |
where is the local mean mass density, is the critical density of collapse at redshift linearly extrapolated to the present day, and is the mass variance, which is a function of the power spectrum with wavenumber k and the window function , . The abundance of halos depends on the two functions and , each of which involves the cosmological parameters, in particular , and . These parameters determine the formation epoch of a halo and its mass.
The recently-released third year WMAP3 results (Spergel et al., 2006) have lower values of , and , compared to WMAP1 (Spergel et al., 2003). The smaller from WMAP3 would lower the amplitude of the power spectrum, which in turn reduces . Furthermore, a smaller would reduce and hence delay halo formation. So, compared to WMAP1, at a given redshift the WMAP3 parameters would yield a lower abundance of halos with mass , where is the halo mass corresponding to the characteristic luminosity in the Schechter luminosity function for galaxies (Schechter, 1976); while for , it predicts a slightly larger halo abundance.
To test the sensitivity of our model to the new WMAP results, we have performed the same set of cosmological simulations with parameters from the WMAP3 measurements (Spergel et al., 2006). We find that indeed the changes implied by the new parameters primarily affect the formation time and the mass of the candidate quasar halo. For the same random phases in the initial conditions, the location of the most massive halo at remains the same in both the WMAP1 and WMAP3 runs, except that its mass is reduced by a factor of for the WMAP3 parameters. Similarly, the mass of the largest halo at is altered by roughly the same factor. Other notable changes include: (1) the formation epoch of the first halo is shifted from in the WMAP1 run to in the WMAP3 run, and (2) the merging history of the largest halo at moves to lower redshifts in the WMAP3 run, but the number of major mergers remains the same.
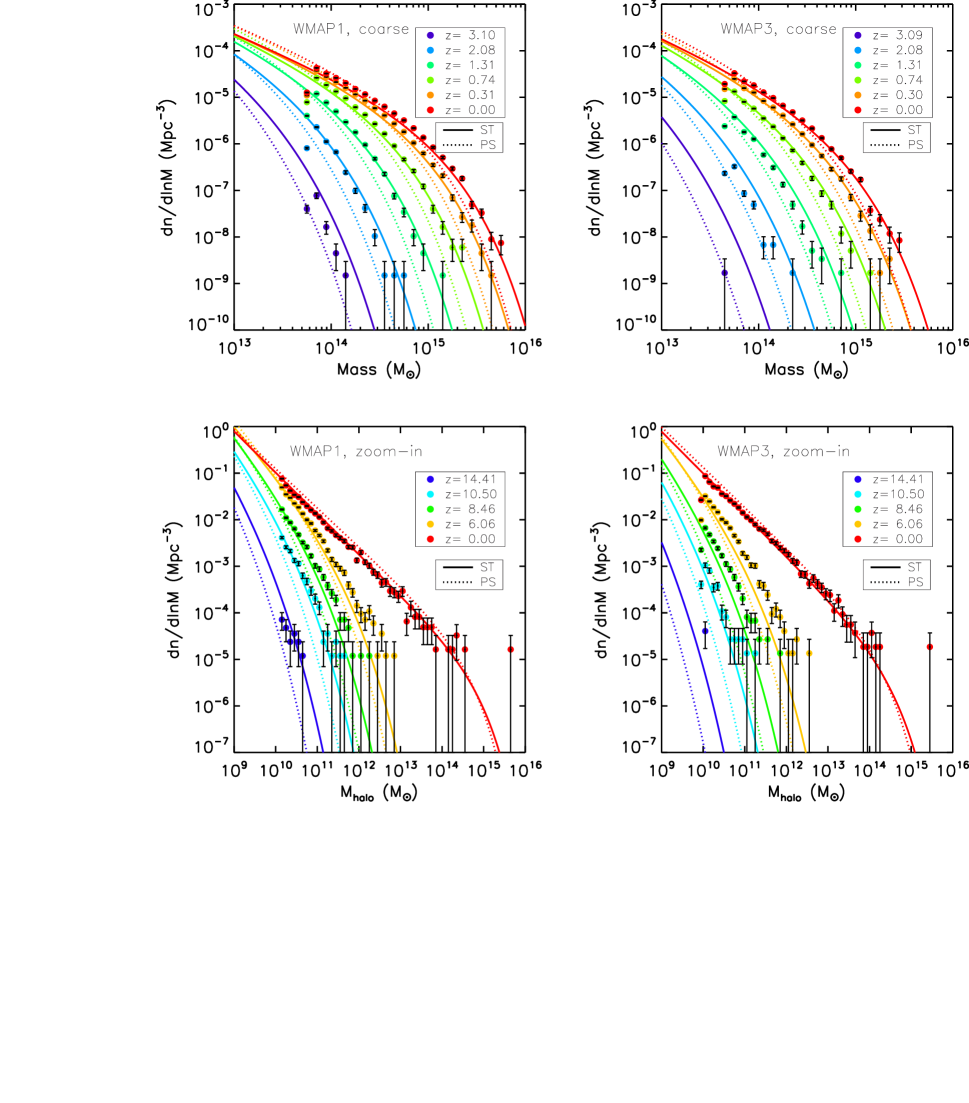
Figure 2 shows the halo mass functions from different cosmological simulations. The PS mass function (Press & Schechter, 1974), as well as the one corrected to match numerical simulations by Sheth & Tormen (2002) (ST), are also shown for comparison. One important feature in this figure is that the coarse runs agree well with the ST mass function, but show a larger comoving density at the high mass end than that predicted by the PS theory. Our results show that the PS formula underestimates the abundance of high-mass halos by nearly an order of magnitude at , and the discrepancy between the PS calculation and numerical simulations becomes larger at higher redshifts, confirming previous findings (e.g., Jenkins et al. 2001; Sheth & Tormen 2002; Springel & Hernquist 2003b; Springel et al. 2005c). This may explain why previous models using the PS formula to study the abundance of luminous quasars, which presumably form in massive halos, under-predicted the number of bright quasars at (e.g., Efstathiou & Rees 1988). Furthermore, these results also suggest that the commonly used analytical merger tree generated using the PS formula may not be suitable to study quasar formation at high redshifts.
There are two clear “shifts” of the mass function caused by resolution and cosmological parameters. Those from runs with higher resolution extend to higher redshifts, and at the same redshift, the WMAP1 runs produce more massive halos than the WMAP3 ones. As shown in Figure 2, the coarse runs produce mass functions only up to owing to limited mass resolution, while the zoom-in runs can produce quite reasonable mass functions as early as . Because the zoom-in runs were deliberately centered on the highest density peak of the box, they each contain a very massive halo ( at ) by construction. This explains why the highest mass bin (which contains only one halo in this case) is orders of magnitude larger than the theoretical curves (ST, PS), which apply only to a random region that has a much lower density fluctuation.
To summarize, at a given redshift, runs with the WMAP3 parameters yield slightly less massive halos than ones performed with the WMAP1 values. Or, to put it differently, objects in the WMAP3 cosmology will have masses similar to those for WMAP1, but at slightly later times (i.e. lower redshifts). In what follows, we are primarily concerned with investigating the plausibility of forming quasars through the self-regulated growth of SMBHs in hierarchical mergers, rather than precisely reproducing the properties of an individual quasar at a given redshift, such as J1148+5251. Most of our results are therefore based on runs with the WMAP1 parameters, to ease comparison with previous numerical work. If it were firmly established that e.g. is in reality smaller than its WMAP1 value, then a more exact match to a particular quasar could presumably be obtained by considering larger simulation volumes and identifying a suitable candidate host that is slightly rarer than the one we have chosen to focus on here.
2.4. Merger Tree Construction
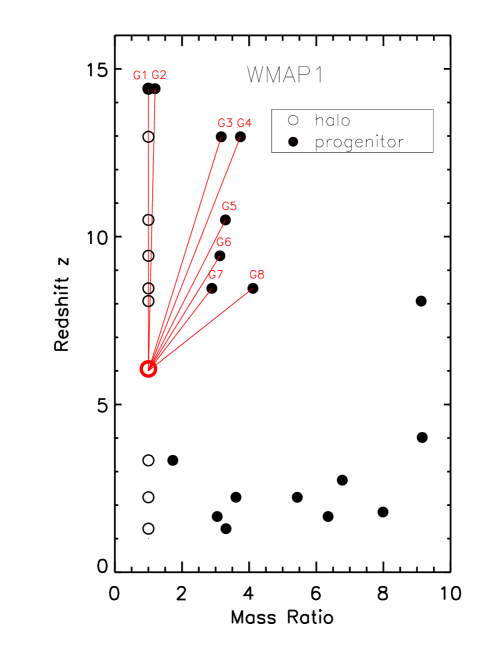
To follow the hierarchical mass assembly of the host galaxy over cosmic time, the merger tree of the halo is extracted from the cosmological simulation. This tree provides key information for computing the physical properties of the progenitor galaxy population. While the merger history of the halo includes a spectrum of progenitor masses, the most massive progenitors contribute the majority of the halo mass over the redshift range considered. We trace the merger history of the most massive progenitor at each redshift by using particle tags to identify progenitor systems at earlier redshifts in the simulation. Groups that contribute at least 10% of the halo mass at a given time step are considered as the progenitors of the halo and are recorded. The procedure is repeated until the last progenitor is reached, producing the merging history.
Figure 3 illustrates the merging history of the largest halo at in our cosmological simulation, which has a mass of . It is also the largest one at with a mass of . This schematic plot outlines the redshift of merger event, and the mass ratio of the halo to its galaxy progenitors at a given time. It shows that this halo grows rapidly through hierarchical mergers early on, with seven major mergers (mass ratio of the merging pairs ) from to that build up a substantial fraction of the halo mass at .
In modeling the development of a quasar, we are primarily interested in “major” mergers, where the mass ratio of the merging galaxies is not too far from unity, for several reasons. First, it is believed that major mergers play the most important role in the formation and evolution of massive galaxies (e.g., Sanders & Mirabel 1996; Scoville et al. 2000; Veilleux et al. 2002; Conselice et al. 2003; Dasyra et al. 2006). Second, and of greater concern to us in this paper, in our picture for quasar fueling, gas in a rotationally supported disk loses angular momentum through gravitational torques excited by tidal forces in a merger, driving the growth of supermassive black holes. This process operates most effectively in a major merger because the tidal deformation of each galaxy is significant in such an event (Barnes & Hernquist, 1991, 1992, 1996). Collisions involving galaxies with a mass ratio as large as can induce gas inflows in disks (Hernquist, 1989; Hernquist & Mihos, 1995), but only for limited orbital configurations. For these reasons, we focus on mergers from the merger tree having a mass ratio , as outlined by the red color in Figure 3.
In the resimulation of the merger tree as described in § 2.5, we take into account mass accretion of the halo by adding mass proportionally to each of the eight progenitor galaxies in the major mergers. This approach preserves the progenitor mass ratios and approximately preserves the dynamics of the major mergers (Dubinski, 1998).
2.5. Simulations of Galaxy Mergers Along the Tree
| GalaxyaaName of galaxy progenitor. G1 is the halo at . | bbRedshift at which the progenitor enters the merger tree. | ccVirial mass, assuming overdensity . | ddVirial velocity, assuming overdensity . | eeGas fraction of the progenitor baryonic mass. | ffProgenitor black hole mass at the merger redshift. | ggPericentric distance of the incoming progenitor to the center-of-mass of the existing system. | hhInitial distance of the incoming progenitor to the existing system. |
|---|---|---|---|---|---|---|---|
| [] | [km s-1] | [] | [] | [] | |||
| G1 | 14.4 | 6.3 | 234.1 | 1.0 | 0.15 | – | – |
| G2 | 14.4 | 5.3 | 220.3 | 1.0 | 0.15 | 0.2 | 7.1 |
| G3 | 13.0 | 15.0 | 297.8 | 1.0 | 0.51 | 0.2 | 8.5 |
| G4 | 13.0 | 17.7 | 314.6 | 1.0 | 0.51 | 0.3 | 10.7 |
| G5 | 10.5 | 49.1 | 401.0 | 1.0 | 6.56 | 0.4 | 11.3 |
| G6 | 9.4 | 79.6 | 448.6 | 0.9 | 23.3 | 0.5 | 18.2 |
| G7 | 8.5 | 160.0 | 540.4 | 0.9 | 89.2 | 0.7 | 25.2 |
| G8 | 8.5 | 207.7 | 589.5 | 0.9 | 89.2 | 1.0 | 34.5 |
In order to model the formation and evolution, and properties of the quasar candidate, the merger tree is then re-simulated hydrodynamically with galaxy models that consist of an extended dark matter halo, a rotationally supported, exponential disk of gas and stars and a central supermassive black hole. We follow the evolution of the system built up by seven major mergers hierarchically from to , as shown in Figure 3. Technically, this is a series of successive merger simulations. The first simulation includes G1 and G2 interacting at . It stops at and a new galaxy G3 is added into the system. During this process, all the dynamical properties of the pre-existing system (e.g. G1 and G2 in this case) are preserved, while G3 is added based on its properties and orbital parameters derived from cosmological simulations. Then a second merger simulation with G1, G2 and G3 starts. Such a procedure is repeated until all the progenitors enter the system. In the end, the simulation includes all eight galaxies. Eventually all these galaxies and black holes merge together. The duration of each merger simulation is determined by the merger tree. The redshift at which each progenitor galaxy enters the merger tree, the properties of each progenitor galaxy, and the numerical parameters of the merger simulations are listed in Table 1. Below we describe the specification of these parameters.
2.5.1 Galaxy Models
The structure of the galaxy models is motivated from leading theories of dissipational disk galaxy formation in CDM cosmologies that, as shown by Mo et al. (1998), are successful in reproducing the observed properties of both present-day disk galaxies and damped Ly absorbers in quasar spectra at high redshift. The initial galaxy models are constructed in dynamical equilibrium using a well-tested method (Hernquist 1993; Springel & White 1999; Springel 2000; Springel et al. 2005b). A halo is identified with a virial mass and a virial radius within which the overdensity , where and are the mean and critical density, respectively. The density profile of the dark matter halo follows a Hernquist profile (Hernquist, 1990), scaled to match that found in cosmological simulations (Navarro et al., 1997), as described in Springel et al. (2005b):
| (2) |
where is a parameter that relates the Hernquist (1990) profile parameters to the appropriate NFW halo scale-length and concentration (),
| (3) |
The exponential disk of stars and gas are then constructed as in Hernquist (1993) and Springel et al. (2005b). The properties of the galaxy, including the virial mass , virial radius and halo concentration are scaled appropriately with redshift, as described in Robertson et al. (2006b). In particular, for a progenitor with virial velocity at redshift , and are calculated following Mo et al. (1998), while is adopted from Bullock et al. (2001), as briefly outlined below:
| (4) | |||||
| (5) | |||||
| (6) | |||||
| (7) |
where is the gravitational constant, and is the linear collapse mass at the present epoch.
We assume a baryon fraction of for these high-redshift galaxies based on the WMAP1 result (Spergel et al., 2003). The gas fraction of each progenitor is extrapolated from the results of semi-analytic models of galaxy formation (Somerville et al., 2001), with 100% gas disks at and 90% at . The multiphase ISM is envisioned to consist of cold clouds embedded in a hot, tenuous gas in pressure equilibrium. Stars form out of the cold clouds by gravitational instability (Li et al., 2005) with a rate that is proportional to the surface density of the gas (Schmidt 1959; Kennicutt 1998; Li et al. 2006b).
In the adopted ISM model for the gas, the equation of state (EOS) is controlled by a parameter that linearly interpolates between isothermal gas () and a strongly pressurized multiphase ISM (). This EOS describes the dynamics of star-forming gas and accounts for the consequences of stellar feedback on galactic scales, and enables us to construct equilibrium disk models even with large gas fractions (Robertson et al., 2004; Springel & Hernquist, 2005). Supernova feedback is modeled through thermal energy input into surrounding gas and can help evaporate the cold clouds to replenish the hot phase. For the simulation presented here a value of is used, but test simulations using produce average star formation and black hole accretion rates that converge to within 15%.
2.5.2 Black Hole Accretion and Feedback
The supermassive black holes are represented by collisionless “sink” particles. They interact with other particles gravitationally, and accrete the gas. Accretion of gas onto the black holes is modeled using a Bondi-Hoyle-Lyttleton parameterization (Bondi 1952; Bondi & Hoyle 1944; Hoyle & Lyttleton 1941), in which the black holes accrete spherically from a stationary, uniform distribution of gas, as described in Di Matteo et al. (2005) and Springel et al. (2005b):
| (8) |
where is the black hole mass, and are the density and sound speed of the gas, respectively, is a dimensionless parameter of order unity, and is the velocity of the black hole relative to the gas.
We assume the accretion has an upper limit by the Eddington rate,
| (9) |
where is the proton mass, is the Thomson cross-section, and is the radiative efficiency. The latter determines the conversion efficiency of mass accretion into energy released as radiated luminosity. We adopt a fixed value of , which is the mean value for radiatively efficient Shakura & Sunyaev (1973) accretion onto a Schwarzschild black hole. In the simulations, the accretion rate is then the minimum of these two rates, .
The feedback from the black holes is associated with the mass accretion. We assume that a small fraction () of the radiated energy couples to the surrounding gas isotropically as feedback in form of thermal energy. This fraction is a free parameter, determined by matching the observed relation (Di Matteo et al., 2005). For more discussions on this prescription, see Hopkins et al. (2006a). This feedback scheme self-regulates the growth of the black hole, and has been demonstrated to successfully reproduce many observed properties of elliptical galaxies, as mentioned earlier.
2.5.3 Black Hole Seeds
To grow a black hole up to in less than 800 million years, a wide range in seed masses, from to , have been suggested (e.g., Carr et al. 1984; Loeb & Rasio 1994; Bromm & Loeb 2003; Haiman 2004; Yoo & Miralda-Escudé 2004; Volonteri & Rees 2005; Begelman et al. 2006). The formation of the black hole seeds remains an open question, and several scenarios have been proposed. In particular, Fryer et al. (2001) show that rapid collapse of massive PopIII stars due to pair instability could produce black hole of ; Bromm & Loeb (2003) suggest that hot and dense gas clump may collapse monolithicly to form a massive black hole of in metal-free galaxies with a virial temperature of K; while Begelman et al. (2006) propose that black holes could form by direct collapse of self-gravitating gas due to global instabilities in protogalactic halos, they then grow to with super-Eddington accretion. We adopt the picture where black hole seeds are the remnants of the first stars (Abel et al. 2002; Bromm & Larson 2004; Tan & McKee 2004; Yoshida et al. 2006; Gao et al. 2006). The remnant black hole mass is currently uncertain and widely debated. Recent theory of PopIII star formation predicts a mass range of , but there are two regimes where a SMBH could form, either or (Heger et al. 2003, see also Yoshida et al. 2006 for a recent discussion). We have tested the seed mass in the range of 100–300 and find that the exponential growth of the black holes during the merger makes our results insensitive to the choice in that range. We therefore assume that the black hole seed starts with an initial mass of after the collapse of the first star at .
These seed black holes then grow in the centers of halo which contains a large amount of high density primordial gas, as current theories predict that only one star forms per such mini-halo. The dense gas in the central region provides abundant fuel for BH accretion. To account for their evolution before the major mergers take place, the black holes are assumed to grow at the Eddington rate until their host galaxies enter the simulated merger tree. Such an approximation is supported by the fact that the Eddington ratio in the simulations depends on the galaxy interaction and strength of the feedback from the black holes. In our simulations, most black holes grow at nearly the Eddington rate in the early stages of a galaxy interaction when the feedback is weak. However, when the interaction and the feedback become stronger, the Eddington ratios fluctuate by orders of magnitude. So a constant accretion rate at the Eddington limit is no longer appropriate, as we show below. Under this assumption, the first progenitor galaxies (G1 and G2) of the quasar host have black hole seeds of order by the time it enters the merger tree at . However, we should emphasize that this assumption serves only as an upper limit of the early growth of the black holes. Our results in the next sections imply that even if all the black hole seeds had a uniform mass of when they enter the merger tree, it is still possible to build a massive one to at through gas-rich mergers.
In our model, mergers are invoked in the formation of the most massive black holes of because that requires large supplies of gas. Early on, however, this may not be necessary to grow the black hole seeds from to the we start from, because the accretion rate is small so other gas fueling could be sufficient. As demonstrated in Hopkins & Hernquist (2006), faint AGNs could be fueled by stochastic accretion of cold gas that does not involve mergers. A similar process could go on in the black hole seeds left by the PopIII stars at very high redshifts. We should point out that in our simulations, it is necessary for galaxy progenitors in the merger tree to have reasonable massive black hole seeds () initially in order to build a black hole at . However, our results are insensitive to specific formation recipes of the seeds. The formation of seed black holes at high redshifts is a challenging problem, and some of the proposed scenarios mentioned above may indeed be necessary to make our seeds. However, currently there is no observation available to test these models.
In the picture we adopt in which the seeds come from the first stars, the early accretion may be complicated by the feedback from the stars. We note that recent studies by Johnson & Bromm (2006); Abel et al. (2006) and Yoshida et al. (2007) show that HII regions form around the first stars, and that the halo gas would be photo-ionized, photo-heated, and evacuated by the radiation feedback from the stars. Johnson & Bromm (2006) suggest that such feedback would deplete the gas in the central region, and would delay the black hole accretion by up to yrs. However, this destruction effect depends sensitively on the lifetime of these massive stars, and more importantly on the environment which determines both the gas density profile and gas replenish from inflow of the expelled gas or neighboring halos. In the simulations presented in Johnson & Bromm (2006), the box size is only , too small to contain the large scale gravitational potential and the large wavelength density modes that drive gas infall, so the initial gas density is low and the destruction timescale is long in this case. However, the quasar halo in our simulation resides in the highest density peak in a volume of , where the halo potential and gas density, as well we the accretion rate are much higher (Gao et al., 2006). For a black hole, the accretion rate at Eddington limit is only , which corresponds to the Bondi accretion of molecular gas with a typical temperature of K at density , as implied from equation (8). Such a density requirement is satisfied with the initial conditions of our model. Therefore, the gas re-incorporation timescale in our case may be substantially shorter than that estimated in Johnson & Bromm (2006). We will investigate in a future project the growth and evolution of the early black holes after the death of the first stars in such a cosmological environment, using hydro-radiation simulations that include both radiative transfer and black hole accretion with ultra-high resolutions.
2.5.4 Numerical Parameters of Merger Simulations
The merger tree contains eight galaxies engaging in seven major mergers at different times. For each merger event, the initial orbits of the incoming progenitors are set to be parabolic, consistent with the majority of the major mergers in our cosmological simulation and with previous findings (Khochfar & Burkert, 2006). The orientation of each merging galaxy is selected randomly. The initial separation between each merging pair is set to , where is the virial radius of the incoming system, while the pericentric distance is chosen as , where is the radial disk scale length of the incoming system. We have tested different choices of and orientations, and found that the impact of these parameters is minor because the orbital properties of the progenitors change rapidly through interactions with the multiple galaxies in the system.
Throughout the merger simulation, the mass and force resolutions are fixed for each particle type, and the total initial particle number of results in particle masses of for the halo and for both the gas and stars. The gravitational softening lengths are for halo particles and for both gas and stars. In the simulations, it is impossible to resolve individual stars, and the accretion radii of some small black holes are under-resolved. However, with the sub-resolution implementation in our models, we can calculate time-averaged rates of star formation and black hole accretion from the large-scale properties of the gas, which are well resolved in our simulations. Resolution studies of a single merger (Springel et al., 2005b) with particle numbers from to show that resolution affects some fine structures of the gas and the instantaneous growth rates of star and black holes, but the time-averaged properties of the system converge to within 20%.
2.5.5 Halo Escape Velocity
In a galaxy merger with black holes, the black holes may merge into one, or may be ejected by gravitational recoil in the final stage. Their fate depends on the halo escape velocity . If the recoil velocity is larger than , then the black hole will be kicked out of the halo. We follow Binney & Tremaine (1987) to calculate this important parameter . It is defined by
| (10) |
where is the gravitational potential at a given radius . Because the halo is spherical, the potentials of different spherical shells add linearly, so is contributed by two parts, i.e., shells within () and outside ():
| (11) |
where is again the Hernquist (1990) density profile of dark matter halo as in Equation 2.
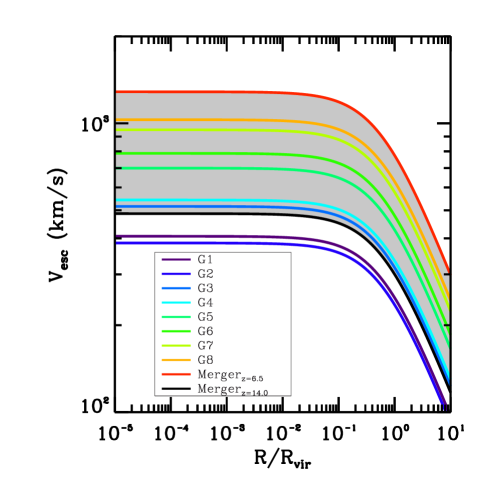
Figure 4 shows the escape velocities of the halo progenitors G1 – G8 in Table 1, as well as two merger remnants at and , respectively. The escape velocity depends on the halo mass, redshift, and distance from the halo center. The remains constant in the central region, begins to decline around . At the center, , while at the virial radius , the escape velocity is comparable to the virial velocity (by a factor of ). The isolated halo progenitors G1 – G8 have a range of – . The first merger halo at , which has a mass of as the merger of G1 and G2, has a central escape velocity of , while the final merger halo at , which has a mass of , has . The shaded region indicates the range of the halo escape velocities of the mergers in our simulations. In particular, the escape speed in the halo central region has a range of . This range is important for analysis of black hole ejection from gravitational recoil in the black hole binaries in § 3.4 and § 4.2.
3. Formation of A Luminous Quasar
3.1. Hierarchical Assembly of the Quasar Host
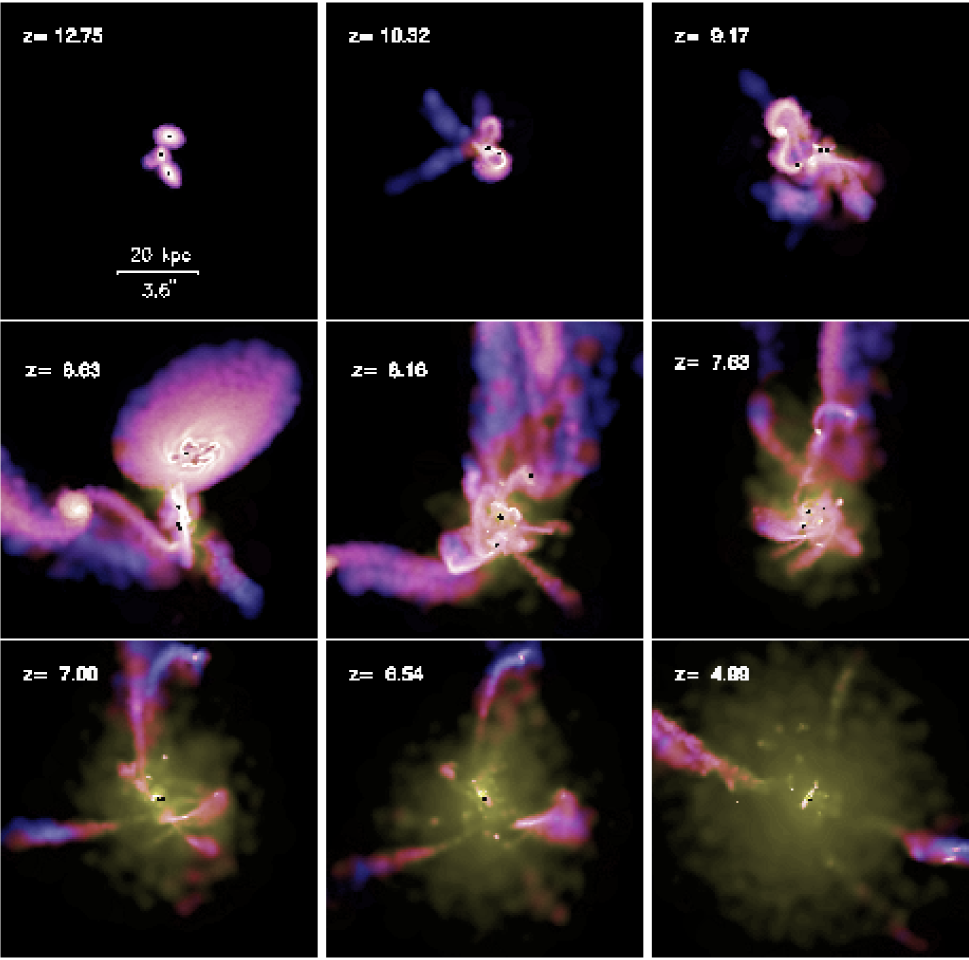
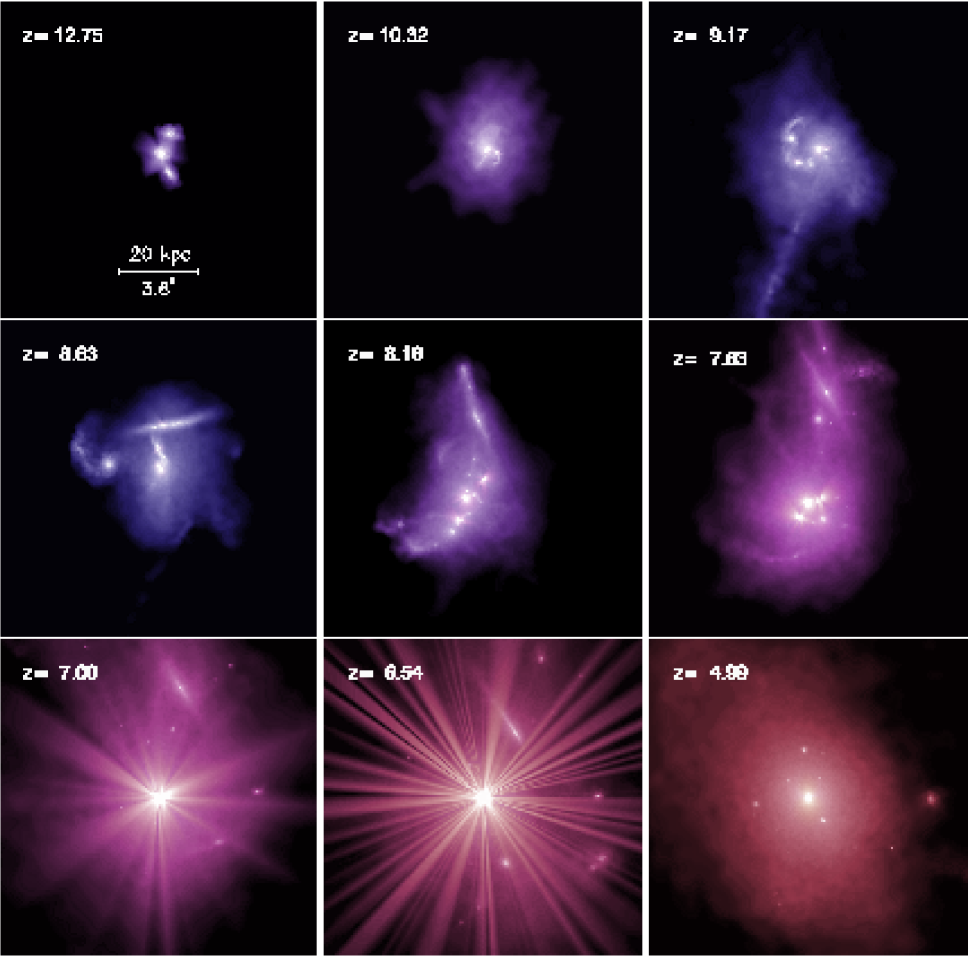
The vigorous merging history of the quasar host is illustrated through selected snapshots of the gas and stellar distributions in Figure 5 and Figure 6, respectively. The progenitors at high redshifts are very compact and gas rich. As the host galaxy of the quasar builds up hierarchically, strong gravitational interactions between the merging galaxies lead to tidal tails, strong shocks and efficient gas inflow that triggers large-scale starbursts, a phenomenon that has been demonstrated by many numerical simulations (e.g., Hernquist 1989; Hernquist & Katz 1989; Barnes & Hernquist 1991, 1996; Mihos & Hernquist 1994, 1996; Springel 2000; Barnes 2002; Naab & Burkert 2003; Li et al. 2004), as reviewed by Barnes & Hernquist (1992). The highly concentrated gas fuels rapid accretion onto the SMBHs (Di Matteo et al. 2005; Springel et al. 2005b). Between 14–9, the merging systems are physically small and the interactions occur on the scale of tens of kiloparsecs. By 9–7, when the last major mergers take place, the scale and strength of interactions have increased dramatically. Galaxies are largely disrupted in close encounters, tidal tails of gas and stars extend over hundreds of kiloparsecs, and intense bursts of star formation are triggered.
The black holes continue to grow rapidly during this period but are heavily obscured by a significant amount of circumnuclear gas. During galaxy mergers, the black holes follow their hosts to the center of the system and can interact closely with each other. It has been shown that black hole binaries decay rapidly in a gaseous environment and can merge within yrs (Escala et al. 2004; Li 2007). Because the galaxies in our simulations are very gas rich and the gas is highly concentrated during the mergers, we therefore assume that the black holes merge efficiently owing to strong dynamical friction with the gas (Springel et al., 2005b). We will return to more discussions of this process in § 3.4 and § 4.2.
At redshift the progenitor galaxies coalesce, inducing high central gas densities that bring the SMBH accretion and feedback to a climax. The SMBH feedback then drives a powerful galactic wind that clears the obscuring material from the center of the system. The largest SMBH becomes visible as an optically-bright quasar (Hopkins et al., 2006a) during this phase, after which quasar feedback quenches star formation and self-regulates SMBH accretion. Consequently, both star formation and quasar activity die down, leaving a remnant which reddens rapidly, as illustrated schematically in Figure 6.
3.2. Star Formation History
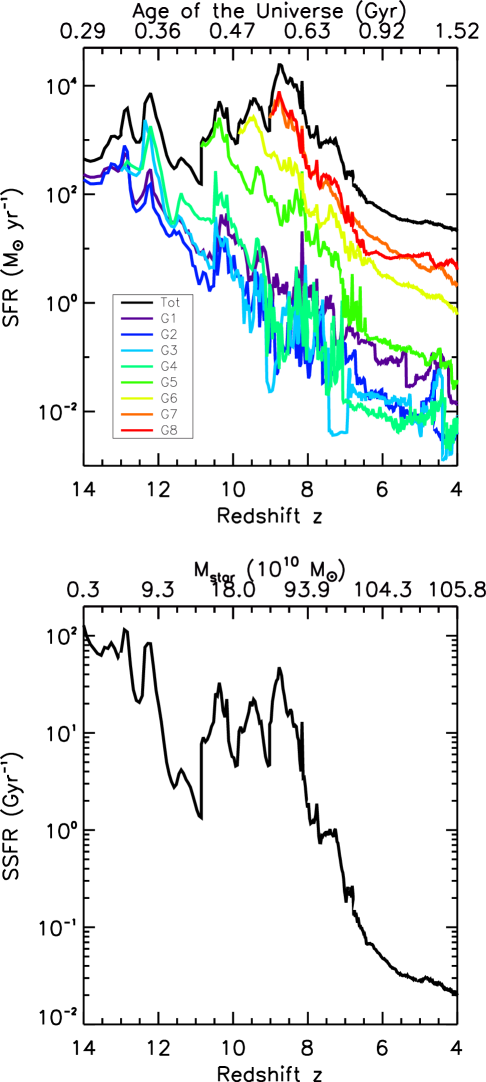
The evolution of the star formation rates (SFRs) of each individual galaxy, and total SFR of the whole system are shown in Figure 7 (top panel). The system forms stars rapidly as these compact and gas rich progenitors undergo strong interactions. The total SFR ranges from to between redshifts 9–8 when the galaxies begin their final major mergers, while the SFRs of individual galaxies fall below a few, within the starburst intensity limit of proposed by Meurer et al. (1997) and Thompson et al. (2005). At the star formation rate decreases gradually owing to a depletion of the gas supply and progressively stronger feedback from the SMBHs. At the time of final coalescence () the star formation rate is , an order of magnitude lower than for estimates of J1148+5251 (Bertoldi et al. 2003a; Carilli et al. 2004). We note, however, that the estimates by these authors are based on the assumption that the FIR luminosity is dominated by young stars, and they cannot rule out the possibility that AGN may contribute significantly to the luminosity.
In a forthcoming paper (Li et al., 2007), we have calculated the infrared properties of the quasar system using a 3-D Monte Carlo radiative transfer code that incorporates adaptive grids and treats dust emission self-consistently. We find that the far-infrared luminosity of our quasar is not dominated by young stars but instead has a substantial quasar contribution of over . This finding is supported by observations of J1148+5251 in near-IR (e.g., Charmandaris et al. 2004; Hines et al. 2006, and more recently Dwek 2006), which show a remarkably flat spectral energy distribution and suggest an AGN origin for the flux excess. Furthermore, adopting a total gas mass of (Walter et al. 2004; Narayanan et al. 2006c) in J1148+5251, a simple application of the Schmidt-Kennicutt star formation law (Schmidt 1959; Kennicutt 1998) gives a star formation rate of , close to what we find here.
Within only about 600 Myrs from to , the system accumulates a stellar mass of as shown in Figure 7 (bottom panel). The specific star formation rate (SSFR), or “b-parameter” (e.g., Brinchmann et al. 2004), is defined as . It is a measure of the fraction of the total stellar mass currently forming at a specific time. The SSFR is typically larger in high-redshift galaxies than in ones at low redshifts owing to vigorous star formation. During the past several years, there has been rapid progress in observing galaxies at using the Hubble Space Telescope (HST), and the Spitzer Space Telescope (Spitzer) coupled with ground-based observatories (e.g., Dickinson et al. 2004; Bunker et al. 2004; Bouwens et al. 2004; Giavalisco et al. 2004; Egami et al. 2005; Eyles et al. 2005; Mobasher et al. 2005; Yan et al. 2005, 2006; Eyles et al. 2006), and hundreds of these distant objects have been detected. These frontier observations suggest that the Universe experienced rapid star formation during the redshift interval , and the development of large stellar systems in the mass range of . In particular, several groups (Egami et al. 2005; Yan et al. 2006; Eyles et al. 2006) find SSFRs in the range of – in their observations, consistent with our simulations.
3.3. Metal Enrichment
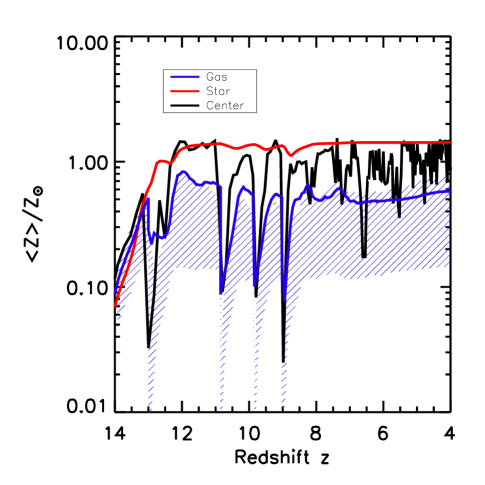
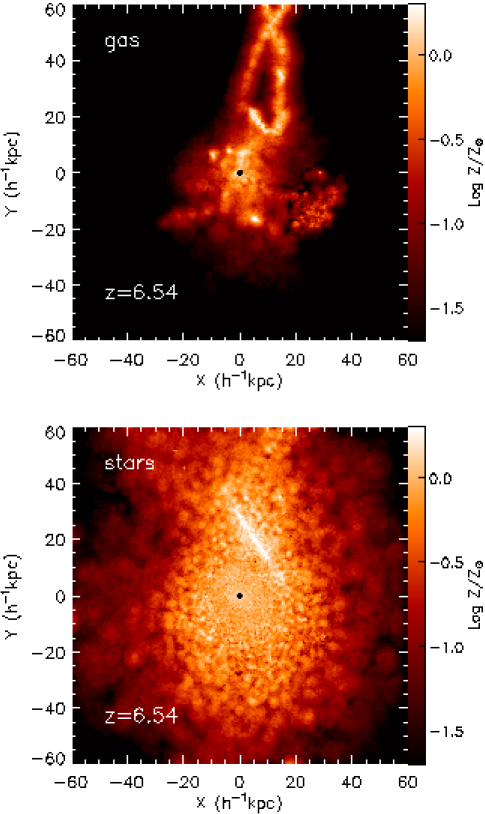
Rapid star formation in the quasar progenitors produces an abundant mass of heavy elements to enrich the ISM. Observations of J1148+5251 show solar metallicity in the system (Barth et al. 2003; Walter et al. 2003; Maiolino et al. 2005; Becker et al. 2006). Figure 8 shows the metallicity in our simulated quasar system at different times. Note that the dips and jumps in the curves owe to incoming new galaxies which bring in metal-poor pristine gas and newly-formed stars. The quasar host reaches solar metallicity as early as , and maintains similar levels to later times. The spatial distribution of metallicity from both gas and stars at the peak quasar phase at is shown in Figure 9. The metals are widely spread owing to outflow from the quasar feedback and gas infall toward the merger center. The metallicity in the central region of the merger remnant is slightly above the solar value. In some outer regions, because the gas and stars are still falling back to the system center, the infalling material triggers small-scale bursts of star formation. So the metallicity in these blobs appears to be super-solar, as shown in Figure 9.
Calculations of carbon monoxide emission using non-local thermodynamic equilibrium radiative transfer codes (Narayanan et al., 2006a, b) by Narayanan et al. (2006c) show CO luminosities, excitation patterns, and morphologies within the central of the quasar host center that are consistent with observations of J1148+5251 (Walter et al. 2003; Bertoldi et al. 2003b; Walter et al. 2004). These results were derived using Galactic CO abundances, and thus support our conclusions that significant metal enrichment takes place early in the quasar host, as a result of strong star formation in the progenitors.
3.4. Growth of Supermassive Black Holes
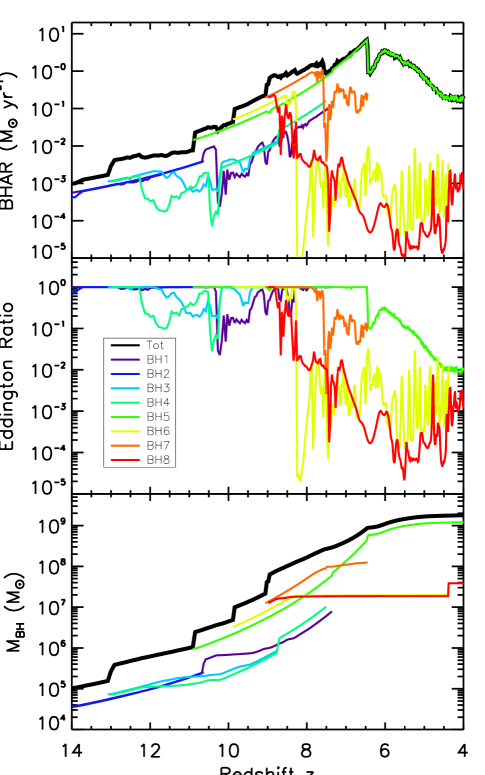
In the simulations, the quasar host at is built up by eight progenitors, each containing a black hole in the center. Figure 10 shows the evolution of the black hole accretion rate, the Eddington ratio, and the integrated masses of the whole system and individual black holes. The total black hole accretion rate grows steadily during the hierarchical assembly of the host galaxy and peaks at around during the final coalescence.
The Eddington ratio, , of each individual black hole varies with time, depending on the galaxy interaction and feedback from the black holes. The black holes maintain accretion at the Eddington limit for only a fraction () of the time. At the peak of quasar activity, the Eddington ratio of the most massive black hole is near unity, while that of the other black hole is only 0.1. However, collectively, the whole system appears to accrete at at , as implied in Figure 10. Studies of black hole accretion (e.g., Vestergaard 2004; Kollmeier et al. 2005; Vestergaard & Fan 2006) show that the Eddington ratio has a wide range of 0.01–1.0, and it varies with both luminosity and redshift. Luminous systems tend to have higher than less-luminous counterparts, and at , most quasars shine at nearly Eddington luminosity. Our results suggest that individual black holes do not always necessarily accrete at the Eddington rate. However, since high-redshift, luminous quasars may form through mergers of several galaxy progenitors containing black holes as in our case, therefore the growth of the quasar represents a collective contribution from each individual black hole. The total black hole mass increases from at to about at , close to that estimated for J1148+5251 by Willott et al. (2003) and Barth et al. (2003).
In the simulations, we do not have sufficient resolution nor the relativistic physics to consider the ejection of black holes by gravitational recoil. The black holes are assumed to merge efficiently once their separation is below the spatial resolution. In the final stage of black hole mergers, the emission of gravitational wave carries linear momentum, which could cause the black holes to recoil (e.g., Bonnor & Rotenberg 1961; Peres 1962). If the recoil velocity is larger than the halo escape velocity, then the black holes will be kicked out from their halo (e.g., Fitchett 1983; Favata et al. 2004; Merritt et al. 2004; Madau & Quataert 2004; Haiman 2004; Yoo & Miralda-Escudé 2004; Volonteri & Rees 2005). Previous studies by (Haiman, 2004; Yoo & Miralda-Escudé, 2004; Volonteri & Rees, 2005; Haiman, 2006) suggest that constant or super-Eddington accretion is required to produce black holes at if ejection of black holes is included. In particular, Haiman (2004) suggests a black hole will be ejected if the kick velocity for the coalescing SMBH binary is larger than twice the halo velocity dispersion , , as the dynamical friction timescale for the kicked black hole to return to the halo center is longer than the Hubble time (Madau & Quataert, 2004). By applying this ejection criterion to a Press-Schechter merger tree of a halo within which J1148+5251 is assumed to reside, Haiman (2004) finds that the SMBH of the quasar gains most of its mass rapidly from seed holes during due to black hole ejection, and the SMBH likely accretes with super-Eddington rate in order to build a mass as that of J1148+5251.
However, the halo escape velocities or velocity dispersions in our model are much larger than the currently best estimates of the kick velocity. The quasar halo in our simulations has active merging history from redshifts to , and the halo progenitors have masses much higher than those considered in the previous studies (Haiman, 2004; Yoo & Miralda-Escudé, 2004; Volonteri & Rees, 2005). The quasar halo builds its mass from at (the sum of progenitors G1 and G2 in Table 1) to at . As shown in Figure 4 (the shaded region), the central escape velocity of the mergers in our simulations is in the range . Currently, the maximum kick velocity for unequal-mass, non-rotating BH binary is in the range of – from both analytic post-Newtonian approximation (e.g., Blanchet et al. 2005; Damour & Gopakumar 2006) and the ground-breaking full relativistic numerical simulations (e.g., Herrmann et al. 2006; Baker et al. 2006; Gonzalez et al. 2006). For equal-mass, spinning BH binary, Favata et al. (2004) estimate a range of – using BH perturbation theory, and Herrmann et al. (2007) derive a formula from relativistic simulations, , where is the BH spin. This gives a maximum kick of for maximal spin. Although it is also reported that the recoil velocity can be as large as thousands (Gonzalez et al., 2007; Campanelli et al., 2007) for BH binary in the orbital plane with opposite-directed spin. However, as pointed out by Bogdanovic et al. (2007), such a configuration is rather uncommon, especially in gas-rich galaxy mergers, because torques from accreting gas suffice to align the orbit and spins of both black holes with the large-scale gas flow. The resulting maximum kick velocity from such a configuration is . Overall, the kick velocity from the latest calculations of black hole binary is in the range of – , falling safely below the escape velocities of the quasar halos in our simulations, so black hole ejection may be insignificant in our case.
Moreover, we find that our model can produce a SMBH even if ejection is allowed. From Figure 10 (bottom panel), the SMBH is dominated by BH5, most of its mass comes from gas accretion. Even if the less massive black holes, for example BH7 or BH8 was ejected, the most massive one BH5 is still able to reach in the end. Furthermore, even if all the seeds started with in the merger tree, the result would be about the same. We therefore conclude that the results from our modeling are robust. Suppermassive black holes of can grow rapidly through gas accretion and mergers hierarchically in the early Universe, constant or super-Eddington accretion is not necessary, unless the recoil velocity of the coalescing black hole binary is extremely high such that most of the black hole seeds in our simulations are ejected (e.g., ).
3.5. Correlations between Supermassive Black Hole and Host Galaxy
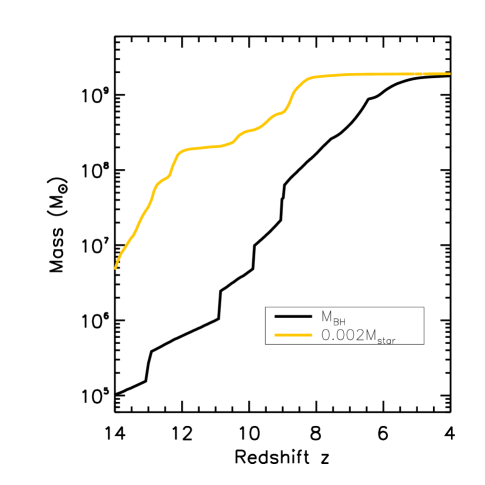
Tight correlations between supermassive black holes and hosts have been observed in local galaxies (e.g., Magorrian et al. 1998; Ferrarese & Merritt 2000; Gebhardt et al. 2000), but the inference of these relationships at higher redshifts remains an open question. Because the eight galaxies in our system interact vigorously with each other, the stellar components are widely spread and mixed, it is impossible to separate individual galaxy-SMBH pairs, so we only consider the correlations in total quantity of the whole system. A comparison of the total stellar mass and total black hole mass is shown in Figure 11. At early time, both the stars and black holes grow rapidly through galaxy mergers. Shortly after the peak quasar phase, strong feedback suppresses both the accretion and star formation, the masses of the black holes and stars become saturated gradually, and in the end satisfy , similar to the correlation measured in nearby galaxies (Magorrian et al. 1998; Marconi & Hunt 2003). Our results are consistent with findings by Robertson et al. (2006b) and Hopkins et al. (2007), and demonstrate that the observed scaling relation is a result of the coeval growth of the SMBH and its host galaxy, and that it holds across different cosmic times.
We note, however, that the velocity dispersion of the stars in the remnant center is about (after the system relaxes) owing to the deep potential well of the merger system, so the relation falls below the correlation observed locally (Ferrarese & Merritt 2000; Gebhardt et al. 2000; Tremaine et al. 2002). Single mergers of progenitor galaxies constructed in a redshift range of z=0–6 by Robertson et al. (2006b) appear to follow the observed correlation with a weak redshift dependence of the normalization, which results from an increasing velocity dispersion of the progenitors at higher redshift. The multiple mergers we derive from cosmological simulations take place at much higher redshifts and hence the progenitors have larger velocity dispersions, implying a larger deviation from the local relation than in the work of Robertson et al. (2006b). However, because we do not follow subsequent mergers and accretion into the host halo below , the implications of this result for the evolution of the relation are unclear.
Observations of active galaxies have yielded ambiguous results about the SMBH–spheroid relationship. For example, Greene & Ho (2006) report a lower zero-point of the of local active galaxies than that of the inactive sample (Tremaine et al., 2002); at , Shields et al. (2003) found the same relation in the redshift range 1–3, while others (e.g., Treu et al. 2004; Walter et al. 2004; Borys et al. 2005; Peng et al. 2006; Shields et al. 2006) show correlations with various offsets. In particular, Walter et al. (2004) estimate a dynamical mass of using the CO linewidth measured in J1148+5251, and suggest that the bulge is under-massive by at least one order of magnitude compared to the local relation. However, the CO calculation by Narayanan et al. (2006c) finds that the CO linewidth of the quasar in our simulation is larger than the mean 280 km s-1 measured by Bertoldi et al. (2003b) and Walter et al. (2004) by almost an order of magnitude, and that the derived dynamical mass is , putting the simulated quasar on the correlation. Narayanan et al. (2006c) further suggest that the observed emission line may be sitting on top of a much broader line, which may be tested by future observations with large bandwidths.
The different relations reported from the observations may reflect a divergence of the methods used to estimate the black hole mass and stellar properties, or may represent different evolutionary stages of the systems (Wu, 2006; Hopkins et al., 2007). More observations and better measurements of black hole mass and properties of host bulges will be crucial to study the SMBH–host relations in high-redshift quasar systems (Vestergaard & Peterson, 2006) and to test our hypothesis.
3.6. Quasar Luminosities
Both the bolometric and attenuated luminosities of the quasar and the host galaxy in the simulations can be readily calculated following the methodology of Hopkins et al. (2005d). The bolometric luminosity of stars is calculated using the stellar population synthesis model of Bruzual & Charlot (2003), while that of a black hole is calculated as , where is the radiative efficiency, is the black hole accretion rate, and is the speed of light. In this calculation, the black holes are assumed to be non-rotating. If the black holes are spinning, their radiative efficiencies and luminosities would be higher due to the shrink of the innermost stable circular orbit, by up to a factor of 4 for maximal rotation.
The B-band luminosity of each source is corrected for attenuation by absorption from the ISM along the line-of-sight. We first calculate the line-of-sight column-density of the gas from each source to a distant observer. For each black hole we generate 1000 radial sight lines originating at the black hole particle location and uniformly spaced in the solid angle , while for the stars, an accurate estimate of the luminosity is possible with only one sight line per source owing to the extended distribution. Along each ray, the gas column density is calculated using a radial spacing of , where and is the local SPH smoothing length. The distribution of line-of-sight properties converges for rays and at a distance of . In the calculation, only the diffuse-phase density is considered because of its large volume filling factor , allowing for a determination of the lower limit on the column density along a particular line of sight.
Adopting the mean observed intrinsic quasar continuum spectral energy distribution (Richards et al., 2006) gives a B-band luminosity which is well approximated by the following equation given by Marconi et al. (2004), , where , and . We then use the Milky Way gas-to-dust ratio scaled by metallicity, to determine the extinction along a given line of sight for this band. In the above calculation, we do not include a full treatment of radiative transfer, and therefore do not model scattering or re-processing of radiation by dust in the infrared. However, for the B-band luminosity, results using a 3-D Monte Carlo radiative transfer code are close to those calculated using the methods we present here (Li et al., 2007; Chakrabarti et al., 2006).
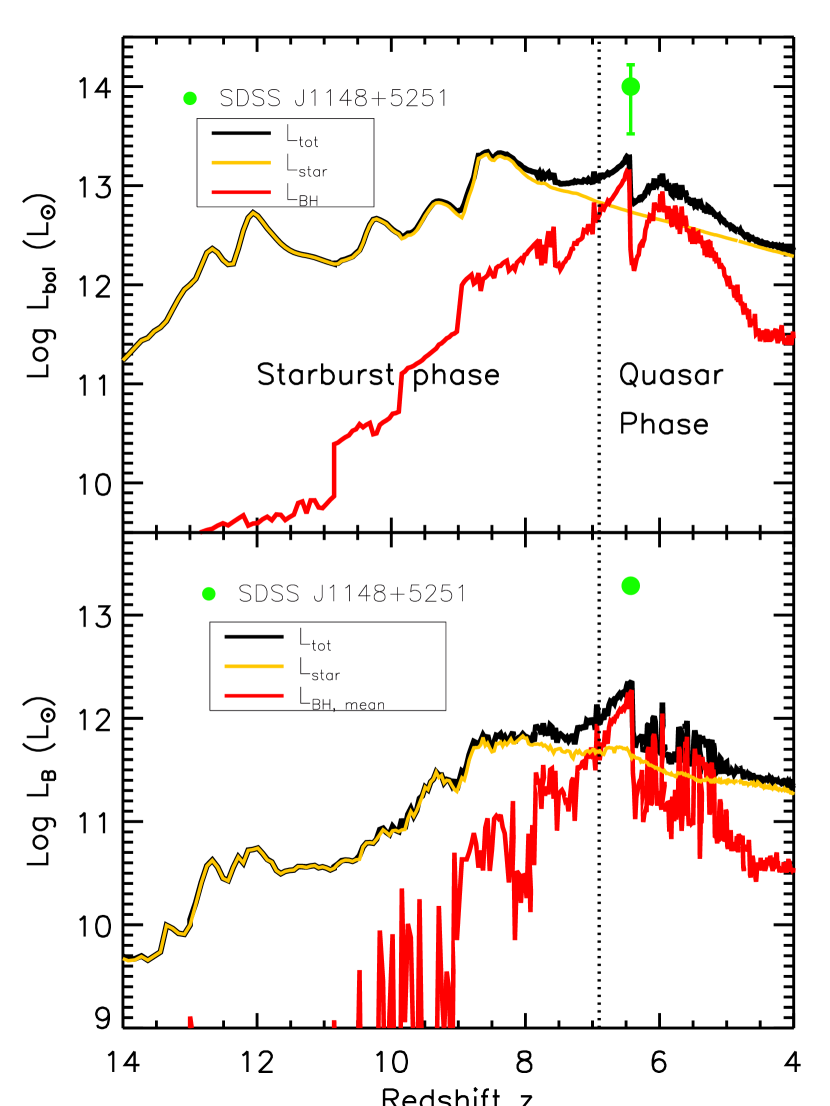
Figure 12 shows both the bolometric and attenuated B-band luminosities of the quasar, compared with observations of J1148+5251. The system is intrinsically bright with a total luminosity , and the host appears as an ultraluminous infrared galaxy (ULIRG) with for most of the time. At high redshifts, , starlight dominates the total luminosity. However, black holes take over at a later time. The quasar light-curve increases dramatically, peaking at , when it is powered by the most massive black hole accreting at near the Eddington rate. The estimated of J1148+5251 differs from that of the simulated quasar by less than the uncertainty in the luminosity estimate. The rest-frame B-band absolute magnitude reaches , almost one magnitude fainter than that of J1148+5251 derived from 1450 data (Fan et al., 2003). However, we should emphasize that in this paper, our main goal is to investigate the plausibility of forming luminous quasars through hierarchical mergers, rather than precisely reproducing the properties of an individual quasar such as J1148+5251, so the disagreement shown in Figure 12 should not be taken too literally. Moreover, the exact luminosity can change by a factor of several from relatively trivial or random details in the simulations. If the black hole spin is taken into account, then the simulated luminosities would increase by a factor of up to 4, which would match the observation of J1148+5251 better.
Feedback-driven outflows create un-obscured lines-of-sight, allowing the growing central SMBH to be visible as an optically-bright quasar between redshifts and . At the peak of the quasar activity, more than 50% of the 1000 sight lines have . The absorbed light is re-emitted at infrared wavelengths by dust. We find that the luminosity in the far infrared (Li et al., 2007) is close to estimated for J1148+5251 by Bertoldi et al. (2003a). Moreover, we find that up to 80% of the FIR light comes from the black hole, while stars contribute only . This may explain why the star formation rate at during the peak quasar phase is an order of magnitude lower than the estimate from FIR observations (Bertoldi et al., 2003a), which will be contaminated by the AGN.
Another prominent feature of Figure 12 is a clear phase transition from starburst to quasar. It has long been suggested that ULIRGs are powered by starbursts in galaxy mergers (for reviews, see Sanders & Mirabel 1996; Jogee 2006), and that bright quasars are the descendants of ULIRGs (Sanders et al. 1988; Norman & Scoville 1988; Scoville 2003; Alexander et al. 2005). This conjecture has been supported by observations of quasar hosts (e.g., Stockton 1978; Heckman et al. 1984; Hutchings & Neff 1992; Bahcall et al. 1997; Hutchings 2005), and theoretical modeling (Hopkins et al., 2006a). In Li et al. (2007), we calculate the spectral energy distributions (SEDs) of the quasar system and its galaxy progenitors. We find that the SEDs of the system at are characterized by those of starburst galaxies (Sanders & Mirabel, 1996), while at the peak quasar phase, the SEDs resemble those observed in quasars (Jiang et al., 2006). We also find that the system evolves from cold to warm ULIRG as it transforms from starburst to quasar phase. Our results provide further theoretical evidence for the ULIRG–quasar connection in quasar systems in the early Universe.
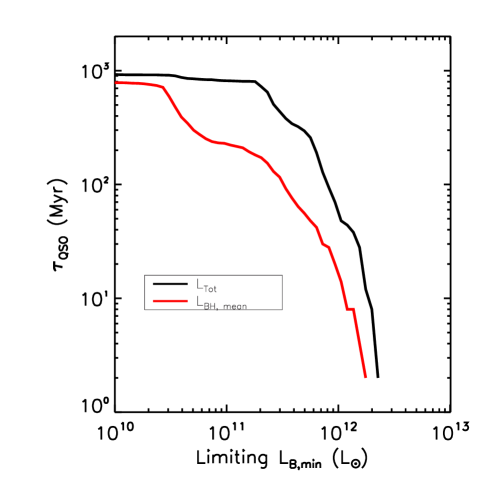
The quasar lifetimes depend on the observed luminosity threshold, as proposed by Hopkins et al. (2005d). In our simulation, at the peak luminosity of , the quasar lifetime is roughly yrs, as shown in Figure 13. Again, If black hole spin is included in the calculation, the luminosity of the quasar would increase by a factor of several, and the quasar lifetime would be longer. However, when increasing the radiative efficiency, the Salpeter time (-folding time for Eddington-limited black hole growth, Salpeter 1964) is increased by an identical factor, meaning it would also require a longer time to reach the same mass. If high-redshift quasars are rapidly rotating, then, our calculations demand that either the seeds be much more massive at , or that they accrete in a super-Eddington manner. In other words, if the observed Sloan quasars at shine with Eddington luminosity but are rotating rapidly, then our model suggests that their masses would be considerably smaller than estimated.
We note that recent Spitzer observations by Jiang et al. (2006) show that 2 out of 13 quasars at have a remarkably low NIR-to-optical flux ratio compared to other quasars at different redshifts, and these authors suggest that the two quasars may have different dust properties. According to our model, however, these two outliers may be young quasars that have just experienced their first major starburst but have not yet reached peak quasar activity, so the light from star formation may be dominant, or comparable to that from the accreting SMBH still buried in dense gas. This may explain the low NIR flux, as well as the B-band luminosity and the narrow emission line, which are primarily produced by the starburst. We will address this question further in a future paper with detailed modeling and IR calculations (Li et al., 2007).
4. Discussion
4.1. Comparison with Previous Models and Robustness of Our Results
Our multi-scale simulations that include large-scale cosmological N-body calculations and hydrodynamic simulations of galaxy mergers, as well as a self-regulated model for black hole growth, have successfully produced a luminous quasar at with a black hole mass of and a number of properties similar to those of J1148+5251, the most distant quasar detected at (Fan et al., 2003). Our approach differs from previous semi-analytic studies by Haiman & Loeb (2001); Haiman (2004); Yoo & Miralda-Escudé (2004); Volonteri & Rees (2005) and Volonteri & Rees (2006) in the following ways:
-
1.
We use a realistic merger tree derived directly from multi-scale, high-resolution cosmological simulations. The previous studies used merger trees of dark matter halos generated with the extended Press-Schechter theory (Press & Schechter, 1974; Lacey & Cole, 1993), which may underestimate the abundance of high-mass halos by up to one order of magnitude, as shown in § 2.3. Also, the merger trees in those studies started from much higher redshifts than what we consider here. In our model, the quasar halo is the largest one in a volume of . It has a mass of at built up through seven major mergers from to .
-
2.
We follow the evolution of the system and treat the gas dynamics, star formation, and black hole growth properly. This approach is critical to investigation of the properties of both black holes and host galaxies, and their evolution (e.g., Di Matteo et al. 2005; Springel et al. 2005b; Robertson et al. 2006b; Hopkins et al. 2006a), but it was not included in those previous studies on formation of quasars.
-
3.
We employ a self-regulated model for the growth of supermassive black holes, in which the accretion is regulated by the black hole feedback, and the rate is under the Eddington limit. In the previous studies, the black hole growth was unregulated, but instead a constant- or super-Eddington accretion rate was used.
-
4.
In our simulations, we do not consider black hole ejection caused by gravitational recoil owing to insufficient resolution and lack of relativistic physics. However, the halo escape velocities in our simulations are in the range of – , much larger than the kick velocity – (e.g., Herrmann et al. 2006; Baker et al. 2006; Gonzalez et al. 2006; Herrmann et al. 2007, see § 2.5.5 and § 3.4 for more details). Therefore, black hole ejection may be negligible in our case. Previous studies had much smaller halo progenitors at higher redshifts than ours, so the black hole seeds would be more likely subject to ejection from their halos. This leads to the conclusion in these studies that constant or super-Eddington accretion is needed owing to significant black hole ejection. Our results are robust within the best estimates currently available for the recoil velocity of the black hole binary.
-
5.
The black hole seeds in the galaxy progenitors in our simulations are massive (e.g., at ). The sub-resolution recipe in our model does not allow us to resolve the actual formation and accretion of such black holes below this mass scale. The formation of these seeds is an unsolved problem, but our results do not depend on the specific prescription of the formation process. We adopt a picture in which the seed holes come from the remnants of the first stars (which have a mass at ) and grow under Eddington limit until they enter the merger tree we simulated. If the growth is delayed by radiation feedback from the PopIII stars (e.g., Johnson & Bromm 2006), then super-Eddington accretion, or other proposed scenarios (e.g., Bromm & Loeb 2003; Begelman et al. 2006) may be necessary to form massive seeds of in the protogalaxies.
Overall, we conclude that the results from our simulations, which are more realistic and more detailed than the models previously done, are robust. Suppermassive black holes of can form rapidly through gas-rich hierarchical mergers under Eddington limit, even within a short period of time. We find that constant or super-Eddington accretion is not necessary unless the above assumptions in our modeling break, i.e., there are no massive black hole seeds of available at , or the recoil velocity of the coalescing black hole binary is extremely high (e.g., ). Under these extreme circumstances, some “exotic” processes such as super-Eddington accretion may be necessary to grow a SMBH within a few hundred million years. However, we should note, as pointed out by Bogdanovic et al. (2007), that most gas-rich galaxy mergers have a configuration such that the orbit and spins of both black holes are aligned with the large-scale gas flow owing to torques from accreting gas. Such a configuration has a maximum kick velocity , which is well below the escape velocity of a dwarf galaxy, as well as those of the halos in our modeling.
4.2. Merging History of Black Holes
During the galaxy mergers, the black holes follow their host halos to the system center and can form binaries (or multiple systems). The coalescence of a black hole binary includes three distinct phases: inspiral, merger, and ringdown (e.g., Flanagan & Hughes 1998). Whether black hole binaries can coalesce on short timescales is a matter of debate. In a stellar environment, it has been argued that a binary hardens very slowly owing to an eventual depletion of stars that cause the binary to lose angular momentum (e.g., Begelman et al. 1980; Milosavljević & Merritt 2003). In a gaseous environment, however, numerical simulations by Escala et al. (2004) and Li (2007) show that the binaries decay rapidly owing to strong dynamical friction with the gas, and they likely merge within years. Because our galaxies are very gas rich and have large central concentrations of gas during the mergers, we assume the black hole particles coalesce once their separation decreases below our spatial resolution () and their relative speed falls below the local gas sound speed (Springel et al., 2005b).
In the simulations, we do not have sufficient resolution nor the relativistic physics to consider the ejection of black holes by gravitational recoil during the merger phase. However, as discussed in § 2.5.5 and § 3.4, the halo escape velocities in our simulations are much larger than the maximum kick velocity for black hole binary estimated from the latest relativistic calculations. So black hole ejection is likely unimportant in our modeling. To accurately address gravitational recoil in the galaxy merger simulations, we need to include general relativity, resolve the dynamics of black hole binaries with extremely high resolution, and calculate the halo potential in a cosmological context (in which halo potential distribution may be different from that of a single object). However, such a comprehensive treatment is impossible at the moment. We therefore assume the black holes merge quickly once they reach the stage of gravitational radiation.
These coalescing supermassive black holes will be strong sources of gravitational radiation detectable by the Laser Interferometer Space Antenna (LISA, Folkner 1998), as suggested by many authors (e.g., Thorne & Braginskii 1976; Haehnelt 1998; Flanagan & Hughes 1998; Menou et al. 2001; Hughes 2002; Sesana et al. 2005; Koushiappas & Zentner 2006). By tracing the merging history of the SMBHs, LISA could shed light on the distribution, structures and evolution of the associated dark matter halos. Because luminous, high-redshift quasars are likely sites of vigorous hierarchical mergers, they may be the best targets for LISA to explore the early Universe.
4.3. Feedback from Starburst-driven Winds

Vigorous star formation would induce a galactic wind and mass outflow, a phenomenon that has been observed to prevail in both local star-forming galaxies as indicated by blueshifted optical absorption lines (e.g., Martin 1999; Heckman et al. 2000; Martin 2005; Rupke et al. 2002, 2005), and Lyman Break Galaxies at as indicated by blueshifted interstellar absorption lines and redshifted Ly emission lines (e.g., Pettini et al. 2002; Shapley et al. 2003), as well as Ly emitters at (Ajiki et al., 2002). These galactic winds are generally thought to play a significant role in galaxy evolution (e.g., see Veilleux et al. 2005 and Cox et al. 2006a for recent reviews).
The strong starburst preceding the major quasar phase in our simulations may drive strong galactic winds and affect the black hole growth. To investigate the impact of the feedback from a starburst-driven wind on the growth of the black hole, we have done the same merger simulation with lower resolution () and with a canonical wind model from Springel & Hernquist (2003b): the wind efficiency , which measures the coefficient of the star formation that determines the mass outflow; the energy fraction from supernovae injected into the wind , wind free travel length , and a wind velocity . As demonstrated by Cox et al. (2006a), this wind model is able to reproduce the starbursts as observed in Lyman Break Galaxies, and therefore is suitable to our study.
We find that the impact of the starburst-driven wind on the quasar evolution is minor, as shown in Figure 14. Both the histories of star formation and black hole growth remain roughly the same as in the simulation without a starburst wind, only the amplitude is lowered by a factor of . Similarly, the final masses of the black hole and the stars are reduced by roughly the same factor, but the quasar host is still on the correlation. The peak quasar phase is delayed to . Overall, the starburst wind affects the gas dynamics locally, but owing to the deep potential of the system, its impact on the process of quasar formation is minor. Our results support the finding by Cox et al. (2006a) that feedback from starburst-driven winds alone is ineffective at regulating the growth of the central black hole, so feedback from the black hole plays the dominant role in the formation and evolution of quasars.
4.4. Abundance and Fate of Quasar Halos at

Because we have so far simulated only one quasar in a volume of , we are not yet able to constrain the expected abundance of quasars . As mentioned in § 2.3, at a given redshift, cosmological simulations with parameters from WMAP1 produce more massive halos than runs with WMAP3 owing to a larger value of . Figure 15 shows the number of halos at from the zoom-in runs with parameters from both WMAP1 and WMAP3. There are about three dozen halos with mass in the WMAP1 run, while in the WMAP3 run there are only a handful of such halos. However, since in our picture the quasar activity depends not only on the halo mass, but also on the merging history, an accurate estimate of the quasar abundance and luminosity function would require hydrodynamical simulations of all the quasar candidates in a large box, which are currently unavailable. Nevertheless, all conditions being equal, the change from the WMAP3 parameters would produce fewer luminous quasars at . This suggests that in a WMAP3 cosmology, the quasar observed with the largest redshift, J1148+5251, might have formed in a slightly higher overdensity peak than that we have presented here. In that event, if the WMAP3 determination of were correct, we would need to identify a rarer density fluctuation to match J1148+5251 at its observed redshift. However, this does not change our conclusion that the most distant and luminous quasars can form from hierarchical galaxy mergers in the CDM cosmology.
Imaging surveys of J1148+5251 show that there is no other luminous quasar from the same epoch in the field (Carilli et al. 2004; White et al. 2005; Willott et al. 2005). In our simulations, around the peak of quasar activity at , there are no other halos of mass within a few Mpc of this quasar. However, the numerous major mergers this halo experienced prior to the peak quasar activity demonstrates that this region was once highly clustered with massive halos, but they merged to become a bigger one by .
As seen from Figure 3, this quasar halo will undergo a handful of major mergers at a later time from 4–1, and eventually end up as a cD-like galaxy at the center of a rich cluster. Since we do not follow hydrodynamically the evolution of the quasar at , the physical conditions of these mergers remain undetermined. It is not clear whether this halo would experience more episodes of starburst or quasar activity later on during these mergers. Therefore, the final black hole mass and other properties of this quasar at the present day are deferred to future simulations that follow its evolution to .
4.5. Galaxies in the Epoch of Reionization
The epoch of reionization (EoR) is an important landmark event in cosmic history that constrains the formation of the first luminous objects (Loeb & Barkana, 2001). The recent results of WMAP3 indicate that the Universe was 50% reionized at (Page et al., 2006; Spergel et al., 2006), while studies of Gunn-Peterson absorption (Gunn & Peterson, 1965) suggest that reionization began as early as and ended at (Fan et al., 2006). At present, it is believed that the reionization sources are star-forming galaxies since there are insufficient quasars at as indicated by the steep quasar luminosity function (Fan et al., 2006).
The galaxy progenitors of the quasar in our simulations underwent extreme and prolonged starbursts before . Less extreme galaxies in this epoch may also have vigorous star formation histories. Detecting these galaxies and determining their contribution to reionization will be crucial to understanding the EoR (Hernquist & Springel 2003; Barton et al. 2004; Davé et al. 2006). As reviewed by Hu & Cowie (2006), recent observations using both broad-band colors (e.g., Dickinson et al. 2004; Yan et al. 2005; Bunker et al. 2004; Bouwens et al. 2004; Giavalisco et al. 2004; Egami et al. 2005; Eyles et al. 2005; Mobasher et al. 2005; Yan et al. 2006; Eyles et al. 2006) and narrow-band Ly emission (e.g., Hu et al. 2002; Malhotra & Rhoads 2004; Stern et al. 2005) have detected galaxies at and a handful at (Bouwens et al., 2005). The low luminosity density of galaxies currently detected at seems insufficient to reionize the Universe. However, ongoing surveys with the HST and Spitzer telescopes, and future missions such as the Dark Ages z Ly Explorer (DAzLE, Horton et al. 2004) and the James Webb Space Telescope (JWST, Windhorst et al. 2006) will search deeper and further for high-redshift objects, and may eventually unveil ionizing sources in the EoR.
5. Summary
We have presented a model that accounts for the SMBH growth, quasar activity and host galaxy properties of the most distant quasar observed at , by following the hierarchical assembly of the quasar halo in the standard CDM cosmology. We employ a set of multi-scale simulations that include large-scale cosmological N-body calculations and hydrodynamic simulations of galaxy mergers, and a recipe for black hole growth self-regulated by feedback. We first perform a coarse N-body simulation in a volume of to identify the largest halo at , which is assumed to be the descendant of the earliest luminous quasar. We then “zoom in” on the halo and resimulate the region with higher resolution sufficient to extract its merging history starting from very high redshift. The largest halo at reaches a mass of through 7 major mergers between 14.4–6.5. These major mergers are again re-simulated hydrodynamically using galaxy models and recipes for star formation, SMBH growth, and feedback.
We find that the quasar host galaxy builds up rapidly through gas-rich major mergers, with star formation rates up to , reaching a stellar mass of at . The black holes grow through gas accretion under the Eddington limit in a self-regulated manner owing to their own feedback. As the galaxies merge, the black holes coalescence to form a dominant black hole, reaching a peak accretion rate of and a mass of at . Feedback from black hole accretion clears away the obscuring gas from the central regions, making the quasar optically visible from 7.5–6. At the peak of the quasar phase, the star formation rate, metallicity, black hole mass, as well as quasar luminosities of the simulated system are consistent with observations of J1148+5251.
Our results demonstrate that rare and luminous quasars at high redshifts can form in the standard CDM cosmology through hierarchical, gas-rich mergers, within the available cosmic time up to the early epoch of , without requiring exotic processes. Our model should also provide a viable formation mechanism for other distant, luminous quasars. Moreover, we predict that quasar hosts at high redshifts follow similar correlation observed locally as a result of the coeval evolution of the SMBHs and host galaxies. Better measurements of black hole masses and host properties with future observations will therefore be crucial to test our prediction. Furthermore, we predict that the progenitors of the distant quasars undergo strong and prolonged starbursts with rates at higher redshifts , that would contribute to the reionization of the Universe. Detecting these early galaxies and unveiling the epoch of reionization will be an important goal of current and future missions in observational cosmology.
References
- Abel et al. (2002) Abel, T., Bryan, G. L., & Norman, M. L. 2002, Science, 295, 93
- Abel et al. (2006) Abel, T., Wise, J. H., & Bryan, G. L. 2006, ArXiv Astrophysics e-prints
- Ajiki et al. (2002) Ajiki, M., Taniguchi, Y., Murayama, T., Nagao, T., Veilleux, S., Shioya, Y., Fujita, S. S., Kakazu, Y., Komiyama, Y., Okamura, S., Sanders, D. B., Oyabu, S., Kawara, K., Ohyama, Y., Iye, M., Kashikawa, N., Yoshida, M., Sasaki, T., Kosugi, G., Aoki, K., Takata, T., Saito, Y., Kawabata, K. S., Sekiguchi, K., Okita, K., Shimizu, Y., Inata, M., Ebizuka, N., Ozawa, T., Yadoumaru, Y., Taguchi, H., Ando, H., Nishimura, T., Hayashi, M., Ogasawara, R., & Ichikawa, S.-i. 2002, ApJ, 576, L25
- Alexander et al. (2005) Alexander, D. M., Smail, I., Bauer, F. E., Chapman, S. C., Blain, A. W., Brandt, W. N., & Ivison, R. J. 2005, Nature, 434, 738
- Bahcall et al. (1997) Bahcall, J. N., Kirhakos, S., Saxe, D. H., & Schneider, D. P. 1997, ApJ, 479, 642
- Baker et al. (2006) Baker, J. G., Centrella, J., Choi, D.-I., Koppitz, M., van Meter, J. R., & Miller, M. C. 2006, ApJ, 653, L93
- Barkana & Loeb (2001) Barkana, R., & Loeb, A. 2001, Phys. Rep., 349, 125
- Barnes & Hut (1986) Barnes, J., & Hut, P. 1986, Nature, 324, 446
- Barnes (2002) Barnes, J. E. 2002, MNRAS, 333, 481
- Barnes & Hernquist (1992) Barnes, J. E., & Hernquist, L. 1992, ARA&A, 30, 705
- Barnes & Hernquist (1996) —. 1996, ApJ, 471, 115
- Barnes & Hernquist (1991) Barnes, J. E., & Hernquist, L. E. 1991, ApJ, 370, L65
- Barth et al. (2003) Barth, A. J., Martini, P., Nelson, C. H., & Ho, L. C. 2003, ApJ, 594, L95
- Barton et al. (2004) Barton, E. J., Davé, R., Smith, J.-D. T., Papovich, C., Hernquist, L., & Springel, V. 2004, ApJ, 604, L1
- Becker et al. (2006) Becker, G. D., Sargent, W. L. W., Rauch, M., & Simcoe, R. A. 2006, ApJ, 640, 69
- Becker et al. (2001) Becker, R. H., Fan, X., White, R. L., Strauss, M. A., Narayanan, V. K., Lupton, R. H., Gunn, J. E., Annis, J., Bahcall, N. A., Brinkmann, J., Connolly, A. J., Csabai, I., Czarapata, P. C., Doi, M., Heckman, T. M., Hennessy, G. S., Ivezić, Ž., Knapp, G. R., Lamb, D. Q., McKay, T. A., Munn, J. A., Nash, T., Nichol, R., Pier, J. R., Richards, G. T., Schneider, D. P., Stoughton, C., Szalay, A. S., Thakar, A. R., & York, D. G. 2001, AJ, 122, 2850
- Beelen et al. (2006) Beelen, A., Cox, P., Benford, D. J., Dowell, C. D., Kovács, A., Bertoldi, F., Omont, A., & Carilli, C. L. 2006, ApJ, 642, 694
- Begelman et al. (1980) Begelman, M. C., Blandford, R. D., & Rees, M. J. 1980, Nature, 287, 307
- Begelman et al. (2006) Begelman, M. C., Volonteri, M., & Rees, M. J. 2006, MNRAS, 370, 289
- Bertoldi et al. (2003a) Bertoldi, F., Carilli, C. L., Cox, P., Fan, X., Strauss, M. A., Beelen, A., Omont, A., & Zylka, R. 2003a, A&A, 406, L55
- Bertoldi et al. (2003b) Bertoldi, F., Cox, P., Neri, R., Carilli, C. L., Walter, F., Omont, A., Beelen, A., Henkel, C., Fan, X., Strauss, M. A., & Menten, K. M. 2003b, A&A, 409, L47
- Binney & Tremaine (1987) Binney, J., & Tremaine, S. 1987, Galactic dynamics (Princeton, NJ, Princeton University Press, 1987, 747 p.)
- Blanchet et al. (2005) Blanchet, L., Qusailah, M. S. S., & Will, C. M. 2005, ApJ, 635, 508
- Bogdanovic et al. (2007) Bogdanovic, T., Reynolds, C. S., & Miller, M. C. 2007, astro-ph/0703054
- Bondi (1952) Bondi, H. 1952, MNRAS, 112, 195
- Bondi & Hoyle (1944) Bondi, H., & Hoyle, F. 1944, MNRAS, 104, 273
- Bonnor & Rotenberg (1961) Bonnor, W. B., & Rotenberg, M. A. 1961, Royal Society of London Proceedings Series A, 265, 109
- Borys et al. (2005) Borys, C., Smail, I., Chapman, S. C., Blain, A. W., Alexander, D. M., & Ivison, R. J. 2005, ApJ, 635, 853
- Bouwens et al. (2004) Bouwens, R. J., Illingworth, G. D., Thompson, R. I., Blakeslee, J. P., Dickinson, M. E., Broadhurst, T. J., Eisenstein, D. J., Fan, X., Franx, M., Meurer, G., & van Dokkum, P. 2004, ApJ, 606, L25
- Bouwens et al. (2005) Bouwens, R. J., Illingworth, G. D., Thompson, R. I., & Franx, M. 2005, ApJ, 624, L5
- Brinchmann et al. (2004) Brinchmann, J., Charlot, S., White, S. D. M., Tremonti, C., Kauffmann, G., Heckman, T., & Brinkmann, J. 2004, MNRAS, 351, 1151
- Bromm & Larson (2004) Bromm, V., & Larson, R. B. 2004, ARA&A, 42, 79
- Bromm & Loeb (2003) Bromm, V., & Loeb, A. 2003, ApJ, 596, 34
- Bruzual & Charlot (2003) Bruzual, G., & Charlot, S. 2003, MNRAS, 344, 1000
- Bullock et al. (2001) Bullock, J. S., Kolatt, T. S., Sigad, Y., Somerville, R. S., Kravtsov, A. V., Klypin, A. A., Primack, J. R., & Dekel, A. 2001, MNRAS, 321, 559
- Bunker et al. (2004) Bunker, A. J., Stanway, E. R., Ellis, R. S., & McMahon, R. G. 2004, MNRAS, 355, 374
- Campanelli et al. (2007) Campanelli, M., Lousto, C. O., Zlochower, Y., & Merritt, D. 2007, ApJ, in press, gr-qc/0701164
- Carilli et al. (2004) Carilli, C. L., Walter, F., Bertoldi, F., Menten, K. M., Fan, X., Lewis, G. F., Strauss, M. A., Cox, P., Beelen, A., Omont, A., & Mohan, N. 2004, AJ, 128, 997
- Carr et al. (1984) Carr, B. J., Bond, J. R., & Arnett, W. D. 1984, ApJ, 277, 445
- Chakrabarti et al. (2006) Chakrabarti, S., Cox, T. J., Hernquist, L., Hopkins, P. F., Robertson, B., & Di Matteo, T. 2006, astro-ph/0605652
- Charmandaris et al. (2004) Charmandaris, V., Uchida, K. I., Weedman, D., Herter, T., Houck, J. R., Teplitz, H. I., Armus, L., Brandl, B. R., Higdon, S. J. U., Soifer, B. T., Appleton, P. N., van Cleve, J., & Higdon, J. L. 2004, ApJS, 154, 142
- Conselice et al. (2003) Conselice, C. J., Bershady, M. A., Dickinson, M., & Papovich, C. 2003, AJ, 126, 1183
- Cox et al. (2006a) Cox, T. J., Chakrabarti, S., Di Matteo, T., Hernquist, L., Hopkins, P. F., Krause, E., Li, Y., Robertson, B., & Springel, V. 2006a, in preparation
- Cox et al. (2006b) Cox, T. J., Di Matteo, T., Hernquist, L., Hopkins, P. F., Robertson, B., & Springel, V. 2006b, ApJ, 643, 692
- Cox et al. (2006c) Cox, T. J., Dutta, S. N., Di Matteo, T., Hernquist, L., Hopkins, P. F., Robertson, B., & Springel, V. 2006c, ApJ, in press, astro-ph/0607446
- Damour & Gopakumar (2006) Damour, T., & Gopakumar, A. 2006, Phys. Rev. D, 73, 124006
- Dasyra et al. (2006) Dasyra, K. M., Tacconi, L. J., Davies, R. I., Genzel, R., Lutz, D., Naab, T., Burkert, A., Veilleux, S., & Sanders, D. B. 2006, ApJ, 638, 745
- Davé et al. (2006) Davé, R., Finlator, K., & Oppenheimer, B. D. 2006, MNRAS, 370, 273
- Davé et al. (1999) Davé, R., Hernquist, L., Katz, N., & Weinberg, D. H. 1999, ApJ, 511, 521
- Davis et al. (1985) Davis, M., Efstathiou, G., Frenk, C. S., & White, S. D. M. 1985, ApJ, 292, 371
- Di Matteo et al. (2005) Di Matteo, T., Springel, V., & Hernquist, L. 2005, Nature, 433, 604
- Dickinson et al. (2004) Dickinson, M., Stern, D., Giavalisco, M., Ferguson, H. C., Tsvetanov, Z., Chornock, R., Cristiani, S., Dawson, S., Dey, A., Filippenko, A. V., Moustakas, L. A., Nonino, M., Papovich, C., Ravindranath, S., Riess, A., Rosati, P., Spinrad, H., & Vanzella, E. 2004, ApJ, 600, L99
- Djorgovski et al. (2001) Djorgovski, S. G., Castro, S., Stern, D., & Mahabal, A. A. 2001, ApJ, 560, L5
- Dubinski (1998) Dubinski, J. 1998, ApJ, 502, 141
- Dwek (2006) Dwek, E. e. a. 2006, in preparation
- Efstathiou & Rees (1988) Efstathiou, G., & Rees, M. J. 1988, MNRAS, 230, 5P
- Egami et al. (2005) Egami, E., Kneib, J.-P., Rieke, G. H., Ellis, R. S., Richard, J., Rigby, J., Papovich, C., Stark, D., Santos, M. R., Huang, J.-S., Dole, H., Le Floc’h, E., & Pérez-González, P. G. 2005, ApJ, 618, L5
- Elvis et al. (1994) Elvis, M., Wilkes, B. J., McDowell, J. C., Green, R. F., Bechtold, J., Willner, S. P., Oey, M. S., Polomski, E., & Cutri, R. 1994, ApJS, 95, 1
- Escala et al. (2004) Escala, A., Larson, R. B., Coppi, P. S., & Mardones, D. 2004, ApJ, 607, 765
- Eyles et al. (2006) Eyles, L., Bunker, A., Ellis, R., Lacy, M., Stanway, E., Stark, D., & Chiu, K. 2006, astro-ph/0607306
- Eyles et al. (2005) Eyles, L. P., Bunker, A. J., Stanway, E. R., Lacy, M., Ellis, R. S., & Doherty, M. 2005, MNRAS, 364, 443
- Fabian (1999) Fabian, A. C. 1999, MNRAS, 308, L39
- Fan (2006) Fan, X. 2006, Memorie della Societa Astronomica Italiana, 77, 635
- Fan et al. (2006) Fan, X., Carilli, C. L., & Keating, B. 2006, ARA&A, 44, 415
- Fan et al. (2004) Fan, X., Hennawi, J. F., Richards, G. T., Strauss, M. A., Schneider, D. P., Donley, J. L., Young, J. E., Annis, J., Lin, H., Lampeitl, H., Lupton, R. H., Gunn, J. E., Knapp, G. R., Brandt, W. N., Anderson, S., Bahcall, N. A., Brinkmann, J., Brunner, R. J., Fukugita, M., Szalay, A. S., Szokoly, G. P., & York, D. G. 2004, AJ, 128, 515
- Fan et al. (2001) Fan, X., Narayanan, V. K., Lupton, R. H., Strauss, M. A., Knapp, G. R., Becker, R. H., White, R. L., Pentericci, L., Leggett, S. K., Haiman, Z., Gunn, J. E., Ivezić, Ž., Schneider, D. P., Anderson, S. F., Brinkmann, J., Bahcall, N. A., Connolly, A. J., Csabai, I., Doi, M., Fukugita, M., Geballe, T., Grebel, E. K., Harbeck, D., Hennessy, G., Lamb, D. Q., Miknaitis, G., Munn, J. A., Nichol, R., Okamura, S., Pier, J. R., Prada, F., Richards, G. T., Szalay, A., & York, D. G. 2001, AJ, 122, 2833
- Fan et al. (2003) Fan, X., Strauss, M. A., Schneider, D. P., Becker, R. H., White, R. L., Haiman, Z., Gregg, M., Pentericci, L., Grebel, E. K., Narayanan, V. K., Loh, Y.-S., Richards, G. T., Gunn, J. E., Lupton, R. H., Knapp, G. R., Ivezić, Ž., Brandt, W. N., Collinge, M., Hao, L., Harbeck, D., Prada, F., Schaye, J., Strateva, I., Zakamska, N., Anderson, S., Brinkmann, J., Bahcall, N. A., Lamb, D. Q., Okamura, S., Szalay, A., & York, D. G. 2003, AJ, 125, 1649
- Favata et al. (2004) Favata, M., Hughes, S. A., & Holz, D. E. 2004, ApJ, 607, L5
- Ferrarese & Merritt (2000) Ferrarese, L., & Merritt, D. 2000, ApJ, 539, L9
- Fitchett (1983) Fitchett, M. J. 1983, MNRAS, 203, 1049
- Flanagan & Hughes (1998) Flanagan, É. É., & Hughes, S. A. 1998, Phys. Rev. D, 57, 4535
- Folkner (1998) Folkner, W. M. 1998, in AIP Conf. Proc. 456: Laser Interferometer Space Antenna, Second International LISA Symposium on the Detection and Observation of Gravitational Waves in Space, ed. W. M. Folkner, 11–16
- Fryer et al. (2001) Fryer, C. L., Woosley, S. E., & Heger, A. 2001, ApJ, 550, 372
- Gao et al. (2006) Gao, L., Abel, T., Frenk, C. S., Jenkins, A., Springel, V., & Yoshida, N. 2006, astro-ph/0610174
- Gao et al. (2005) Gao, L., White, S. D. M., Jenkins, A., Frenk, C. S., & Springel, V. 2005, MNRAS, 363, 379
- Gebhardt et al. (2000) Gebhardt, K., Bender, R., Bower, G., Dressler, A., Faber, S. M., Filippenko, A. V., Green, R., Grillmair, C., Ho, L. C., Kormendy, J., Lauer, T. R., Magorrian, J., Pinkney, J., Richstone, D., & Tremaine, S. 2000, ApJ, 539, L13
- Giavalisco et al. (2004) Giavalisco, M., Dickinson, M., Ferguson, H. C., Ravindranath, S., Kretchmer, C., Moustakas, L. A., Madau, P., Fall, S. M., Gardner, J. P., Livio, M., Papovich, C., Renzini, A., Spinrad, H., Stern, D., & Riess, A. 2004, ApJ, 600, L103
- Glikman et al. (2006) Glikman, E., Helfand, D. J., & White, R. L. 2006, ApJ, 640, 579
- Gonzalez et al. (2007) Gonzalez, J. A., Hannam, M. D., Sperhake, U., Brugmann, B., & Husa, S. 2007, gr-qc/0702052
- Gonzalez et al. (2006) Gonzalez, J. A., Sperhake, U., Bruegmann, B., Hannam, M., & Husa, S. 2006, Physical Review Letters, in press, gr-qc/0610154
- Graham et al. (2001) Graham, A. W., Erwin, P., Caon, N., & Trujillo, I. 2001, ApJ, 563, L11
- Greene & Ho (2006) Greene, J. E., & Ho, L. C. 2006, ApJ, 641, L21
- Gunn & Peterson (1965) Gunn, J. E., & Peterson, B. A. 1965, ApJ, 142, 1633
- Haehnelt (1998) Haehnelt, M. G. 1998, in AIP Conf. Proc. 456: Laser Interferometer Space Antenna, Second International LISA Symposium on the Detection and Observation of Gravitational Waves in Space, ed. W. M. Folkner, 45–49
- Haehnelt et al. (1998) Haehnelt, M. G., Natarajan, P., & Rees, M. J. 1998, MNRAS, 300, 817
- Haiman (2004) Haiman, Z. 2004, ApJ, 613, 36
- Haiman (2006) —. 2006, New Astronomy Review, 50, 672
- Haiman & Loeb (2001) Haiman, Z., & Loeb, A. 2001, ApJ, 552, 459
- Heckman et al. (1984) Heckman, T. M., Bothun, G. D., Balick, B., & Smith, E. P. 1984, AJ, 89, 958
- Heckman et al. (2000) Heckman, T. M., Lehnert, M. D., Strickland, D. K., & Armus, L. 2000, ApJS, 129, 493
- Heger et al. (2003) Heger, A., Fryer, C. L., Woosley, S. E., Langer, N., & Hartmann, D. H. 2003, ApJ, 591, 288
- Hernquist (1989) Hernquist, L. 1989, Nature, 340, 687
- Hernquist (1990) —. 1990, ApJ, 356, 359
- Hernquist (1993) —. 1993, ApJS, 86, 389
- Hernquist & Katz (1989) Hernquist, L., & Katz, N. 1989, ApJS, 70, 419
- Hernquist & Mihos (1995) Hernquist, L., & Mihos, J. C. 1995, ApJ, 448, 41
- Hernquist & Springel (2003) Hernquist, L., & Springel, V. 2003, MNRAS, 341, 1253
- Herrmann et al. (2007) Herrmann, F., Hinder, I., Shoemaker, D., Laguna, P., & Matzner, R. A. 2007, ApJ, in press, gr-qc/0701143
- Herrmann et al. (2006) Herrmann, F., Shoemaker, D., & Laguna, P. 2006, ArXiv General Relativity and Quantum Cosmology e-prints
- Hines et al. (2006) Hines, D. C., Krause, O., Rieke, G. H., Fan, X., Blaylock, M., & Neugebauer, G. 2006, ApJ, 641, L85
- Hockney & Eastwood (1981) Hockney, R. W., & Eastwood, J. W. 1981, Computer Simulation Using Particles (Computer Simulation Using Particles, New York: McGraw-Hill, 1981)
- Hopkins & Hernquist (2006) Hopkins, P. F., & Hernquist, L. 2006, ApJS, in press, astro-ph/0603180
- Hopkins et al. (2005a) Hopkins, P. F., Hernquist, L., Cox, T. J., Di Matteo, T., Martini, P., Robertson, B., & Springel, V. 2005a, ApJ, 630, 705
- Hopkins et al. (2005b) Hopkins, P. F., Hernquist, L., Cox, T. J., Di Matteo, T., Robertson, B., & Springel, V. 2005b, ApJ, 630, 716
- Hopkins et al. (2005c) —. 2005c, ApJ, 632, 81
- Hopkins et al. (2006a) —. 2006a, ApJS, 163, 1
- Hopkins et al. (2006b) Hopkins, P. F., Hernquist, L., Cox, T. J., Robertson, B., Di Matteo, T., & Springel, V. 2006b, ApJ, 639, 700
- Hopkins et al. (2007) Hopkins, P. F., Hernquist, L., Cox, T. J., Robertson, B., & Krause, E. 2007, ArXiv Astrophysics e-prints
- Hopkins et al. (2006c) Hopkins, P. F., Hernquist, L., Cox, T. J., Robertson, B., & Springel, V. 2006c, ApJS, 163, 50
- Hopkins et al. (2005d) Hopkins, P. F., Hernquist, L., Martini, P., Cox, T. J., Robertson, B., Di Matteo, T., & Springel, V. 2005d, ApJ, 625, L71
- Hopkins et al. (2006d) Hopkins, P. F., Richards, G. T., & Hernquist, L. 2006d, ApJ, submitted, astro-ph/0605678
- Hopkins et al. (2006e) Hopkins, P. F., Somerville, R. S., Hernquist, L., Cox, T. J., Robertson, B., & Li, Y. 2006e, ApJ, submitted, astro-ph/0602290
- Horton et al. (2004) Horton, A., Parry, I., Bland-Hawthorn, J., Cianci, S., King, D., McMahon, R., & Medlen, S. 2004, in Ground-based Instrumentation for Astronomy. Edited by Alan F. M. Moorwood and Iye Masanori. Proceedings of the SPIE, Volume 5492, pp. 1022-1032 (2004)., ed. A. F. M. Moorwood & M. Iye, 1022–1032
- Hoyle & Lyttleton (1941) Hoyle, F., & Lyttleton, R. A. 1941, MNRAS, 101, 227
- Hu & Cowie (2006) Hu, E. M., & Cowie, L. L. 2006, Nature, 440, 1145
- Hu et al. (2002) Hu, E. M., Cowie, L. L., McMahon, R. G., Capak, P., Iwamuro, F., Kneib, J.-P., Maihara, T., & Motohara, K. 2002, ApJ, 568, L75
- Hughes (2002) Hughes, S. A. 2002, MNRAS, 331, 805
- Hutchings (2005) Hutchings, J. B. 2005, PASP, 117, 1250
- Hutchings & Neff (1992) Hutchings, J. B., & Neff, S. G. 1992, AJ, 104, 1
- Jenkins et al. (2001) Jenkins, A., Frenk, C. S., White, S. D. M., Colberg, J. M., Cole, S., Evrard, A. E., Couchman, H. M. P., & Yoshida, N. 2001, MNRAS, 321, 372
- Jiang et al. (2006) Jiang, L., Fan, X., Hines, D. C., Shi, Y., Vestergaard, M., Bertoldi, F., Brandt, W. N., Carilli, C. L., Cox, P., Le Floc’h, E., Pentericci, L., Richards, G. T., Rieke, G. H., Schneider, D. P., Strauss, M. A., Walter, F., & Brinkmann, J. 2006, AJ, in press, astro-ph/0608006
- Jogee (2006) Jogee, S. 2006, in Physics of Active Galactic Nuclei at all Scales, ed. D. Alloin, R. Johnson, and P. Lira (Berlin: Springer), 143
- Johnson & Bromm (2006) Johnson, J. L., & Bromm, V. 2006, MNRAS, in press, astro-ph/0605691
- Katz et al. (1996) Katz, N., Weinberg, D. H., & Hernquist, L. 1996, ApJS, 105, 19
- Kazantzidis et al. (2005) Kazantzidis, S., Mayer, L., Colpi, M., Madau, P., Debattista, V. P., Wadsley, J., Stadel, J., Quinn, T., & Moore, B. 2005, ApJ, 623, L67
- Kennicutt (1998) Kennicutt, R. C. 1998, ApJ, 498, 541
- Khochfar & Burkert (2006) Khochfar, S., & Burkert, A. 2006, A&A, 445, 403
- King (2003) King, A. 2003, ApJ, 596, L27
- Kollmeier et al. (2005) Kollmeier, J. A., Onken, C. A., Kochanek, C. S., Gould, A., Weinberg, D. H., Dietrich, M., Cool, R., Dey, A., Eisenstein, D. J., Jannuzi, B. T., Le Floc’h, E., & Stern, D. 2005, ApJ, in press, astro-ph/0508657
- Koushiappas & Zentner (2006) Koushiappas, S. M., & Zentner, A. R. 2006, ApJ, 639, 7
- Lacey & Cole (1993) Lacey, C., & Cole, S. 1993, MNRAS, 262, 627
- Li (2007) Li, Y. 2007, in preparation
- Li et al. (2006a) Li, Y., Haiman, Z., & Mac Low, M.-M. 2006a, ApJ, submitted, astro-ph/0607444
- Li et al. (2007) Li, Y., Hernquist, L., Finkbeiner, D., Fan, X., & Jiang, L. 2007, in preparation
- Li et al. (2004) Li, Y., Mac Low, M.-M., & Klessen, R. S. 2004, ApJ, 614, L29
- Li et al. (2005) —. 2005, ApJ, 620, L19
- Li et al. (2006b) —. 2006b, ApJ, 639, 879
- Lidz et al. (2002) Lidz, A., Hui, L., Zaldarriaga, M., & Scoccimarro, R. 2002, ApJ, 579, 491
- Loeb & Barkana (2001) Loeb, A., & Barkana, R. 2001, ARA&A, 39, 19
- Loeb & Rasio (1994) Loeb, A., & Rasio, F. A. 1994, ApJ, 432, 52
- Lynden-Bell (1969) Lynden-Bell, D. 1969, Nature, 223, 690
- Madau et al. (1996) Madau, P., Ferguson, H. C., Dickinson, M. E., Giavalisco, M., Steidel, C. C., & Fruchter, A. 1996, MNRAS, 283, 1388
- Madau & Quataert (2004) Madau, P., & Quataert, E. 2004, ApJ, 606, L17
- Magorrian et al. (1998) Magorrian, J., Tremaine, S., Richstone, D., Bender, R., Bower, G., Dressler, A., Faber, S. M., Gebhardt, K., Green, R., Grillmair, C., Kormendy, J., & Lauer, T. 1998, AJ, 115, 2285
- Maiolino et al. (2005) Maiolino, R., Cox, P., Caselli, P., Beelen, A., Bertoldi, F., Carilli, C. L., Kaufman, M. J., Menten, K. M., Nagao, T., Omont, A., Weiß, A., Walmsley, C. M., & Walter, F. 2005, A&A, 440, L51
- Malhotra & Rhoads (2004) Malhotra, S., & Rhoads, J. E. 2004, ApJ, 617, L5
- Marconi & Hunt (2003) Marconi, A., & Hunt, L. K. 2003, ApJ, 589, L21
- Marconi et al. (2004) Marconi, A., Risaliti, G., Gilli, R., Hunt, L. K., Maiolino, R., & Salvati, M. 2004, MNRAS, 351, 169
- Martin (1999) Martin, C. L. 1999, ApJ, 513, 156
- Martin (2005) —. 2005, ApJ, 621, 227
- Menou et al. (2001) Menou, K., Haiman, Z., & Narayanan, V. K. 2001, ApJ, 558, 535
- Merritt et al. (2004) Merritt, D., Milosavljević, M., Favata, M., Hughes, S. A., & Holz, D. E. 2004, ApJ, 607, L9
- Meurer et al. (1997) Meurer, G. R., Heckman, T. M., Lehnert, M. D., Leitherer, C., & Lowenthal, J. 1997, AJ, 114, 54
- Mihos & Hernquist (1994) Mihos, J. C., & Hernquist, L. 1994, ApJ, 425, L13
- Mihos & Hernquist (1996) —. 1996, ApJ, 464, 641
- Milosavljević & Merritt (2003) Milosavljević, M., & Merritt, D. 2003, ApJ, 596, 860
- Mo et al. (1998) Mo, H. J., Mao, S., & White, S. D. M. 1998, MNRAS, 295, 319
- Mobasher et al. (2005) Mobasher, B., Dickinson, M., Ferguson, H. C., Giavalisco, M., Wiklind, T., Stark, D., Ellis, R. S., Fall, S. M., Grogin, N. A., Moustakas, L. A., Panagia, N., Sosey, M., Stiavelli, M., Bergeron, E., Casertano, S., Ingraham, P., Koekemoer, A., Labbé, I., Livio, M., Rodgers, B., Scarlata, C., Vernet, J., Renzini, A., Rosati, P., Kuntschner, H., Kümmel, M., Walsh, J. R., Chary, R., Eisenhardt, P., Pirzkal, N., & Stern, D. 2005, ApJ, 635, 832
- Murray et al. (2005) Murray, N., Quataert, E., & Thompson, T. A. 2005, ApJ, 618, 569
- Naab & Burkert (2003) Naab, T., & Burkert, A. 2003, ApJ, 597, 893
- Narayanan et al. (2006a) Narayanan, D., Cox, T. J., Robertson, B., Davé, R., Di Matteo, T., Hernquist, L., Hopkins, P., Kulesa, C., & Walker, C. K. 2006a, ApJ, 642, L107
- Narayanan et al. (2006b) Narayanan, D., Kulesa, C., Boss, A., & Walker, C. K. 2006b, ApJ, 647
- Narayanan et al. (2006c) Narayanan, D., Li, Y., Cox, T. J., Hernquist, L., , Hopkins, P., Chakrabarti, S., Davé, R., Di Matteo, T., Kulesa, C., Robertson, B., Springel, V., & Walker, C. K. 2006c, ApJ, submitted
- Navarro et al. (1997) Navarro, J. F., Frenk, C. S., & White, S. D. M. 1997, ApJ, 490, 493
- Norman & Scoville (1988) Norman, C., & Scoville, N. 1988, ApJ, 332, 124
- Page et al. (2006) Page, L., Hinshaw, G., Komatsu, E., Nolta, M. R., Spergel, D. N., Bennett, C. L., Barnes, C., Bean, R., Dore’, O., Halpern, M., Hill, R. S., Jarosik, N., Kogut, A., Limon, M., Meyer, S. S., Odegard, N., Peiris, H. V., Tucker, G. S., Verde, L., Weiland, J. L., Wollack, E., & Wright, E. L. 2006, astro-ph/0603450
- Peng et al. (2006) Peng, C. Y., Impey, C. D., Ho, L. C., Barton, E. J., & Rix, H.-W. 2006, ApJ, 640, 114
- Peres (1962) Peres, A. 1962, Physical Review, 128, 2471
- Pettini et al. (2002) Pettini, M., Rix, S. A., Steidel, C. C., Adelberger, K. L., Hunt, M. P., & Shapley, A. E. 2002, ApJ, 569, 742
- Power et al. (2003) Power, C., Navarro, J. F., Jenkins, A., Frenk, C. S., White, S. D. M., Springel, V., Stadel, J., & Quinn, T. 2003, MNRAS, 338, 14
- Press & Schechter (1974) Press, W. H., & Schechter, P. 1974, ApJ, 187, 425
- Richards et al. (2006) Richards, G. T., Lacy, M., Storrie-Lombardi, L. J., Hall, P. B., Gallagher, S. C., Hines, D. C., Fan, X., Papovich, C., Vanden Berk, D. E., Trammell, G. B., Schneider, D. P., Vestergaard, M., York, D. G., Jester, S., Anderson, S. F., Budavari, T., & Szalay, A. S. 2006, astro-ph/0601558
- Robertson et al. (2006a) Robertson, B., Cox, T. J., Hernquist, L., Franx, M., Hopkins, P. F., Martini, P., & Springel, V. 2006a, ApJ, 641, 21
- Robertson et al. (2006b) Robertson, B., Hernquist, L., Cox, T. J., Di Matteo, T., Hopkins, P. F., Martini, P., & Springel, V. 2006b, ApJ, 641, 90
- Robertson et al. (2004) Robertson, B., Yoshida, N., Springel, V., & Hernquist, L. 2004, ApJ, 606, 32
- Robson et al. (2004) Robson, I., Priddey, R. S., Isaak, K. G., & McMahon, R. G. 2004, MNRAS, 351, L29
- Rupke et al. (2002) Rupke, D. S., Veilleux, S., & Sanders, D. B. 2002, ApJ, 570, 588
- Rupke et al. (2005) —. 2005, ApJ, 632, 751
- Salpeter (1964) Salpeter, E. E. 1964, ApJ, 140, 796
- Sanders & Mirabel (1996) Sanders, D. B., & Mirabel, I. F. 1996, ARA&A, 34, 749
- Sanders et al. (1988) Sanders, D. B., Soifer, B. T., Elias, J. H., Madore, B. F., Matthews, K., Neugebauer, G., & Scoville, N. Z. 1988, ApJ, 325, 74
- Sazonov et al. (2005) Sazonov, S. Y., Ostriker, J. P., Ciotti, L., & Sunyaev, R. A. 2005, MNRAS, 358, 168
- Schechter (1976) Schechter, P. 1976, ApJ, 203, 297
- Schmidt (1959) Schmidt, M. 1959, ApJ, 129, 243
- Scoville (2003) Scoville, N. 2003, Journal of Korean Astronomical Society, 36, 167
- Scoville et al. (2000) Scoville, N. Z., Evans, A. S., Thompson, R., Rieke, M., Hines, D. C., Low, F. J., Dinshaw, N., Surace, J. A., & Armus, L. 2000, AJ, 119, 991
- Seljak & Zaldarriaga (1996) Seljak, U., & Zaldarriaga, M. 1996, ApJ, 469, 437
- Sesana et al. (2005) Sesana, A., Haardt, F., Madau, P., & Volonteri, M. 2005, ApJ, 623, 23
- Shakura & Sunyaev (1973) Shakura, N. I., & Sunyaev, R. A. 1973, A&A, 24, 337
- Shapley et al. (2003) Shapley, A. E., Steidel, C. C., Pettini, M., & Adelberger, K. L. 2003, ApJ, 588, 65
- Shaver et al. (1996) Shaver, P. A., Wall, J. V., Kellermann, K. I., Jackson, C. A., & Hawkins, M. R. S. 1996, Nature, 384, 439
- Sheth & Tormen (2002) Sheth, R. K., & Tormen, G. 2002, MNRAS, 329, 61
- Shields et al. (2003) Shields, G. A., Gebhardt, K., Salviander, S., Wills, B. J., Xie, B., Brotherton, M. S., Yuan, J., & Dietrich, M. 2003, ApJ, 583, 124
- Shields et al. (2006) Shields, G. A., Menezes, K. L., Massart, C. A., & Vanden Bout, P. 2006, ApJ, 641, 683
- Silk & Rees (1998) Silk, J., & Rees, M. J. 1998, A&A, 331, L1
- Sokasian et al. (2003) Sokasian, A., Abel, T., Hernquist, L., & Springel, V. 2003, MNRAS, 344, 607
- Somerville et al. (2001) Somerville, R. S., Primack, J. R., & Faber, S. M. 2001, MNRAS, 320, 504
- Songaila & Cowie (2002) Songaila, A., & Cowie, L. L. 2002, AJ, 123, 2183
- Spergel et al. (2006) Spergel, D. N., Bean, R., Dore’, O., Nolta, M. R., Bennett, C. L., Hinshaw, G., Jarosik, N., Komatsu, E., Page, L., Peiris, H. V., Verde, L., Barnes, C., Halpern, M., Hill, R. S., Kogut, A., Limon, M., Meyer, S. S., Odegard, N., Tucker, G. S., Weiland, J. L., Wollack, E., & Wright, E. L. 2006, astro-ph/0603449
- Spergel et al. (2003) Spergel, D. N., Verde, L., Peiris, H. V., Komatsu, E., Nolta, M. R., Bennett, C. L., Halpern, M., Hinshaw, G., Jarosik, N., Kogut, A., Limon, M., Meyer, S. S., Page, L., Tucker, G. S., Weiland, J. L., Wollack, E., & Wright, E. L. 2003, ApJS, 148, 175
- Springel (2000) Springel, V. 2000, MNRAS, 312, 859
- Springel (2005) —. 2005, MNRAS, 364, 1105
- Springel et al. (2005a) Springel, V., Di Matteo, T., & Hernquist, L. 2005a, ApJ, 620, L79
- Springel et al. (2005b) —. 2005b, MNRAS, 361, 776
- Springel et al. (2006) Springel, V., Frenk, C. S., & White, S. D. M. 2006, Nature, 440, 1137
- Springel & Hernquist (2002) Springel, V., & Hernquist, L. 2002, MNRAS, 333, 649
- Springel & Hernquist (2003a) —. 2003a, MNRAS, 339, 289
- Springel & Hernquist (2003b) —. 2003b, MNRAS, 339, 312
- Springel & Hernquist (2005) —. 2005, ApJ, 622, L9
- Springel & White (1999) Springel, V., & White, S. D. M. 1999, MNRAS, 307, 162
- Springel et al. (2005c) Springel, V., White, S. D. M., Jenkins, A., Frenk, C. S., Yoshida, N., Gao, L., Navarro, J., Thacker, R., Croton, D., Helly, J., Peacock, J. A., Cole, S., Thomas, P., Couchman, H., Evrard, A., Colberg, J., & Pearce, F. 2005c, Nature, 435, 629
- Stern et al. (2005) Stern, D., Yost, S. A., Eckart, M. E., Harrison, F. A., Helfand, D. J., Djorgovski, S. G., Malhotra, S., & Rhoads, J. E. 2005, ApJ, 619, 12
- Stockton (1978) Stockton, A. 1978, ApJ, 223, 747
- Tan & McKee (2004) Tan, J. C., & McKee, C. F. 2004, ApJ, 603, 383
- Thompson et al. (2005) Thompson, T. A., Quataert, E., & Murray, N. 2005, ApJ, 630, 167
- Thorne & Braginskii (1976) Thorne, K. S., & Braginskii, V. B. 1976, ApJ, 204, L1
- Tremaine et al. (2002) Tremaine, S., Gebhardt, K., Bender, R., Bower, G., Dressler, A., Faber, S. M., Filippenko, A. V., Green, R., Grillmair, C., Ho, L. C., Kormendy, J., Lauer, T. R., Magorrian, J., Pinkney, J., & Richstone, D. 2002, ApJ, 574, 740
- Treu et al. (2004) Treu, T., Malkan, M. A., & Blandford, R. D. 2004, ApJ, 615, L97
- Veilleux et al. (2005) Veilleux, S., Cecil, G., & Bland-Hawthorn, J. 2005, ARA&A, 43, 769
- Veilleux et al. (2002) Veilleux, S., Kim, D.-C., & Sanders, D. B. 2002, ApJS, 143, 315
- Vestergaard (2004) Vestergaard, M. 2004, ApJ, 601, 676
- Vestergaard & Fan (2006) Vestergaard, M., & Fan, X. 2006, in preparation
- Vestergaard & Peterson (2006) Vestergaard, M., & Peterson, B. M. 2006, ApJ, 641, 689
- Volonteri & Rees (2005) Volonteri, M., & Rees, M. J. 2005, ApJ, 633, 624
- Volonteri & Rees (2006) —. 2006, ApJ, 650, 669
- Walter et al. (2003) Walter, F., Bertoldi, F., Carilli, C., Cox, P., Lo, K. Y., Neri, R., Fan, X., Omont, A., Strauss, M. A., & Menten, K. M. 2003, Nature, 424, 406
- Walter et al. (2004) Walter, F., Carilli, C., Bertoldi, F., Menten, K., Cox, P., Lo, K. Y., Fan, X., & Strauss, M. A. 2004, ApJ, 615, L17
- White et al. (2003) White, R. L., Becker, R. H., Fan, X., & Strauss, M. A. 2003, AJ, 126, 1
- White et al. (2005) —. 2005, AJ, 129, 2102
- Willott et al. (2003) Willott, C. J., McLure, R. J., & Jarvis, M. J. 2003, ApJ, 587, L15
- Willott et al. (2005) Willott, C. J., Percival, W. J., McLure, R. J., Crampton, D., Hutchings, J. B., Jarvis, M. J., Sawicki, M., & Simard, L. 2005, ApJ, 626, 657
- Windhorst et al. (2006) Windhorst, R. A., Cohen, S. H., Jansen, R. A., Conselice, C., & Yan, H. 2006, New Astronomy Review, 50, 113
- Wu (2006) Wu, X.-B. 2006, ApJ, in press, 11415
- Wyithe & Loeb (2003) Wyithe, J. S. B., & Loeb, A. 2003, ApJ, 595, 614
- Wyithe & Loeb (2005) —. 2005, ApJ, 634, 910
- Xu (1995) Xu, G. 1995, ApJS, 98, 355
- Yan et al. (2006) Yan, H., Dickinson, M., Giavalisco, M., Stern, D., Eisenhardt, P. R. M., & Ferguson, H. C. 2006, astro-ph/0604554
- Yan et al. (2005) Yan, H., Dickinson, M., Stern, D., Eisenhardt, P. R. M., Chary, R.-R., Giavalisco, M., Ferguson, H. C., Casertano, S., Conselice, C. J., Papovich, C., Reach, W. T., Grogin, N., Moustakas, L. A., & Ouchi, M. 2005, ApJ, 634, 109
- Yoo & Miralda-Escudé (2004) Yoo, J., & Miralda-Escudé, J. 2004, ApJ, 614, L25
- York et al. (2000) York, D. G., Adelman, J., & Anderson, Jr., J. E. e. a. 2000, AJ, 120, 1579
- Yoshida et al. (2007) Yoshida, N., Oh, S. P., Kitayama, T., & Hernquist, L. 2007, ApJ, submitted, astro-ph/0610819
- Yoshida et al. (2006) Yoshida, N., Omukai, K., Hernquist, L., & Abel, T. 2006, ApJ, 652, 6