Long-term evolution of accretion discs in Be/X-ray binaries
Abstract
We numerically study the long-term evolution of the accretion disc around the neutron star in a coplanar Be/X-ray binary with a short period and a moderate eccentricity. From three dimensional Smoothed Particle Hydrodynamics simulations, we find that the disc evolves through three distinct phases, each characterized by different mass accretion patterns. In the first ”developing phase”, the disc is formed and develops towards a nearly Keplerian disc. It has a relatively large, double-peaked mass-accretion rate with the higher peak by the direct accretion at periastron, which is followed by the lower peak by the accretion induced by a one-armed spiral wave. In the second ”transition phase”, the disc is approximately Keplerian and grows with time. The mass-accretion rate increases as the disc grows. In the second phase, there is a transition in the mass accretion rate from a double peaked to a single peaked pattern. In the final quasi-steady state, the mass-accretion rate is on average balanced with the mass-transfer rate from the Be disc and exhibits a regular orbital modulation. In the quasi-steady state, the mass-accretion rate has a single peak by the wave-induced accretion as in a later stage of the transition phase. The orbital modulation of X-ray maxima could provide not only a circumstantial evidence for the persistent disc but also an observational diagnosis of the disc evolutionary state.
keywords:
accretion, accretion discs – hydrodynamics – methods: numerical – binaries: general – stars: emission-line, Be – X-rays: binaries1 Introduction
The Be/X-ray binaries comprise the largest subclass of high-mass X-ray binaries (HMXBs). About two-thirds of the identified systems fall into this category. These systems consist of, generally, a neutron star and a Be star with a cool () equatorial disc, which is geometrically thin and nearly Keplerian. These systems are distributed over a wide range of orbital periods and eccentricities .
Most of the Be/X-ray binaries show only transient activity in the X-ray emission and are termed Be/X-ray transients. Be/X-ray transients show periodical (Type I) outbursts, which are separated by the orbital period and have the luminosity of , and giant (Type II) outbursts of with no orbital modulation. These X-ray outbursts are basically considered to result from the accretion onto the neutron star from the Be disc.
Recently, Hayasaki & Okazaki (2004) (hereafter, Paper I) studied the accretion flow around the neutron star in Be/X-ray binaries, performing three-dimensional (3D) smoothed particle hydrodynamics (SPH) simulations (Benz 1990; Bate, Bonnell & Price 1995), in the framework of the interaction between the Be disc and the neutron star (Okazaki et al. 2002). They found that the time-dependent accretion disc is formed around the neutron star. Hayasaki & Okazaki (2005) (hereafter, Paper II) further showed that the disc has a one-armed spiral structure induced by a phase-dependent mass transfer from the Be disc. The one-armed mode is excited and then damped every orbit, which make an enhancement in the X-ray luminosity. These are, however, the results from simulations run over a period shorter than the viscous time-scale of the disc, and it was not known how the accretion disc would evolve over a period longer than the viscous time-scale.
In this paper, we study the long-term evolution of the accretion disc around the neutron star in Be/X-ray binaries, using a 3D SPH code. The simulations are performed using the basically the same method as in paper I. We describe our numerical results in Sections 2 and 3, and discuss the disc evolution and its observational implications in Section 4. Section 5 summarizes our conclusions.
| Model | Polytropic exponent | Inner boundary | ||
|---|---|---|---|---|
| (final) | ||||
| 1 | ||||
| 2 | ||||
| 3 |
2 Disc structure
We have carried out simulations by using the same computer code as in papers I and II. In our code, the neutron star is modeled by a sink particle with a fixed accretion radius , while the accretion disc is modeled by an ensemble of non-selfgravitating gas particles. As in papers I and II, our simulations are for a coplanar system with a short period () and a moderate eccentricity , the parameters of which are for 4U 0115+63, one of the best studied Be/X-ray binaries. The phase-dependent, mass-transfer rate from the Be disc is emulated by injecting gas particles, based on the result from a high resolution SPH simulation for the same binary configuration (Okazaki et al., 2002). The SPH particles are assumed to have the initial temperature of half the effective temperature of the Be star and follow a polytropic equation of state specified by the exponent .
We consider the case (model 1) as well as the adiabatic case (model 2) and the isothermal case (model 3) as two extreme cases. Models 1-3 in this paper correspond to models 1, 3 and 4 in paper I, respectively. The injection rate of the SPH particles in each model is three times as low as in corresponding simulation in paper I in order to make the computing time bearable. In models 1 and 2, we adopt , where is the semi-major axis of the binary. In model 3, however, a larger accretion radius of is adopted, in order to reduce an artificial effect of the inner simulation boundary. All models have the Shakura-Sunyaev viscosity parameter and are run for , which is twice, 10 times and 5 times as long as the viscous time-scale at the disc outer radius in models 1, 2 and 3, respectively (see Section 3.3). The number of neighbor particles is always kept to about 50 particles throughout our simulations Details of the models are given in Table 1. Throughout this paper, the unit of time is , unless noted otherwise.
We perform three dimensional (3D) simulations, despite that they have less radial resolution than two dimensional (2D) simulations do with the same particle number. 3D calculations have an advantage even for a geometrically thin disc in a coplanar binary. They enable us to evaluate more accurately the effect of the one-armed wave excited by the impulsive mass transfer from the Be disc than 2D calculations do. As we will see in later sections, the one-armed wave plays an important role in the long-term evolution of the accretion disc. 2D simulations would have artificially enhanced wave amplitude because of the lack of vertical structure (e.g., Ogilvie (2001)).
In this section, we show the azimuthally averaged structures, the non-axisymmetric structures and the vertical structures of the fully developed discs during the last one orbital period .
2.1 Azimuthally averaged disc structure
Fig. 1 shows the radial structure of the accretion disc around the neutron star at apastron (). In each panel, the thick solid line, the dashed line and the thin solid line denote the surface density , the azimuthal velocity normalized by the Keplarian velocity at the inner boundary and the radial Mach number , respectively. In the figure, the velocity components are averaged vertically and azimuthally, while the density is integrated vertically and averaged azimuthally, where is highest local density in the Be-star disc normalized by , a typical value for Be stars. It is noted from Fig. 1 that the disc is nearly Keplerian and the radial velocity component of the disc is highly subsonic in each model. It is also noted that the surface density in model 2 (adiabatic case) is the lowest because of the highest viscous stress due to the highest pressure.
Fig. 2 denotes the radial structures of the disc temperature , the ratio of the smoothing length to the disc thickness and the ratio of the disc thickness to the radius at in models 1-3. In each panel, the solid line, the dashed-dotted line and the dashed line denote the disc temperature normalized by , which is the initial temperature of injected particles, the ratio of the smoothing length to the disc thickness and the ratio of the disc thickness to the radius , respectively. Here the disc thickness is determined from the vertical distribution of the SPH particles by comparison with the analytical density distribution of a geometrically thin disc. The vertical disc structure and the procedure to determine from the particle distribution will be given in Section 2.3. It is noted from the figure that the disc is fully resolved in the radial direction and is also resolved in the vertical direction except in the innermost region of the disc.
In our simulations, the presence of the inner simulation boundary causes an artificial decrease in the density near the boundary, because the gas particles which pass through the boundary are removed from the simulation. As a result, the density distribution has a break near the inner boundary, as seen in Fig. 1. We have found that our simulations are reliable for .


2.2 Non-axisymmetric disc structure
It was found by paper II that an accretion disc around the neutron star in Be/X-ray binaries has a one-armed spiral structure induced by a phase-dependent mass transfer from the Be disc to the neutron star. In this subsection, we show the non-axisymmetric structure of the accretion disc for models 1-3.
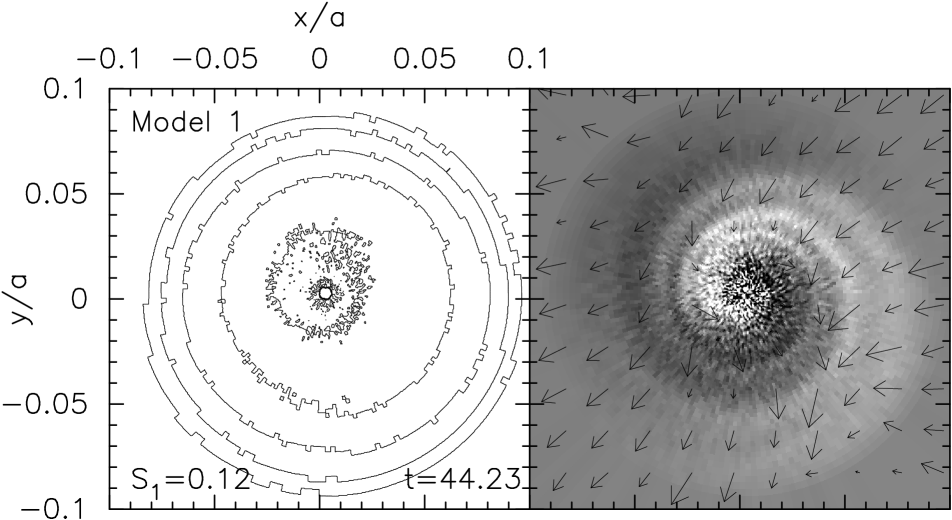
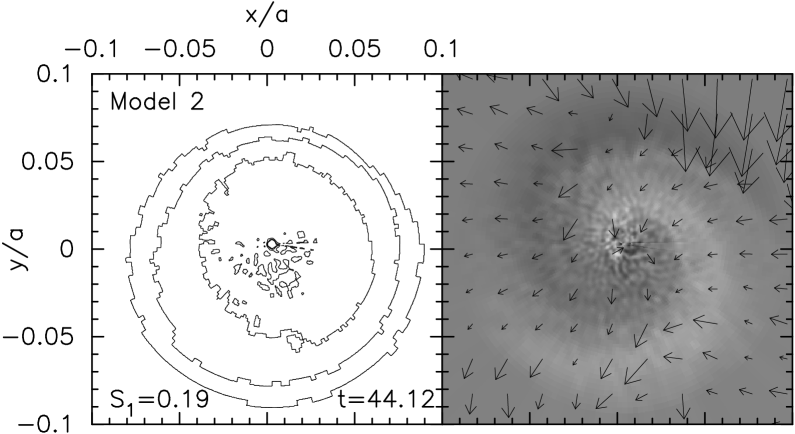
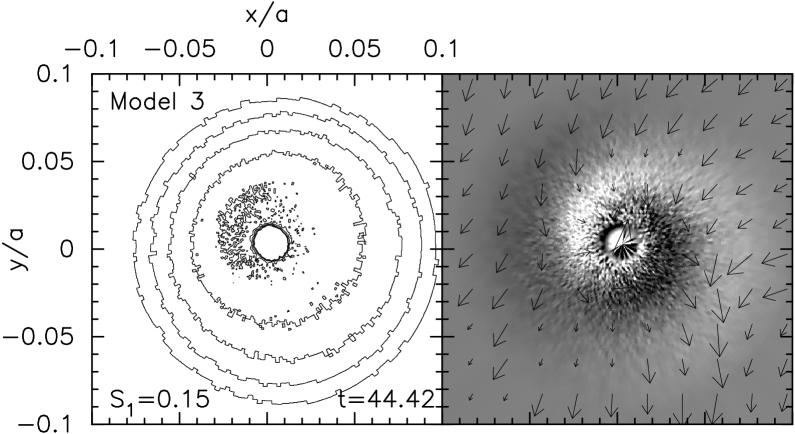
Fig 4 gives snapshots of the accretion disc around the neutron star at in model 1, at in model 2 and at in model 3, respectively. Each time is chosen such that the strength of the one-armed mode takes a maximum over the period of . The left panels show the contour maps of the surface density, whereas the non-axisymmetric components of the surface density and the velocity field are shown in the right panels. Annotated in each left panel are the time in units of and the amplitude of the one-armed wave , details of which will be described later. It is noted from the figure that the disc has a one-armed spiral structure regardless of the simulation parameters, even after the disc fully evolves. The figure also suggests that the strength of one-armed mode correlates inversely with the surface density.
2.3 Vertical disc structure
In this subsection, we compare the vertical distribution of SPH particles with the analytical density distribution of a geometrically thin disc. The vertical structure of such a disk is characterized by the disc scale-height () or thickness (). In an isothermal disc, the vertical scale-height is analytically given by
| (1) |
whereas the disc thickness with the polytropic equation of state is defined by
| (2) |
where is the sound speed, is the Keplerian frequency, is the central density of the disc and is the polytropic constant.
Fig. 3 shows the SPH particle distributions in the vertical direction in models 1-3. In each panel, the solid line and the dashed line denote the number of particles normalized by the number of particles at the disc mid-plane and the corresponding analytical distributions with given by equations (1) or (2).
It is noted from the figure that the distributions of particles are slightly broader than those of analytical distributions except for model 3 (isothermal disc). The ratio of the disc thickness obtained by the particle distribution to the disc scale-hight or thickness by analytical ones is 1.12 in model 1, 1.32 in model 2 and 1.03 in model 3. The reason why the isothermal model has a better fit than models with do is that the scale-height of the isothermal disc depends only on the temperature, while models with depend on the density, which has a numerical error. In any case, discs in our simulations are vertically resolved except in the innermost region.
3 Disc evolution
By analysing the multi-wavelength long term monitoring observations of 4 U0115+63, Negueruela et al. (2001) found that the Be star shows a quasi-cyclic activity () due to the loss and reformation of its circumsteller disc. When the Be disc is lost, the mass-supply to the neutron star also has to halt. Since we have little knowledge on the mechanism that triggers the Be-disc loss episode, we have restricted our simulations for .
In the first two subsections below, we will describe the evolution of the mass-accretion rate and the strength of modes for models 1-3. Then, we will show the evolution of the mass, radius and viscous time-scale of the accretion disc for these models.
3.1 Mass accretion rate
Fig. 5 shows the evolution of the mass-accretion rate and the corresponding X-ray luminosity in models 1-3 for . In each panel, the solid line and the dashed line denote the mass-accretion rate and the mean mass-transfer rate , respectively, where is . in models 1, 2 and 3 are shown in the top panel, the middle panel and the bottom panel, respectively.
In model 1 (top panel), the mass accretion rate has double peaks per orbit at an initial developing phase . While the first peak is due to the direct accretion of particles with the low specific angular momentum, the second one is mainly caused by an inward propagation of mode. After the disc is fully developed (), the mass accretion rate has a single peak per orbit only due to the wave induced accretion. In the long-term, the mass accretion rate gradually increases with time after
In model 2 (middle panel), the mass accretion rate basically shows the same behaviour as that of model 1 in the short term, except that its peak value is higher than the mean mass-transfer rate after the disc is developed. In the long term, the mass accretion rate gradually increases with time and saturates for with an orbital modulation. This is because the mass of gas transferred from the Be disc over one orbital period is balanced with that of the accreting gas on to the neutron star for . For example, as shown in Table 1, the mean mass-accretion rate for the last one orbital period is , which approximately equals to the mean mass-transfer rate from the Be disc. Thus, we noted that the disc gets to the quasi-steady state for in model 2.
In model 3 (bottom panel), the mass accretion rate has double peaks per orbit throughout the simulation. Although the first peak of the mass accretion rate is remarkable for a developing phase of disc formation, it decrease with time after the disc is developed (). The value of the first peak could include an artificial effect since it is related to the size of the inner simulation boundary .


3.2 Mode strength
As described in Section 2.2, the one-armed spiral wave is excited by the ram pressure due to phase-dependent mass-transfer from the Be disc regardless of the simulation parameters. The strength of the mode can be defined in various ways by decomposing the surface density distribution into Fourier components which vary as with being the azimuthal harmonic number. In paper II, we defined it after Lubow (1991) by integrating each Fourier component of the surface density over the whole disc and then calculating its amplitude [see eq. (2) of paper II]. If the spiral wave is, however, tightly winding, this method will give significantly underestimated amplitudes. To avoid it, we define here the strength of the mode as follows.
| (3) |
where and are the azimuthal Fourier components of the surface density given by
| (4) |
where is either or function, and is the total disc mass given by
Fig. 6 shows the evolution of the strengths of several modes in models 1-3. In each panel, the solid thick line, the dotted line and the solid thin line show the strengths of , and modes, respectively. It is noted from the figure that the one-armed mode is always dominant among modes excited in the disc. In the short term, the mode is amplified after every periastron passage by the ram pressure due to the phase-dependent mass transfer from the Be disc. The mode significantly decays by the next periastron passage. In the long-term, the amplitude of mode keeps decreasing until the disc reaches the quasi-steady state.


3.3 Disc mass, radius and viscous time-scale
Fig. 7(a) shows the evolution of the disc mass in models 1-3 over the period of . In the figure, the thick solid line, the dotted line and the thin solid line denote the disc mass in models 1, 2 and 3,respectively. In the short term, it modulates with the orbital phase. The disc mass starts increasing, when the mass-supply from the Be disc begins slightly before every periastron passage. It shows a rapid increase for a short while, followed by a gradual decrease by accretion with no mass-supply from the Be disc, which lasts until the next periastron passage. In the long term, the disc mass increases during the transition phase, because the averaged mass accretion rate on to the neutron star is smaller than the averaged mass transfer rate from the Be star. After the disc reaches a quasi-steady state, in which the mass accretion rate is, on average, balanced with the mass transfer rate, shows only a regular orbital modulation. For example, in model 2, the disc mass saturates at .
In Fig. 7(b), we show the evolution of the disc radius over for models 1-3. As in paper I, the disc radius is measured by applying the following simple fitting function
| (5) |
to the radial distribution of the azimuthally-averaged surface density . Here and are constants and is the radius of accretion disc. In the early stage of disc formation, the disc is highly eccentric, for which the radius calculated by equation (5) is larger than that for a circular disc with the same disc mass. Since the disc eccentricity decreases with time during the developing phase, because of the viscous relaxation, so does the disc radius. After the disc is circularized and enters the transition phase, the disc radius increases with time until the disc reaches the quasi-steady state.
Fig. 7(c) shows the evolution of the viscous time-scale of the disc over for models 1-3. The viscous time-scale is estimated at the radius in all models using azimuthally averaged quantities. Note that the smaller the polytropic exponent, the longer the viscous time-scale. Thus, the viscous time-scale in model 3 () is the longest among three models studied in this paper. For example, at , , and in models 1, 2 and 3, respectively. The disc evolution changes its trend dramatically before and after the viscous time-scale is reached, as shown in Figs. 5 and 6 and in Panels (b) and (c) of Fig. 7.


4 Discussion
| Evolutionary state | Accretion mechanism |
|
||
|---|---|---|---|---|
| Developing phase | Direct/Wave-induced | Periastron/Wave-dependent phase | ||
| Transition phase | Direct (only in an earlier stage)/Wave-induced | Periastron/Wave-dependent phase | ||
| Quasi-steady state | Wave-induced | Wave-dependent phase |
We have performed the three dimensional simulations of the long-term evolution of accretion disc around the neutron star in Be/X-ray binaries, taking into account the phase-dependent mass transfer from the Be disc. We have adopted the mass-transfer rate from a high-resolution simulation by Okazaki et al. (2002) for a coplanar system with a short period () and moderate eccentricity , which targeted 4U 0115+63, one of the best studied Be/X-ray binaries.
We find that the disc evolves via three distinct phases, which consists of the first developing phase in which the disc is initially formed and developing, the second transition phase in which the disc is fully developed but still grows with time, and the final quasi-steady state in which the mass-transfer rate from the Be disc is balanced with the mass-accretion rate onto the neutron star.
Throughout the developing phase and in an earlier stage of the transition phase, the mass-accretion rate has double peaks per orbit. The first peak, which is due to the direct accretion of gas particles with low specific angular momentum, occurs soon after periastron passage, whereas the second peak is due to the wave induced accretion and occurs at a phase dependent on the time-scales of excitation and propagation of the wave.
The first peak is dominant in the developing phase. But in the earlier stage of the transition phase, the predominance of the first peak decreases with time, and finally the second peak becomes stronger. In a later stage of the transition phase and in the quasi-steady state, the mass-accretion rate has a single peak due to the wave induced accretion. These characteristics are summarized in Table 2.
Fig. 8 shows the peak phases of the mass accretion rate and their frequency distributions in models 1-3. Note that the accretion rate peaks are distributed over a wide range of orbital phase, depending on the polytropic exponent as well as the evolutionary state: In model 3 (), in which the direct accretion of particles of low specific angular momentum is the major accretion mechanism, the accretion rate peaks are concentrated around the periastron. In contrast, in model 1 (), in which the accretion is mainly by the wave, the accretion rate peaks are distributed around the apastron with a large scatter. In model 2 (), in which the accretion is also due to the wave-induced accretion, the peak phases are concentrated around . The difference in the phases of accretion rate peaks between models 1, 2 and 3 results from the difference in the major accretion mechanism, whereas the peak-phase difference between models 1 and 2 is due to the difference between time-scales of excitation and propagation of the one-armed wave.
The time-scale of wave propagation is roughly estimated by using the dispersion relation of the one-armed oscillation in nearly Keplerian discs (Kato, 1983). Its frequency is written by , where is the radial wave number. Then, the time-scale for a one-armed perturbation to travel across the disc is written by . Thus, the time-scale of wave propagation is obtained as at for model 1, at for model 2 and at for model 3. Therefore, combing the time-scales for wave excitation and propagation, we expect that the X-ray maxima lag behind that of the mass-transfer rate by , and for models 1-3, respectively. These results are in good agreement with the phase of the peak due to wave induced accretion (see Figs. 5 and 8).
The evolutionary time-scale of the disc depends on its viscous time-scale. The viscous time-scale of the disc increases with disc radius , because with being the temperature gradient in the radial direction. Thus, the larger the accretion disc, the longer the evolutionary time-scale. Given that the size of the accretion disc basically depends on the specific angular momentum of material transferred from the Be disc at periastron, which is larger for longer orbital period and/or smaller eccentricity, we expect that the accretion disc in Be/X-ray binaries evolves most slowly in systems with long period and low eccentricity, whereas it evolves most rapidly in short-period, highly eccentric systems.
On the other hand, the long-term mass supply to the neutron star in Be/X-ray binaries is controlled by the quasi-cycle of Be-star activity (see Negueruela et al. 2001) for yr quasi-cycles of Be-disc formation and decay in 4U 011563). Therefore, it is likely that accretion discs in systems with long period and low eccentricity show only the early evolutionary state, i.e., the developing phase and an early stage of the transition phase, whereas those in highly eccentric, short-period systems exhibit a variety of evolutionary states including the quasi-steady state. The observed X-ray behaviour can be used to probe the evolutionary state of the accretion disc in Be/X-ray binaries.
Circinus X-1, which is a possible HMXB, has shown an interesting distribution of the X-ray maxima, although the companion is unidentified yet. Clarkson et al. (2004) have examined the distribution of the X-ray maxima in Circinus X-1 by dividing mainly into a couple of different states according to the day numbers. In the high state, the X-ray maxima is distributed over a wide range of orbital phase with a peak at the orbital phase , whereas the distribution of the X-ray maxima is much more stable in the low state. These results give an interesting suggestion on the evolutionary state of the accretion disc in Circinus X-1. From the erratic and variable X-ray behaviour in the high state, the disc is considered to be in a later stage of the transition phase. The systems’s X-ray behaviour is thus dominated by the wave induced accretion. In the low state, the disc is considered to be in the developing phase. Thus, the X-ray maxima resulting from the direct accretion are concentrated at periastron, as shown in Table 2.
5 conclusions
In the framework of interaction between the Be star with the circumsteller disc and the neutron star, we have carried out the three dimensional SPH simulations of the long-term evolution of accretion disc around the neutron star in a coplanar Be/X binary with a short period () and a moderate eccentricity (), taking into account the phase-dependent mass transfer from the Be disc. Our main conclusions are summarized as follows:
-
(1).
A persistent accretion disc is formed around the neutron star in Be/X-ray binaries with a short period and a moderate eccentricity.
-
(2).
The disc has a one-armed structure of transient nature. The one-armed density wave is excited by the ram pressure of the material transferred from the Be disc at each periastron passage, and is damped by the next periastron passage.
-
(3).
The disc evolves via three distinct phases: the first developing phase, the second transition phase and the final quasi-steady state. In the developing phase, the disc is formed and develops towards a nearly Keplerian disc. Then, in the transition phase, the approximately Keplerian disc grows with time. Finally, in the quasi-steady state, the mass-accretion rate on to the neutron star is on average balanced with the mass-transfer rate from the Be disc, and the disc exhibits regular orbital modulation.
-
(4).
There are two mechanisms that causes the orbital modulation of the accretion rate in Be/X-ray binaries: the direct accretion and the wave-induced accretion. While the former is due to the low specific angular momentum of the material transferred from the Be disc, the latter results from the one-armed wave induced by the periodically varying mass-transfer from the Be disc. The accretion rate has double peaks per orbit by these mechanisms in an earlier stage of disc evolution. In a later stage, however, it has only a peak arising from the wave-induced accretion.
Be/X-ray binaries are an ideal laboratory of systems for studying physics of accretion. Unlike close binaries, most Be/X-ray binaries have eccentric orbits, the double circumsteller discs and can also be highly inclined systems. Such systems provide us a valuable opportunity to study the effects of the periodically-changing tidal potential and mass-transfer rate and the inclination angle on the structure and evolution of the accretion flow, which hitherto have been studied little. In addition, the knowledge on these effects are applicable to a wide range of astrophysical objects, e.g., AGNs with periodic light curve such as OJ 287 which is considered to have binary black holes with double circumblack-hole discs in the central region of nuclei. Much more work is desirable both theoretically and observationally in order to understand this interesting and important group of objects.
acknowledgements
We are grateful to the anonymous referee for constructive comments. KH thanks Dr James R. Murray for useful comments. KH also thanks all staffs of the Centre for Astrophysics & Supercomputing at Swinburne University of Technology for their hospitality. The simulations reported here were performed using the facility of the Centre for Astrophysics & Supercomputing at Swinburne University of Technology, Australia. This work has been supported by Grant-in-Aid for the 21st Century COE Scientific Research Programme on ”Topological Science and Technology” from the Ministry of Education, Culture, Sport, Science and Technology of Japan (MECSST) and in part by Grant-in-Aid for Scientific Research (16540218) of Japan Society for the Promotion of Science.
References
- Bate et al. (1995) Bate M.R., Bonnell I.A.,Price N.M., 1995, MNRAS, 285, 33
- Benz (1990) Benz W., 1990, in Buchler J. R.,ed.,The Numerical Modelling of Nonlinear Stellar Pulsations. Kluwer, Dordrecht, p.269
- Benz et al. (1990) Benz W., Bowers R.L., Cameron A.G.W., Press W.H., 1990, ApJ, 348, 647
- Bildsten et al. (1997) Bildsten, L., Chakrabarty, D., Chiu, J., et al. 1997, ApJS, 113, 367
- Clarkson et al. (2004) Clarkson W.I., Charles P.A & Onyett N., 2004, MNRAS, 348, 458
- Frank et al. (2002) Frank J., King A.R., Raine D.J., 2002, Accretion power in Astrophysics, 3rd edn. Cambridge Univ. Press, Cambridge
- Hayasaki & Okazaki (2004) Hayasaki K & Okazaki A.T., 2004, MNRAS, 350, 971 (paper I)
- Hayasaki & Okazaki (2005) Hayasaki K & Okazaki A.T., 2005, MNRAS Letters, 360, 15L (paepr II)
- Kato (1983) Kato S., 1983, PASJ, 35, 249
- Negueruela et al. (2001) Negueruela I., Okazaki A.T., Fabregat J., Coe M.J., Munari U & Tomov., 2001,
- Lubow (1991) S H. Lubow., 1991, ApJ, 381, 268
- Ogilvie (2001) Ogilvie G.I., 2001, MNRAS, 325, 231
- Okazaki et al. (2002) Okazaki A.T., Bate M.R., Ogilvie G.I & Pringle J.E., 2002, MNRAS, 337, 967