Extended Star Formation and Molecular Gas in the Tidal Arms near NGC 3077
Abstract
We report the detection of ongoing star formation in the prominent tidal arms near NGC 3077 (member of the M 81 triplet). In total, 36 faint compact H II regions were identified, covering an area of kpc2. Most of the H II regions are found at H I column densities above cm-2 (on scales of 200 pc), well within the range of threshold columns measured in normal galaxies. The H II luminosity function resembles the ones derived for other low–mass dwarf galaxies in the same group; we derive a total star formation rate of 2.6 M⊙ yr-1 in the tidal feature. We also present new high–resolution imaging of the molecular gas distribution in the tidal arm using CO observations obtained with the OVRO interferometer. We recover about one sixth of the CO flux (or M M⊙, assuming a Galactic conversion factor) originally detected in the IRAM 30 m single dish observations, indicating the presence of a diffuse molecular gas component in the tidal arm. The brightest CO peak in the interferometer map (comprising half of the detected CO flux) is coincident with one of the brightest H II regions in the feature. Assuming a constant star formation rate since the creation of the tidal feature (presumably years ago), a total mass of M⊙ has been transformed from gas into stars. Over this period, the star formation in the tidal arm has resulted in an additional enrichment of Z0.002. The reservoir of atomic and molecular gas in the tidal arm is M⊙, allowing star formation to continue at its present rate for a Hubble time. Such wide–spread, low–level star formation would be difficult to image around more distant galaxies but may be detectable through intervening absorption in quasar spectra.
1 Introduction
Studies of the processes that lead to star formation are critical for our understanding of how galaxies form and evolve with time. In massive galaxies, star formation is triggered through a variety of processes: e.g., compression of molecular cloud cores in spiral density waves, tidal interactions, and bar formation. On scales of a few hundred parsecs, star formation is observed where the gas density exceeds a threshold, whose value varies with the critical density for local gravitational stability (e.g., Martin & Kennicutt 2001). Models that rely on thermal instabilities to determine the star formation threshold predict a constant threshold column density (Schaye 2004).
Studies of star formation (SF) in tidal arms of interacting galaxies offer the possibility to study SF processes at conditions that are distinctly different from those in normal galactic disks (e.g., given the absence of spiral density waves and bars). Nearby, interacting systems give us the unique opportunity to study the properties of tidal features (e.g. atomic and molecular gas content and H II region properties) in detail. Tidal dwarf candidates have been detected in tidal tails of interacting galaxies in a number of cases (e.g., see list in Braine et al. 2001); but selection effects limit these to bright, and therefore fairly evolved, tidal dwarfs. The detection of SF regions around interacting systems (‘intergalactic’ H II regions) has been reported in Ryan–Weber et al. (2004). Given the much higher incidence of interacting galaxies in the past, a significant fraction of today’s dwarf galaxies may have formed out of tidal debris (Hunsberger et al. 1996, Hunter et al. 2000, Okazaki & Taniguchi 2000, Duc et al. 2004). Also of interest in this context is the self-enrichment of these tidal debris, and their possible incidence as intervening metal line systems.
The nearby M 81 triplet (consisting of M 82, M 81 and NGC 3077) is an ideal testbed to study tidal arms around interacting galaxies in detail. The H I map of Yun et al. (1994) shows a geometrical cross section of roughly 50 kpc 100 kpc at column densities of N(HI)1.81020 cm-2. The impressive tidal arm near NGC 3077 is the subject of the present study (total H I mass: M⊙, Walter et al. 2002). According to various numerical simulations (Thomasson & Donner 1993, Brouillet et al. 1991, Yun et al. 1993) this tail has been created by a recent ( yr) interaction with M 81. Barbieri et al. (1974) detected ‘a fragmentary complex of almost stellar objects’ in this region (the ‘Garland’, see also Karachentsev et al. 1985, Sharina 1991, Sakai & Madore 2001). The presence of extended molecular gas in this tidal feature has been reported by Walter & Heithausen (1999) and Heithausen & Walter (2000). In this paper we report on the discovery of low–level star formation over roughly 24 kpc2 and present new high–resolution observations of the molecular gas distribution in this feature. In Section 2 we summarize our observations obtained at the 2 m telescope at Kitt Peak, and at the OVRO millimeter interferometer. In Sec. 3 we present the distribution of the H II regions, the H II luminosity function and the high–resolution CO maps; Sec. 4 summarizes our results.
2 Observations
2.1 Optical Observations
We obtained deep narrowband imaging of the region including NGC 3077 and the prominent tidal arm with the 2 m telescope at Kitt Peak on 2000 January 2–10. The seeing yielded a median image quality of 13 FWHM. The individual frames were corrected for fixed pattern noise in the standard way using IRAF111IRAF is distributed by the National Optical Astronomy Observatory, which is operated by the Association of Universities for Research in Astronomy, Inc., under cooperative agreement with the National Science Foundation., aligned using foreground stars, and combined by filter subset. The H image presented here was constructed from an on-band image taken through filter KP1468, central wavelength (CWL) of and a full width half maximum (FWHM) of 87Å, and an appropriately-scaled continuum image taken through filter KP809 (CWL = 6488Å, FWHM=67Å). Observations of spectrophotometric standards were used to flux calibrate the H image. The H image contains [NII] emission. The correction is H/([NII]+H)=0.75 in the center of NGC 3077 and increases to H/([NII]+H) = 0.56 in the extended gas, where the ionization parameter is low (Martin 1997). This correction has not been measured in the tidal gas; but if the gas phase metallicity is lower in the arm, then the contribution from [NII] will be smaller than in NGC 3077. The foreground Galactic extinction is about 0.11 magnitudes at H (Schlegel et al. 1998; Burstein & Heiles 1982).
2.2 OVRO observations
We observed NGC 3077 in the CO(10) transition at 115 GHz (2.7 mm) using the Owen’s Valley Radio Observatory’s millimeter array (OVRO) in C (baselines ranging from ) and L () configurations during 18 tracks during the years 2000-2002 (typical length of one track: 8 hours). To cover most of the CO emission detected in our earlier observations using the IRAM 30 m single dish telescope (Walter & Heithausen 1999, Heithausen & Walter 2000) we observed 4 pointings (primary beam size of one OVRO antenna: 1′). The northern pointing (which was centred on the maximum of the IRAM 30 m observations) was observed for 10 tracks in 2000, the additional three pointings towards the south were added in 2002 (total: 8 tracks). Data were recorded using a correlator setup resulting in velocity resolutions of 2.6 (after online Hanning smoothing) with a total bandwidth of (i.e. fully covering the profiles detected in the single dish observations). Flux calibration was determined by observing 1328+307 (3C286) and Neptune for approximately 20 minutes during the observing runs. These calibrators and an additional noise source were used to derive the complex bandpass corrections. The nearby calibrators B0716+714, J1048+717 and J0841+708 were used as secondary amplitude and phase calibrators. The data for each array were edited, calibrated and mapped with the mma and the miriad packages.
The most northern pointing has a beamsize of 7.0 6.0′′ (natural weighting) and an rms of 20 mJy beam-1 in a 2.6 km s-1 channel (conversion factor: 1 K=0.45 Jy beam-1). The southern pointings have slightly higher resolution (6.25.4′′, due to the different uv–coverage) but have significantly higher noise (65 mJy beam-1, due to the shorter integration times). The emission in individual channels is faint and all the detected features are narrow (typically 3–5 channels); therefore it is not possible to calculate integrated CO maps directly from the 60 channel data cube. We thus blanked emission that was not present in consecutive channels to create a map of the integrated CO emission.
3 H II Regions and Molecular Gas in the Tidal Arm
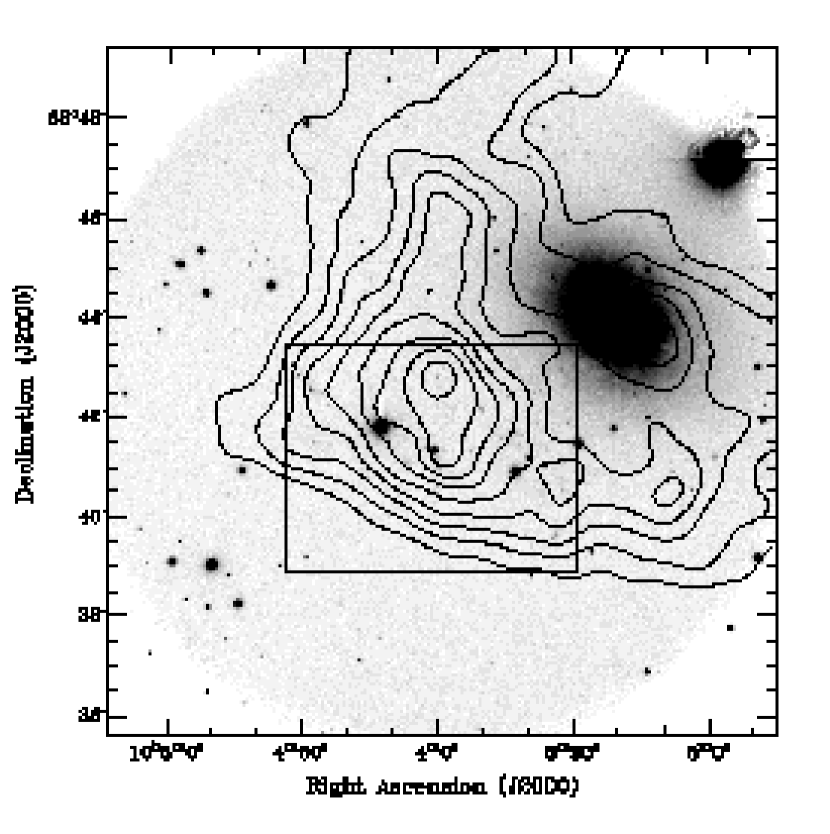
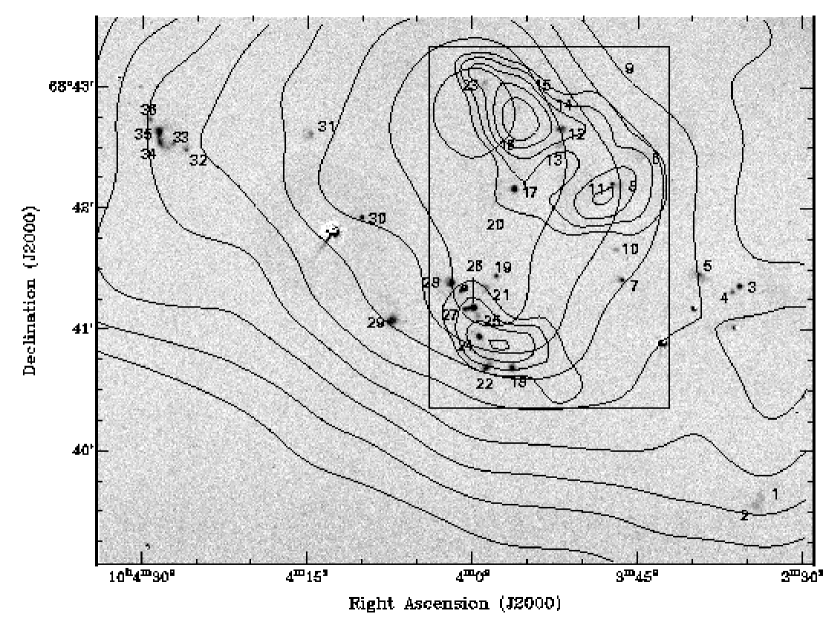
Fig. 1 shows a B–band image of the region around NGC 3077; the contours show the distribution of neutral hydrogen (Walter et al. 2002, here smoothed to 40′′ resolution). Fig. 2 is a blown–up H image of the region indicated by a box in Fig. 1 and shows the newly detected H II regions in the tidal arm near NGC 3077. In total, we catalogued 36 H II regions – all are associated with the prominent tidal H I arm near NGC 3077. For each individual region we determined the coordinates, fluxes, luminosities, diameters and H I column densities (Tab. 1). In the following we will adopt a distance of 3.6 Mpc to the the tidal arm (leading to a scale of 17.5 pc/[′′]). This corresponds to a distance modulus of 27.80 mag (values used in previous studies for M 81, NGC 3077 and the surroundings: 27.76 mag: Sharina 1991, 27.93 mag: Sakai & Madore 2001, 27.80 mag: Freedman et al. 1994).
3.1 Global Comparison to Atomic and Molecular Gas
The H II regions are distributed over an impressive area of kpc2=24 kpc2. Most of the H II regions are found where the H I column density reaches values cm-2 (in a 13′′ [ 200 pc] beam, Tab. 1). Most of the regions are rather compact (Tab. 1), we derive an average diameter for the regions (here defined as the FWHM of the H II regions, after deconvolving for the point spread function of our H observations, FWHM: 1.3′′) of 1.9′′ (2.3′′ before the deconvolution). This corresponds to a linear size of 35 pc, i.e., similar to the radius of a Stromgen sphere of a massive O star.
The thick lines in Fig. 2 represent the distribution of molecular gas in the tidal features as traced by the CO(10) emission observed with the IRAM 30 m single dish telescope (Heithausen & Walter 2000). The southern region coincides with the highest density of star formation. The higher star formation rate in the southern molecular complex is also evident from the excitation conditions of the molecular gas: the CO(21)/CO(10) line ratio is higher in the south as compared to the regions in the north (Heithausen & Walter 2000).
3.2 Distribution of Molecular Gas at High Resolution
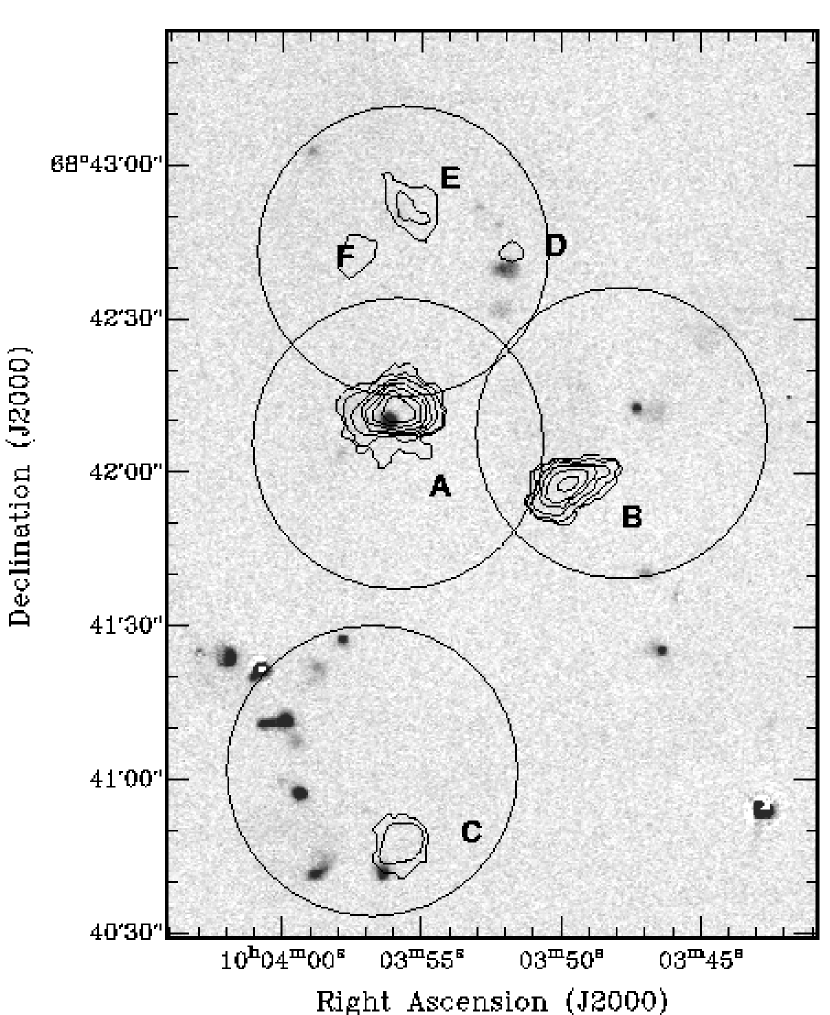
Fig. 3 shows the distribution of the molecular gas as seen by the OVRO interferometer (contours). The circles indicate the primary beam sizes of our four pointings. Recall that the noise in the northern pointing is a factor 3 lower than in the remaining pointings (Sec. 2.2). In total we catalog six regions (A–F) - regions C, D and F are marginal detections and need confirmation by follow-up observations. The properties of these six regions as derived from the OVRO observations (centre coordinates, fluxes, adopted masses and systemic velocities) are summarized in Tab. 2. In Fig. 4 we compare the OVRO (CO), IRAM 30 m (CO) and VLA (HI) spectra for each of the six regions. The OVRO spectra (thick full line) are plotted in units of Jy beam-1, as indicated on the left hand axis, the IRAM 30 m data (dashed line) are in units of Tmb (right hand axis). For comparison, the VLA HI data are plotted as the thin dotted line. From this it is evident that the CO velocities are in good agreement with the peaks of the H I spectra at the same position. It is also clear that regions C, D and F need follow–up confirmation.
Although the signal–to–noise of the OVRO observations is low, we can still attempt to derive a virial mass estimate for the brightest two regions (regions A and B). From the intergrated CO map we derive an effective (deconvolved) radius of pc for both regions. The line width for both regions is also similar (FWHM: 7.5 km s-1). Using Mvir=250[pc][km s-1]2 we thus derive approximate virial masses of M⊙ for both regions (with an error of order 30–50%). If we take the measured CO flux (SCO) of these two regions and apply a Galactic conversion factor to convert CO luminosities to molecular gas masses we derive H2 masses of 1.3 M⊙ and M⊙ for regions A and B, respectively (see caption of Tab. 2 for details). As these numbers (virial mass compared to mass derived using a Galactic conversion factor) are in agreement within the errors, this implies that the CO–to–H2 conversion factor in the tidal arm appears to be similar to the Galactic value. We note that a Galactic conversion factor was also found to hold for the centre of NGC 3077 (Meier et al. 2001, Walter et al. 2002). We thus derive a total molecular gas mass recovered by the OVRO observations of 2.4 M⊙ (using a Galactic conversion factor for all regions, Tab. 2).
The difference in morphology between the CO map obtained at the IRAM 30 m single dish telescope (Fig. 2) and the OVRO interferometer (Fig. 3) is striking. It can be explained by the fact that our interferometer observations are only sensitive to compact and clumpy structures and will not recover more diffuse emission. In addition, the 30 m single dish map is not fully sampled (see Heithausen & Walter 2000 for details). With our OVRO observations we only recover about one sixth of the total flux detected by the earlier 30 m observations (there we find a total flux of of 22 K km s-1 [100 Jy km s-1] in the area covered by OVRO222Note that the molecular gas masses quoted in Heithausen & Walter 2000 were derived using a conversion factor that was 3 times higher than the Galactic factor used here.) which is entirely consistent with the picture that most of the molecular gas is more extended. Only one molecular cloud complex is associated with a bright H II region (complex A, region 17). Regions C and D are also associated with faint H emission, however most of the other prominent H II regions, in particular in the southern pointing, do not show corresponding CO emission down to our sensitivity limit. One bright CO complex (B) has no associated star formation. It is likely that new star formation will commence in this region in the future. Given the (likely) low metallicity in the tidal arm, we don not expect extinction to play a major role in these regions. Observations of the dust phase (e.g. using Spitzer) would be needed to check if highly extincted, embedded star formation may be present in some areas of the tidal feature.
3.3 H II Luminosity Function
We now investigate how the properties of the 36 H II regions in the tidal feature compare to H II regions found in other dwarf galaxies in the same group. The luminosity function of the H II regions in the tidal arm is presented in Fig. 5 (thick histogram). Also plotted in this figure are the H II luminosity functions derived for other M 81 group dwarf galaxies by Miller & Hodge (1994). Note that the decrease in the luminosity function towards low luminosities is due to the sensitivity of the observations (down to a completeness limit of log(L[erg s-1])36.4) for both our observations and the observations presented in Miller & Hodge (1994). At the bright end of the luminosity function, values for H II regions in the tidal feature do not reach values as high as found in big spiral galaxies or more massive dwarf galaxies (e.g., IC 2574). However, keeping in mind the low number statistics, the shape of the H II region luminosity function is similar to what is found in other low–mass dwarfs such as Holmberg I (Fig. 5).
Even for our brightest H II regions the H luminosity can in principle be emitted by a single massive star (L erg s-1, L erg s-1, Devereux et al. 1997). The total H and [NII] flux (luminosity) for all the H II regions is: F(H=1.88 erg s-1 cm-2 (L(H=2.91 erg s-1). This corresponds to a total star formation rate (SFR) in the entire tidal arm of SFR M⊙ yr-1, where SFR(0.1-100M⊙ stars) = L(H)/1.26 erg s-1 [M⊙ yr-1] (Kennicutt 1998). The ionizing stars are part of stellar clusters, as revealed by deep ACS imaging obtained with the HST (proposal ID 9381, these data will be presented elsewhere).
4 Discussion and Summary
We present the discovery of wide-spread, low-level star formation in the tidal feature near NGC 3077 (total of 36 H II regions). The H I column densities exceed cm-2 over the 24 kpc2 region where the H II regions are found. The total star formation rate in the tidal arm is SFR= M⊙ yr-1. These properties place the complexes amongst the faintest star forming regions detected in tidal arms around galaxies so far (cf. Ryan-Weber et al. 2004). The presence of a huge reservoir of molecular gas ( M⊙, Heithausen & Walter 2000, using the Galactic conversion factor) as well as atomic gas (M M⊙ in the region shown in Fig. 2) suggests that star formation may continue at the current rate for a Hubble time. If some 10 percent of the gas were transformed into stars, the total luminosity of the tidal dwarf will eventually be of order M⊙ (here we simplisticly adopt a stellar mass–to–light ration of 1 M⊙/L⊙), similar to other faint dwarf galaxies in the M 81 group.
It is interesting to note that no clear correlation exists between the sites of on–going star formation and gas column densities (both molecular and atomic): H II regions are not always found where the H I or molecular column density is highest (e.g., Fig. 3). However, star formation is only seen where the H I column density reaches values larger than cm-2 (Tab. 1) – this value is consistent with what is typically found in (dwarf) galaxies (e.g., Skillman 1987, Walter & Brinks 1999, Martin & Kennicutt 2001). Also, the derived H II luminosity function is, within the errors, similar to other low-mass dwarf galaxies in the same group (such as Holmberg I). No H II regions are found with log(L[erg s-1])37.4 – this is more than an order of magnitude fainter than what is found in more massive dwarf galaxies in the same group (e.g. IC 2574) and bigger spiral galaxies (e.g., in M51 luminosities reach values of log(L)[erg s-1]=39, e.g., Rand 1993). None of the H II regions are coincident with the X–ray sources found in the same region of the sky (Ott, Martin & Walter 2003).
It is difficult to estimate when star formation started in the tidal arm. From the fact that we see H emission today it is clear that star formation is occuring well after the creation of the structure some yr ago (i.e., ‘in situ’ formation). If we assume a constant star formation rate over the last yr we estimate a total mass of newly formed stars of M⊙. This star formation is enriching the ISM of the tidal tail with heavy elements: Taking our derived assembled stellar mass since the creation of the feature, and a yield of 2%, we derive a metal production of 1.4104 M⊙ over the last yr. We divide this number by the total amount of gas within the 46 kpc region enclosed by the 1021 cm-2 contour (3 M⊙) to get a metallicity of 4.7, or roughly Z0.002 Solar, well below the values measured for the gas phase in the most metal–poor dwarfs. We note that the total metallicity in the tidal feature is likely higher as models for the tidal arm show that it was stripped from the outskirts of NGC 3077 (Thomasson & Donner 1993, Brouillet et al. 1991, Yun et al. 1993). Measurements of the gas phase metallicity in the tidal feature would thus clearly help to shed light on its origin and history. We conclude that wide–spread low–level star formation may be a common phenomenon in tidal H I tails with column densities that exceed cm-2, leading to chemical enrichment in these tails.
This type of low-level star formation in tidal debris should be detectable, if it is common, as intervening absorption in quasar spectra. The tidal system discussed here would be classified as a damped Lyman–alpha absorber (DLA) with a cross section of roughly 30 kpc2. A tidal origin for (at least some) DLAs would naturally explain their lack of enhanced [Fe] abundance ratios, which suggest that star formation proceeded relatively slowly (Pettini et al. 1999). Direct observations of DLAs at low redshift are consistent in that they indicate associations with a wide variety of galaxy types and relatively small impact parameters (of order 10 kpc, e.g., Kanekar & Chengalur 2003). For comparison, the tidal system discussed here has a mean projected distance of 5 kpc from NGC 3077 (50 kpc distance from M 81). This interesting object should be further explored via metallicity measurements and simulations that would establish the fate of the metals formed in this system.
References
- (1) Braine, J., Duc, P.-A., Lisenfeld, U., Charmandaris, V., Vallejo, O., Leon, S., & Brinks, E. 2001, A&A, 378, 51
- (2) Brouillet, N., Baudry, A., Combes, F., Kaufman, M., & Bash, F. 1991,A&A, 242, 35
- (3) Burstein & Heiles 1982 AJ, 87, 1165,
- (4) Devereux, N., Duric, N., & Scowen, P. A. 1997, AJ, 113, 236
- (5) Duc., P.-A., Bournaud, F., & Masset, F., 2004, A&A, 427, 803
- (6) Freedman, W.L., Hughes, S.M., Madore, B.F., Mould, J.R., Lee, M.G., Stetson, P., Kennicutt, R.C., Turner, A., Ferrarese, L., Ford, H., Graham, J.A., Hill, R., Hoessel, J.G., Huchra, J., Illingworth, G.D. 1994, ApJ, 427, 628
- (7) Heithausen, A. & Walter, F. 2000, A&A, 361, 500
- (8) Hunsberger, S. D., Charlton, J. C., & Zaritsky, D. 1996, ApJ, 462, 50 Hunter, D. A., Hunsberger, S. D., & Roye, E. W. 2000, ApJ, 542, 137
- (9) Kanekar, N., & Chengalur, J. N. 2003, A&A, 399, 857
- (10) Karachentsev, I. D., Karachentseva, V. E., & Boerngen, F. 1985, MNRAS, 217, 731
- (11) Kennicutt, R. C. 1998, ApJ, 498, 541
- (12) Leitherer, C. et al. 1999, ApJS, 123, 3
- (13) Martin, C. L. 1997, ApJ, 491, 561
- (14) Martin, C. L. & Kennicutt, R. C., Jr. 2001, ApJ, 555, 301
- (15) Meier, D.S., Turner, J.L., & Beck, S.C., 2001, AJ, 122, 1770
- (16) Miller, B. W. & Hodge, P. 1994, ApJ, 427, 656
- (17) Okazaki, T. & Taniguchi, Y. 2000, ApJ, 543, 149
- (18) Ott, J., Martin, C. L., & Walter, F. 2003, ApJ, 594, 776
- (19) Pettini, M., Ellison, S. L., Steidel, C. C., & Bowen, D. V. 1999, ApJ, 510, 576
- (20) Rand, R. J. 1993, ApJ, 410, 68
- (21) Ryan-Weber, E. V., et al. 2004, AJ, 127, 1431
- (22) Sakai, S., & Madore, B., 2001, ApJ, 555, 280
- (23) Schaye, J. 2004, ApJ, 609, 667
- (24) Sharina, M. E. 1991, Soviet Astronomy Letters, 17, 383
- (25) Schlegel et al 1998, ApJ, 500, 525
- (26) Skillman, E.D., 1987, In NASA, Washington Star Formation in Galaxies p. 263-266
- (27) Thomasson, M. & Donner, K. J. 1993, A&A, 272, 153
- (28) Walter, F. & Brinks, E. 1999, AJ, 118, 273
- (29) Walter, F. & Heithausen, A. 1999, ApJ, 519, L69
- (30) Walter, F., Weiss, A., Martin, C., Scoville, N., 2002, AJ, 123, 225
- (31) Yun, M. S., Ho, P. T. P., Brouillet, N., & Lo, K. Y. 1993, Evolution of Galaxies and their Environment, 253
- (32) Yun, M. S., Ho, P. T. P., & Lo, K. Y. 1994, Nature, 372, 530
- (33)


| Nr. | RA (2000) | DEC (2000) | F(H | log(L(H) | Dc | |
|---|---|---|---|---|---|---|
| hh mm ss | ′ ′′ | 10-15erg s-1 cm-2 | erg s-1 | ′′ | 1021 cm-2 | |
| 1 | 10 03 33.73 | 68 39 37.9 | 1.98 | 36.5 | — | 0.9 |
| 2 | 10 03 34.18 | 68 39 33.6 | 3.47 | 36.7 | — | 0.7 |
| 3 | 10 03 35.68 | 68 42 21.9 | 7.63 | 37.1 | 1.6 | 0.9 |
| 4 | 10 03 36.35 | 68 41 19.5 | 2.00 | 36.5 | 1.9 | 1.0 |
| 5 | 10 03 39.31 | 68 41 28.0 | 8.92 | 37.1 | 4.8 | 1.2 |
| 6 | 10 03 44.56 | 68 42 27.4 | 6.52 | 37.0 | — | 1.5 |
| 7 | 10 03 46.29 | 68 41 25.0 | 4.13 | 36.8 | 1.8 | 1.5 |
| 8 | 10 03 46.51 | 68 42 12.1 | 2.06 | 36.5 | — | 1.8 |
| 9 | 10 03 46.68 | 68 43 09.7 | 0.49 | 35.9 | 1.3 | 0.9 |
| 10 | 10 03 46.85 | 68 41 40.2 | 1.37 | 36.3 | 2.1 | 1.5 |
| 11 | 10 03 47.24 | 68 42 12.5 | 3.45 | 36.7 | 1.8 | 1.8 |
| 12 | 10 03 51.88 | 68 42 39.8 | 6.87 | 37.0 | 3.2 | 2.1 |
| 13 | 10 03 52.10 | 68 42 31.9 | 2.25 | 36.5 | 2.9 | 2.0 |
| 14 | 10 03 52.16 | 68 42 48.6 | 0.56 | 35.9 | 1.3 | 2.0 |
| 15 | 10 03 52.89 | 68 42 52.0 | 0.79 | 36.1 | 1.7 | 1.9 |
| 16 | 10 03 55.74 | 68 42 50.4 | 1.00 | 36.2 | — | 1.7 |
| 17 | 10 03 56.18 | 68 42 10.3 | 11.9 | 37.3 | 1.7 | 1.6 |
| 18 | 10 03 56.38 | 68 40 42.0 | 6.23 | 37.0 | 2.3 | 1.6 |
| 19 | 10 03 57.79 | 68 41 27.4 | 3.13 | 37.7 | 1.5 | 2.3 |
| 20 | 10 03 57.85 | 68 42 03.9 | 0.97 | 36.2 | 2.0 | 1.9 |
| 21 | 10 03 58.68 | 68 41 21.9 | 3.73 | 36.8 | — | 2.5 |
| 22 | 10 03 58.72 | 68 40 41.7 | 9.55 | 37.2 | 2.7 | 1.3 |
| 23 | 10 03 58.93 | 68 43 02.6 | 1.93 | 36.5 | 2.5 | 2.5 |
| 24 | 10 03 59.34 | 68 40 57.2 | 10.9 | 37.2 | 1.8 | 1.8 |
| 25 | 10 03 59.46 | 68 41 07.0 | 2.61 | 36.6 | — | 2.5 |
| 26 | 10 03 59.85 | 68 41 11.2 | 11.8 | 37.3 | 2.1 | 2.7 |
| 27 | 10 04 00.63 | 68 41 10.6 | 5.53 | 36.9 | 2.1 | 2.5 |
| 28 | 10 04 01.92 | 68 41 24.0 | 0.12 | 37.3 | 2.5 | 1.8 |
| 29 | 10 04 07.33 | 68 41 05.1 | 0.15 | 37.4 | 4.1 | 1.5 |
| 30 | 10 04 10.02 | 68 41 56.5 | 4.28 | 36.8 | 1.5 | 1.7 |
| 31 | 10 04 14.73 | 68 42 37.8 | 4.13 | 36.8 | 3.2 | 1.4 |
| 32 | 10 04 26.02 | 68 42 29.7 | 3.10 | 36.7 | 2.4 | 1.2 |
| 33 | 10 04 27.25 | 68 42 32.4 | 3.46 | 36.7 | 2.4 | 1.0 |
| 34 | 10 04 28.37 | 68 42 33.0 | 8.57 | 37.1 | – | 0.9 |
| 35 | 10 04 28.54 | 68 42 38.5 | 0.12 | 37.3 | 3.3 | 1.0 |
| 36 | 10 04 29.32 | 68 42 44.6 | 3.35 | 36.7 | 2.4 | 0.9 |
| region | RA | DEC | flux | H2 massb | v |
|---|---|---|---|---|---|
| (J2000.0) | (J2000.0) | Jy km s-1 | 104 M⊙ | km s-1 | |
| A | 10 03 55.8 | 68 42 11.8 | 8.2 | 130 | 12.7 |
| B | 10 03 49.7 | 68 41 57.8 | 4.7 | 75 | 10.1 |
| Ca | 10 03 55.7 | 68 40 47.5 | 1.2 | 19 | 17.9 |
| Da | 10 03 51.8 | 68 42 42.9 | 0.15 | 2.4 | 10.1 |
| E | 10 03 55.5 | 68 42 50.8 | 0.90 | 14 | 20.5 |
| Fa | 10 03 57.4 | 68 42 42.5 | 0.35 | 5.6 | 12.7 |