Infrared and Optical Observations of GRB 030115 and its Extremely Red Host Galaxy: Implications for Dark Bursts1
Abstract
We present near-infrared (nIR) and optical observations of the afterglow of GRB 030115. Discovered in an infrared search at Kitt Peak 5 hours after the burst trigger, this afterglow is amongst the faintest observed in the R-band at an early epoch, and exhibits very red colors, with . The magnitude of the optical afterglow of GRB 030115 is fainter than many upper limits for other bursts, suggesting that without early nIR observations it would have been classified as a “dark” burst. Both the color and optical magnitude of the afterglow are likely due to dust extinction and indicate that at least some optical afterglows are very faint due to dust along the line of sight. Multicolor Hubble Space Telescope observations were also taken of the host galaxy and the surrounding field. Photometric redshifts imply that the host, and a substantial number of faint galaxies in the field are at . The overdensity of galaxies is sufficiently great that GRB 030115 may have occurred in a rich high-redshift cluster. The host galaxy shows extremely red colors (R-K=5) and is the first GRB host to be classified as an Extreme Red Object (ERO). Some of the galaxies surrounding the host also show very red colors, while the majority of the cluster are much bluer, indicating ongoing unobscured star formation. As it is thought that much of high redshift star formation occurs in highly obscured environments it may be that GRB 030115 represents a transition object, between the relatively unobscured afterglows seen to date and a population which are very heavily extinguished, even in the nIR.
Subject headings:
gamma rays: bursts1. Introduction
Most ground-based GRB afterglow searches are being pursued first in optical wavelengths. These have relied on either comparing a newly acquired image to an archival image (normally the Digitized Sky Survey) and locating any new sources, or on performing multi-epoch observations and identifying any variable sources within the GRB error box. In many cases both approaches have been used. Such searches have resulted in the discovery of approximately 60 GRB afterglows with about 50% and 35% being discovered, respectively, by each of the methods, and being discovered by a combination thereof. One GRB afterglow was found by a color-color technique, (Rhoads 2001; Gorosabel et al. 2002), exploiting the ability of multi-band observations to distinguish blackbody stellar spectra from the power-law spectra displayed by GRB afterglows.
The advent of small robotic telescopes that can slew automatically in response to GRB alert notices (e.g., ROTSE) and larger telescopes that can easily be remotely operated (e.g., the Palomar 48 inch) has increased the discovery rate of young and bright afterglows. For example, the afterglows of GRB 021004 and GRB 021211 were discovered only minutes after the GRB trigger (Fox 2002; Fox et al. 2003a,b). These rapid-response campaigns have also substantially decreased the fraction of bursts that have no identified optical counterparts: the so called “dark bursts.” Of the GRBs well localised so far by the Wide X-ray Monitor (WXM) on HETE-2, the optical counterpart discovery percentage is , while for bursts localized by the Soft X-Ray Camera (SXC) the discovery rate is , (largely due to the smaller error boxes associated with SXC positions - see for example, Lamb et al. 2003). There are evidently possible selection effects: relatively bright and soft bursts are more easily localised by the SXC, and these smaller error boxes are easier to search to deep limits. Indeed, although Swift now allows routine arcminute error boxes to be routinely circulated its increased sensitivity means that it locates fainter bursts, and the recovery rate of optical afterglows is lower than for the SXC. Nevertheless the dark burst fraction does appear to have decreased significantly from the that was typical during the first few years of GRB observations, when slow and less accurate positions made it more difficult to locate afterglows, even for relatively bright bursts (see e.g. Fynbo et al. 2001; Lazzati et al.2002).
The spectral energy distribution (SED) of a GRB afterglow is best described by a set of connected power-laws with breaks due to synchrotron self-absorption, the peak energy of the electrons, and the time-dependent cooling of the fireball (Sari, Piran & Narayan 1998). In theory, knowledge of these break frequencies allows us to reconstruct details of the afterglow (as has been done for a number of well sampled GRB afterglows to-date, e.g., by Panaitescu & Kumar 2001). Theoretical models are also useful for studying GRBs with no optical afterglows, where observations in some bands (such as X-rays and radio) can be used to place limits on the expected optical flux. In a prototypical dark burst, such as GRB 970828 (Groot et al. 1998; Djorgovski et al. 2001), extrapolation of the X-ray flux, assuming a synchrotron spectrum, led to the conclusion that the burst should have been seen in the optical. Conversely, Fynbo et al. (2001) have shown that the classification of many bursts as dark may simply represent the failure to search either early or deep enough. This interpretation is supported by the detection of the faint afterglow of GRB 020124 (Berger et al. 2003) and the fast fading afterglow of GRB 021211 (Fox et al. 2003a; Crew et al. 2003), which would not have been detected but for early, deep observations. Although it is also true that the refinement of afterglow locations via X-ray observations does allow for very deep pointed observations, and thus enables faint afterglows to be located. This is now commonly the case for Swift bursts.
For the relatively small number of bursts that are still apparently “dark” despite deep and early optical limits, a number of plausible explanations have been widely discussed including i) bursts which occur at high where the Lyman break has moved through the optical bands ii) GRBs which originate from behind significant obscuring columns, significantly attenuating the optical light, iii) bursts which are intrinsically faint (i.e. are spectrally similar to bright) afterglows but are a factor 10-100 fainter and iv) fade very rapidly so that, at the time of the first optical observations they have faded below the detection limit. Observations of afterglows to date, including recent observations of Swift bursts indicate that all of the above explanations may apply with some bursts originating from beyond z=5 (e.g. Jakobsson et al. 2005; Haislip et al. 2005; Kawai et al. 2005), a fraction being apparently obscured (e.g. De Pasquale et al. 2005; Watson et al. 2005). While the first two scenarios above have been used to motivate afterglow searches in the near-infrared, locating afterglows from bursts akin to the third and fourth options can be equally well done by early, deep optical observations.
As the connection between long-duration GRBs and supernovae is now secure (Hjorth et al. 2003; Stanek et al. 2003; Zeh, Klose & Hartmann 2004), we expect GRBs to point to locations of star formation throughout the Universe. The determination of which of the explanations above is the dominant origin of dark GRBs may thus shed light into the processes of star formation and its evolution. For example were many dark GRBs genuinely at high redshifts, they would point to strong star formation even at very early ages in the Universe, while if most are actually in obscured environments at lower redshifts they would support models whereby much of the star formation in the Universe is obscured. Moreover, the type of their host galaxies, their environments and relative frequencies may also indicate where much of the star formation occurs.
Here we present the nIR discovery of the afterglow of GRB 030115. This burst was heavily reddened with respect to a model power law SED and, in the optical, was the faintest GRB afterglow ever observed at similar epochs post-burst. We show that its host galaxy lies at moderate redshift and has very red colors (RK ). It is therefore likely that GRB 030115 was reddened due to high local extinction. Furthermore there is a significant overdensity of galaxies at the redshift of the GRB host possibly associated with the latter; this putative galaxy cluster is a mix of young, blue, star forming systems and red systems which are either dusty starburst systems or contain an older stellar population. This cluster, if confirmed, is the first associated with a GRB, and one of very few known at .
Throughout this paper we assume a cosmology with , and km s-1 Mpc-1.
2. Observations
GRB 030115 was detected by the HETE-2 satellite on 2003 January 15 at 02:44 UT, with a duration of seconds (Kawai et al. 2003). The burst, classified as an X-ray Rich GRB111see http://space.mit.edu/HETE/Bursts/Data/, was localised by both the WXM and SXC instruments with error circles of 5 and 2 arcmin radius, respectively. Early optical observations were acquired by several groups using 1-2 m class telescopes. Comparing these images with the Digitized Sky Survey revealed no new objects, placing an early ( hour) limit on the magnitude of the afterglow at (Castro Tirado et al. 2003; Blake et al. 2003). We obtained data from the Kitt Peak National Observatory (KPNO) 5 and 9 hours after the GRB in the infrared (J,H,K) bands, comparison of which revealed a fading IR source in all filters (see §2.1). Following our announcement of the IR counterpart, a re-inspection of early optical images obtained at =2 hours revealed a marginal optical detection (Masetti et al. 2003a). Further IR observations were obtained by Vrba et al. (2003), Kato et al. (2003) and Dullighan et al. (2004) and confirmed the fading nature of the object, thus securing its association with GRB 030115. Early radio observations at 8.46 GHz (Berger & Frail, 2003) failed to detect the afterglow candidate at =5 hours, specifically recording a flux density of Jy. However, further observations at =55 hours detected a weak source coincident with that of the afterglow, with a flux level of Jy (Frail & Berger 2003). Radio observations were also undertaken at the Westerbork Synthesis Radio Telescope (WSRT) at 3 epochs between 1.5 and 12 days post-burst. Combining these data provided a detection of the radio transient at 4.9 GHz (Rol & Wijers 2003). Sub-millimeter observations were pursued with the SCUBA array on the James Clark Maxwell Telescope (JCMT) at 850 m (Hoge et al. 2003) and the Max-Planck Millimeter Bolometer (MAMBO) and IRAM 30-m telescope at 1.2 mm (Bertoldi et al. 2003). These placed 3- limits at 850 m and 1.2 mm of 6 mJy and 3 mJy, respectively. While these observations are relatively deep (for afterglow searches), and would have detected the host if it were very bright in the submm (cf., Smail et al. 2002), the few sub-mm detections of GRB host galaxies to-date (e.g., Barnard et al. 2003; Berger et al. 2003; Tanvir et al. 2004) have been at the 3 mJy level (at 850 m), and so would not have been detected at these limits.
2.1. Infrared observations
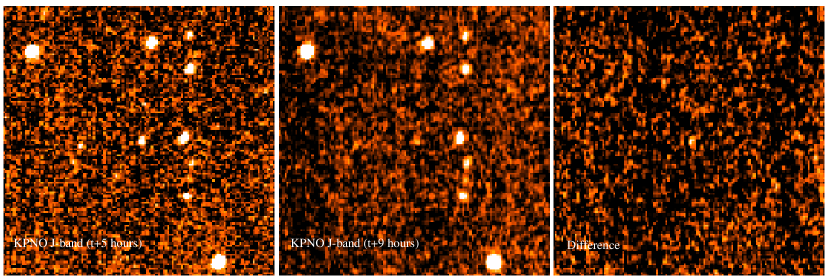
Observations at the KPNO 2.1 m telescope were undertaken using the SQIID (Simultaneous Quad Infrared Imaging Device) which provides 4 simultaneous colours (J,H,K & L). The sensitivity in the nIR is significantly greater than that in the mid-infrared (L-band) and hence only the J, H and K images were used for our analysis. A first epoch of observations was obtained 5 hours after the burst, with a second taken after 9 hours.
A PSF matched image subtraction was performed (using the ISISII code (Alard & Lupton 2000)). This led to the discovery of a transient source, seen to fade in the J, H and K bands. Using the UCAC-2 catalog we find a celestial position of RA11:18:32.63, Dec+15:02:59.9, with a positional accuracy of 01. The discovery images are shown in Figure 1.
Further IR observations were taken with INGRID at the William Herschel Telescope (WHT), and the NOTCAM on the Nordic Optical Telescope, both sited on La Palma, SOFI on the 3.6 m New Technology Telescope at the European Southern Observatory (ESO) La Silla site (J,H and K-band, 26 hours after burst), and finally at the Very Large Telescope (VLT, UT1) at ESO, Paranal, using the ISAAC array. All of these IR observations were reduced through the ORAC-DR pipeline (Cavanagh et al. 2003). A summary is given in Table 1.
| (days) | Inst./Filter | seeing (″) | mag | Jy | (Host Subtracted) |
|---|---|---|---|---|---|
| 0.11 | Asiago/1.82m/R | 2.5 | 21.8 0.3 | 5.5 | 5.3 |
| 0.21 | KPNO2.1m/J | 1.2 | 19.19 0.11 | 3.31 | 3.20 |
| 0.21 | KPNO2.1m/H | 1.2 | 17.82 0.09 | 7.52 | 7.19 |
| 0.21 | KPNO2.1m/K | 1.2 | 16.84 0.05 | 1.19 | 1.14 |
| 0.38 | KPNO2.1m/J | 1.3 | 20.47 0.27 | 1.02 | 9.10 |
| 0.38 | KPNO2.1m/H | 1.3 | 18.37 0.16 | 4.53 | 4.19 |
| 0.38 | KPNO2.1m/K | 1.3 | 17.26 0.08 | 8.12 | 7.65 |
| 1.11 | WHT/H | 1.3 | 20.29 0.28 | 7.44 | 4.10 |
| 1.22 | NTT/J | 0.7 | 21.12 0.19 | 5.59 | 4.49 |
| 1.23 | NTT/H | 0.7 | 20.69 0.31 | 5.35 | 2.01 |
| 1.25 | NTT/K | 0.7 | 19.51 0.15 | 1.02 | 5.50 |
| 1.14 | VLT/FORS2/I | 0.8 | 23.8 0.20 | 8.00 | 4.02 |
| 1.17 | VLT/FORS2/R | 0.8 | 24.5 0.20 | 5.49 | |
| 1.21 | VLT/FORS2/V | 0.8 | 25.1 0.30 | 3.88 | 1.68 |
| 2.10 | NOT/NOTCAM/K | 1.0 | 19.8 0.3 | 7.24 | 2.54 |
| 2.12 | VLT/ISAAC/K | 0.7 | 19.8 0.15 | 7.24 | 2.54 |
| 2.20 | VLT/FORS1/I | 0.8 | 24.0 0.3 | 7.24 | - |
| 2.24 | VLT/FORS1/R | 0.8 | 25.2 0.4 | 2.40 | - |
| GCN data | Kato et al. | 2003a,b | |||
| 0.86 | IRSF/J | 20.4 | 1.05 | ||
| 0.86 | IRSF/H | 19.9 | 3.56 | ||
| 0.86 | IRSF/K | 18.5 | 1.97 | ||
| 1.96 | IRSF/J | 21.5 | 3.10 | ||
| 1.96 | IRSF/H | 20.4 | 3.30 | ||
| 1.96 | IRSF/K | 19.1 | 9.30 |
Note. — Table of observations of GRB 030115. Shown is the time since burst of each observation, the measured magnitude, flux and host subtracted flux. For the final two R and I band points, the flux levels are nominally above those measured for the host galaxy, but consistent within the measurement errors. All of the data points are corrected for foreground reddening E(B-V) = 0.024, assuming a MW extinction law.
2.2. Optical Observations of the GRB 030115 afterglow
Optical observations of the GRB 030115 error box were performed by several groups. However these observations failed to reveal any possible candidates in comparison with the Digitized Sky Survey (Castro-Tirado et al. 2003; Masetti et al. 2003; Flaccomio et al. 2003; Lamb et al. 2003). We obtained data with the 1.82 m Copernico Telescope (first described by Masetti et al. 2003). at =2 hours in poor seeing (″). The images were bias subtracted and flat fielded in IRAF using standard methods. The data contain a weak () detection of the transient at this epoch from which we determine R.
Further optical data were obtained at the VLT using the FORS2 instrument in V, R and I on 2003 January 16 (=26 hours) and in R and I on 2003 January 17, using FORS1. These data were also reduced with IRAF, and again summarised in table 1.
2.3. HST observations of the GRB 030115 host galaxy
GRB 030115 was first imaged with the Hubble Space Telescope (HST) on 2003 February 10. At this epoch we obtained images in F606W (broad V-R) and F814W(I) filters using the Advanced Camera for Surveys (ACS) Wide Field Camera (WFC) as well as in F160W(H) using NICMOS and the NIC3 camera. A second epoch of observations were acquired on 2003 April 24, in F814W(I) and F110W (J) filters. A final set of observations were obtained on 2003 June 16 and 20 in F435W (B) and F222M (K) filters, providing us with a complete set of B(V-R)IJHK photometry on the host galaxy of GRB 030115. The results of these observations are summarised in table 2 (a subset of these observations have also been presented by Dullighan et al. 2004).
| (days) | Inst./Filter | Exptime (s) | mag | (Jy) |
|---|---|---|---|---|
| 26.466 | HST/ACS/F606W | 2000 | 25.58 0.05 | |
| 26.406 | HST/ACS/F814W | 1600 | 24.83 0.04 | |
| 26.268 | HST/NICMOS/F160W | 5120 | 22.68 0.08 | |
| 126.193 | HST/NICMOS/F110W | 2558 | 24.08 0.11 | |
| 127.672 | HST/ACS/F814W | 1920 | 24.85 0.04 | |
| 151.975 | HST/ACS/F435W | 8800 | 25.99 0.12 | |
| 156.071 | HST/NICMOS/F222M | 7678 | 22.21 0.15 |
Note. — Table of observations of the host galaxy GRB 030115 obtained with HST. The magnitudes have been calculated via SExtractor and are given as AB-magnitudes. They have been corrected for foreground extinction assuming E(B-V) = 0.024, and a MW extinction law. The magnitudes reported are those measured in an aperture determined by a SExtractor detection on the F160W image, then applied to other images which have been matched to this.
The ACS data were “On-The-Fly” calibrated to produce flattened images. They were then drizzled (Fruchter & Hook 2002) onto an output grid with pixels 0.66 times the size of the native ACS pixel (this corresponds to ). The linear drop size (pixfrac) was set to one.
In order to estimate the contribution of the afterglow to the late HST observations we aligned and subtracted the two F814W epochs taken at =26 and 127 days respectively. Our VLT/ISAAC image, taken 2 days after the burst, was also aligned with the F814W image, using 22 point sources common to each frame, allowing us to locate the afterglow position to accuracy. At this position we determine a upper limit for the afterglow flux of F814W(AB) (at =26 days). Based on the measured R-band magnitude of R at =2 hours and the optical slope of we would predict that the afterglow should have had at the time of this observation and thus the non-detection is in accordance with what we would expect by extrapolation of the early decay. We conclude that all of our HST observations contain negligible afterglow contamination of the host.
An additional possible cause of contamination could occur due to a possible supernova. Supernovae spectra peak in the optical rest frame, which lies in the IR bands at our favoured redshift (see Section 3.1). We do not have multi-epoch IR observations to test directly via image subtraction, however the expected flux of even an extreme event like SN 1998bw at is Jy (F160W(AB) 27). We therefore do not believe that there could be a visible supernova component in our first IR images.
2.4. Photometry and Light Curve
We calibrated each of our ground based nIR fields by use of secondary standards within the field of view of all telescopes. These stars are shown in Table 3. We performed aperture photometry on the standard stars and the afterglow candidate with the aperture being set to twice the Full Width Half Maximum (FWHM) of the image. The RMS scatter observed in the magnitudes of the standard stars in each of the observations (from that expected and tabulated in Table 3) is less than 0.06 magnitudes.
The lightcurve of GRB 030115 in J, H and K is shown in Figure 2. Fitting the three bands simultaneously yields a power-law decay slope of . However a single power-law is a relatively poor fit to the data, largely due to the second epoch J-band observation, which falls signficantly below the expectation of the power-law at this time.
Extrapolating our R-band observations (R=21.7 at 0.11 days) to the time of the first IR epoch (assuming as the decay slope) yields R=22.6, which results in an R-K colour of 5.7, making GRB 030115 one of the most reddened afterglows observed to date. However it should be noted that this extrapolation assumes that the afterglow behaviour is predictable over this time, the possible unusual behaviour of the J-band lightcurve and the frequent presence of bumps in the afterglow light curves of many GRBs mean that this value should be used with caution.
| RA(∘) | Dec∘ | J | H | K |
|---|---|---|---|---|
| 169.65241 | 15.06268 | |||
| 169.64557 | 15.05777 | |||
| 169.65432 | 15.04912 | |||
| 169.61094 | 15.04204 | |||
| 169.62917 | 15.03929 |
3. The Host Galaxy – Photometric Redshift
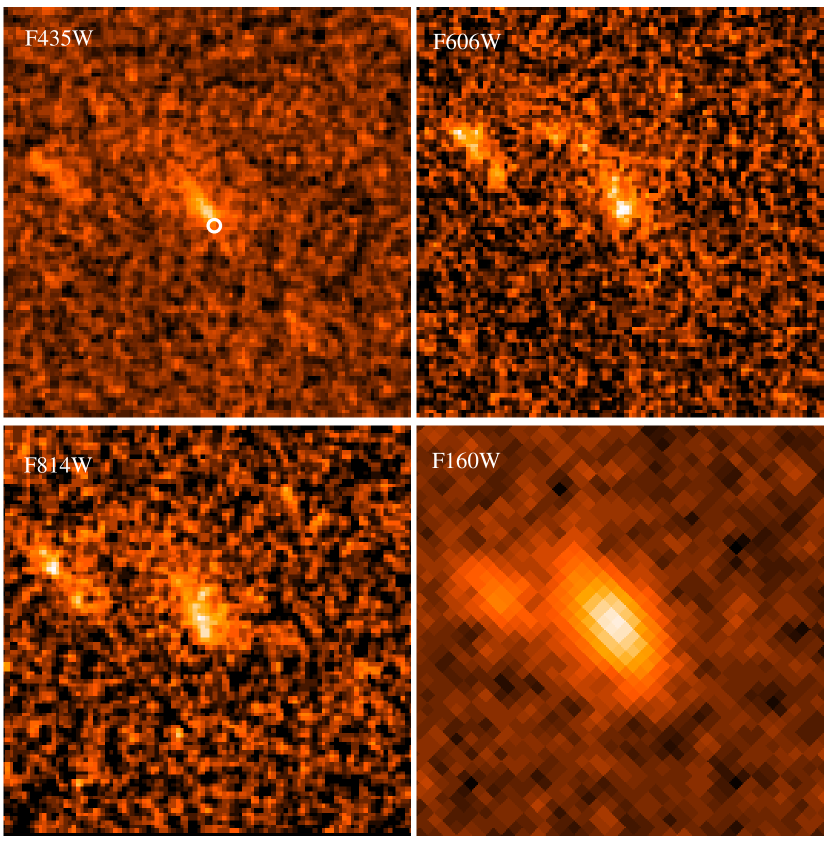
The host galaxy of GRB 030115 (Fig. 4) shows an irregular morphology. The host may be involved in a merger with a companion galaxy offset approximately 1″ northeast of the host. The F435W image (the shortest wavelength used in this study) also shows evidence for an edge-on disk through the host galaxy. Our precise ISAAC astrometry allows us to position the afterglow at the southern end of this putative disk, with a positional accuracy of (). The host was observed with a complete filter set (B(V-R)IJHK) using both ACS and NICMOS. The results of photometry are shown in Table 1. The host has a very red R-K color (5.35), far redder than any other GRB host observed to-date. This color is dominated by a break between the J and H bands of 1.4 magnitudes (AB). It is possible that this represents the Balmer (4000 Å ) break, which could indicate the presence of an underlying older stellar population, however it is not possible to distinguish unambiguously between an strong break as might be expected from an older population and a very steep slope which could be indicative of a younger, but obscured system.
Knowledge of the redshift of GRB 030115 is essential to our understanding of the afterglow, and hence to the issue of “dark” bursts. Despite attempts from the ground to obtain spectroscopy of the host galaxy, the results were inconclusive. We have therefore sought to determine a photometric redshift from our B(V-R)IJHK photometry. In addition we have also determined photometric redshifts for other galaxies which fall within the field of view of our ACS and NICMOS images (the complete region has an area of 0.51 arcmin2) for a complete set of filters.
We have applied two independent codes. The first is the template fitting method of Hyperz 222see http://webast.ast.obs-mip.fr/hyperz/; the second is the Bayesian method of Benítez (2000) 333see http://adcam.pha.jhu.edu/txitxo/bpzdoc.html. They are outlined below but for more detail the reader is referred to Benítez (2000) (BPZ) and Bolzonella, Miralles & Pello (2000) (Hyperz).
Hyperz is a template fitting photometric redshift code. It provides a maximum likelihood redshift by performing fitting of the available photometry with a variety of spectral templates: Starburst (Stb), Elliptical (E), Lenticular (S0), Irregular (Im) and a set of spiral templates of type Sa through Sd. In addition to the photometric redshift and extinction measures it is also possible to obtain an estimate of the age of the stellar population of the host galaxy. The impact of the assumed IMF when Hyperz has been applied to host galaxies has been negligible (Gorosabel et al. 2003a,b; Christensen et al. 2004).
The Bayesian code (BPZ) works by making use of other available information information, rather than simply fitting templates. These priors take into account our knowledge of the expected physical parameters of galaxies, such as their luminosity function, redshift distributions, and galaxy type fractions. Here we use a luminosity prior based on the observed luminosity function seen in the Hubble Deep Field. Therefore, in addition to the template fitting performed by Hyperz, BPZ also determines the probability that a galaxy of that magnitude should be present at the redshift suggested by the linear fit. This can be effective at clipping “unreasonable” redshifts when template fitting alone finds two or more plausible fits.
Magnitudes for the photometric redshifts were determined by aligning and rebinning all of our ACS and NICMOS data to the same pixel scale, while preserving photometry (this was done via the IRAF tasks geomap and geotran). We then defined a detection mask on the F160W image and extracted magnitudes from the same physical region in other filters. We thus obtain a complete set of photometry to H=25(AB). The ACS images are significantly deeper than those obtained with NICMOS and therefore contain many galaxies which are not contained within our catalog. However in the absence of IR detections it is not possible to determine accurate photometric redshifts for these galaxies.
Based on these detection criteria we determine photometric redshifts of for Hyperz and for BPZ. Individually the best fit redshift of the neighbour is found to be based on Hyperz and based on BPZ. The colors of the neighbour galaxy are very blue (F814W-F160W (AB)= 1) and are typical of star forming galaxies containing little dust. The best fitting spectral type of the host galaxy is that of a S0 in Hyperzand a Sb/c in BPZ. Hyperz finds that the internal extinction within the host is moderately large and that its dominant stellar population is old; 2.6 Gyr. This age determination is largely due to the strength of the Balmer break which lies between the J and H bands at this redshift. If this age determination were correct it would imply a redshift of formation of . However, this age should be treated with caution since it has been noted that for Extreme Red Objects (EROs) the photometric shape alone cannot adequately distinguish between dusty, star forming galaxies and those which harbor an older population of stars (Moustakas et al. 2004).
4. Comparison of the host properties with other GRB host galaxies
Given the very red color of both host and afterglow, it is obviously interesting to compare GRB 030115 with other host galaxies. Chary et al. (2002) and Le Floc’h et al. (2003) have imaged a sample of GRB host galaxies in the IR (K-band). Their measurements allow the determination of the global (R-K) color of the host galaxies and provide insight into the extinction and star formation rate. A important question relating to the nature of GRB hosts is whether these are typical of high-z galaxies which are selected by other techniques (e.g., sub-mm surveys). These surveys indicate that the majority of high-z star formation () is obscured with a significant fraction likely taking place in galaxies analogous to the lower redshift ULIRGs. The optical counterparts to these sub-mm bright galaxies are often very red, massive systems. By contrast, typical GRB host galaxies are mostly blue and sub-luminous, though the latter may be due to the steep luminosity function of star-forming galaxies (Fruchter et al. 1999; Hogg & Fruchter 1999; Fynbo et al. 2002; Le Floc’h et al. 2003). The R-K colors of GRB host galaxies are therefore apparently distinct from those of the typically red sub-mm emitting galaxies, and the few GRB host galaxies which do show sub-mm emission do not show any significant optical properties to distinguish them from other GRB hosts (Berger et al. 2003). In fact a sub-mm emitter, like the host of the dark GRB 000210, can show low extinction in the optical-nIR having colours typical of the bluest host galaxies (Gorosabel et al. 2003a). The host of GRB 030115 is, however, very red and lies at a redshift comparable to that of many sub-mm sources (; Chapman et al. 2003). Although early sub-mm afterglow observations have only provided an upper limit to the 850 m flux (Hoge et al. 2003), the depth of these observations would not have been sufficient to detect any other GRB host to-date (Tanvir et al. 2004).
Figure 6 shows the R-K color of the host galaxies of GRBs versus their redshift. K-band data is taken from Le Floc’h et al. (2003) and Chary et al. (2002) (and references therein). The host galaxy of GRB 030115 lies significantly above the curve that represents the majority of the GRB host galaxies. Indeed its spectral type is best fit as an Sc; however it remains significantly underluminous in the optical (rest-frame UV) (R* / 8). In contrast it is apparently overluminous in the K-band (K* 4). It is possible that this is due to extinction within the disk of the host galaxy which we may view edge on. The majority of the optical light produced at the centre of the galaxy could then not escape through the dusty disk of the galaxy, resulting in its red color.
The absence of a single red sub-mm emitting galaxy from the list of GRB hosts is particularly puzzling given the widespread belief that most of the sub-mm emission from these objects is due to dust heating by massive stars (Le Floc’h et al. 2003; Fynbo et al. 2003). The presence of GRB 030115 within a very red host offers some evidence that a fraction of GRBs are extincted and come from larger galaxies with red global colors; however the proportion of bursts which may lie within this class is very poorly constrained so far (see also Klose et al. 2000, 2003). Unfortunately, the faintness of the afterglow GRB 030115 in the optical, precluded high-resolution spectroscopic study of the ISM of the host.
4.1. Host Galaxy Star Formation Rate and Extinction
At our broadband ACS images cover restframe wavelengths of approximately 1550, 2160 and 2900 Å for F435W, F606W and F814W, respectively. From this we can obtain a measure of the host galaxy extinction and star formation rate.
Star formation measures based purely on the rest-frame UV luminosity are prone to significant errors due to the effects of dust scattering and absorption of UV light. Therefore unextincted measurements provide only a lower limit on the star formation rate. Using the relation of Kennicutt (1998),
| (1) |
we obtain an flux (uncorrected for dust extinction) of = erg s-1 cm-2 which, using our choice of cosmology, implies a value of ergs s-1 Hz-1. This gives a SFR of 4.4 M⊙ yr-1, in the F606W passband.
Given the red colour of the observed afterglow we may expect that there is significant dust within the host galaxy and therefore substantial scattering and absorption of the restframe UV flux. This UV flux is then re-radiated in the far infrared. Meurer, Heckman & Calzetti (1999; hereafter M99) have calibrated this effect for local starburst galaxies and find a strong correlation between restframe ultraviolet spectral slope and flux at 60 m. Under the assumption that the relation found for local starbursts holds at higher redshifts (which may be expected, see section 2, M99) we can obtain a better measure of the star formation rate, and the extinction within the host galaxy. The relation given in M99 for extinction is
| (2) |
The relation for spectral slope for at redshift is given by
| (3) |
This results in , corresponding to = 5.3. Correcting our results to this extinction implies a massive star formation rate of yr-1.
While this result remains highly uncertain, taken together with the extreme red color of the host galaxy, makes GRB 030115 an excellent candidate for further sub-mm followup.
5. A possible cluster at
In addition to obtaining the photometric redshift for GRB 030115 we have also been able to extract photometric redshifts for other galaxies within the field. The ACS observations contain many more objects than the NICMOS data, due to its greater depth and field of view. However these observations do not provide sufficient color information to enable photometric redshifts to be accurately determined. Thus only objects detected in the F160W image with magnitudes brighter than F160W(AB) =25.0 are included in the photometric redshift fitting. Stellar objects are rejected based on their extent within the ACS images (which have a much smaller point spread function that the NICMOS observations). A total of 56 galaxies meet this requirement. The histogram of photometric redshifts determined by Hyperz is shown in Fig 7. As can be seen there exists a strong peak in the redshift distribution at , the favoured photometric redshift for the host galaxy using these selection criteria. The RMS of galaxies at redshift within this fit is , indicating that there may be an association (such as an edge-on sheet of galaxies) or possibly a cluster at this redshift. The galaxies which form this association are all galaxies with luminosity at, or somewhat large than L* (in the H-band). We are therefore only seeing the brightest members, while the more numerous, fainter galaxies are not detected.
In order to quantify the potential significance of this association it is necessary to determine the level of overdensity which exists at this redshift. To achieve this we need to examine the distribution of redshifts seen in other deep surveys. Few ground based surveys reach the limits obtained here (although most cover a much wider area). The deep surveys which we chose to use here were the GOODs survey (Giavalisco et al. 2004), the Hubble Deep Field North (HDF-N) and South (HDF-S) and the Hubble Ultradeep Field (UDF). For the HDF-N and UDF there is deep NICMOS imaging in F110W and F160W, for the GOODs survey and the HDF-S the IR imaging comes from ground based observatories, mostly deep VLT/ISAAC imaging. The optical imaging in the HDF-N and HDF-S is by WFPC2 and in the case of GOODs and the UDF is with ACS. In order to confirm the accuracy of our photometric redshifts determined by Hyperz we performed fits on each of the photometric catalogs and compared the accuracy with known spectroscopic redshifts. In order to compare our data with what can be obtained with similar quality data we restricted the catalogs from each of these surveys to F160W(AB)25 or H(AB)25 for ground based observation. We also used the same filter set as obtained for the host of GRB 030115 (in general this means that we did not include U-band observations).
A potential problem with the determination of photometric redshifts via the template fitting only is that at times the redshift is poorly constrained (due often to a very low ()). This commonly leads to low redshift systems being placed in higher redshift bins. Bayesian techniques can solve this problem by eliminating systems which would be overly luminous at a given redshift. Using BPZ on both the HDF and the GRB 030115 field does reduce the number of objects lying in the bin. However the Bayesian priors are based on observed luminosity functions of field galaxies whereas galaxies within clusters may be expected to be more luminous. In practice, using BPZ on the GRB 030115 resulted in 5 objects being removed to a lower redshift bin and a slight broadening of the measured peak. Nonetheless the apparent overdensity remains, favoring a cluster at the redshift of the GRB host galaxy. Also comparison of the photometric redshifts with the known spectroscopic redshifts in the HDF and the GOODs survey implies that with our choice of filters and limiting magnitudes % of low redshift galaxies are placed at by Hyperz. Thus we conclude that at most % of the galaxies placed in the bin are falsely located. Even if these are removed there remains a substantial overdensity in the expected number of galaxies at this redshift, and we conclude that this is most likely a true association, and possibly a cluster of which the host galaxy of GRB 030115 is a member.
Without spectroscopic redshifts for a number of members we cannot determine the nature of the structure which we see unambiguously; it is possible that it is a larger scale association with a broad velocity dispersion which is not gravitationally bound. However should the depth of this overdensity be comparable to its observed width in our HST images, then the association would be a cluster comparable in richness to that of Coma (Somerville 2004).
Figure 8 shows the histogram of colours for all galaxies found to lie in the redshift range . While a few can be seen to have red colors comparable to the GRB host galaxy, the majority of the objects have much bluer colors, consistent with their being star-forming galaxies at this redshift. The host itself is typical of what would be expected of a galaxy in the center of a cluster at its redshift: a red and luminous galaxy still forming stars but in the process of evolving into a modern day elliptical.
5.1. The number of density of EROs about GRB 030115
EROs are generally defined by a color cut at around R-K = 5, although various other more stringent cuts eg., R-K5.35, R-K6, are also used. The original definitions for EROs were based on the expected colors of primeval elliptical galaxies (Elston et al. 1988). In practice EROs consist both of old passive systems (Daddi et al. 2000) and dusty star forming galaxies.
Our deepest IR image, and thus that most suitable to the discovery of red objects is F160W (approximately H-band). Thus we chose equivalent colors of F814W-F160W 1.85 (AB), which is an effectively identical spectral slope to R-K=5 in Vega magnitudes. In our region (approximately 0.5 arcmin2) we find a total of 5 galaxies meeting this criterion. Three of these lie within the overdensity with the other two having poor photometry (4 rather than 6 colors with non-detections at F110W and F222M) fitting better at z 0.7, but also having acceptable fits () at .
We have also searched a larger region surrounding GRB 030115 by using our ACS image in conjunction with the K-band image obtained with ISAAC. The GRB still contributes some flux in this image and therefore the photometry of the host galaxy is not reliable. We determine that there are EROs within this 3.2 arcmin2 region to a limit of K23 (AB). Comparing this with ERO number counts (e.g. Moustakas et al.2004; Gilbank et al. 2003) we find that they are overdense by a factor 2. In practice using the “average” number of EROs is somewhat misleading since EROs are often highly clustered. Figure 9 shows the color magnitude diagram for the GRB 030115 region.
6. The origin of the optical faintness of GRB 030115
6.1. Extinction
GRB 030115 exhibits an exceptionally red color () but was not at extreme redshift. This is very unusual for GRB afterglows which typically have spectra well described as , corresponding to . Furthermore the color of the GRB 030115 afterglow is not well defined by a single power-law, but has significant curvature in the spectral energy distribution occuring at shorter wavelengths. The reddening of the afterglow due to extinction within the Milky Way is probably small, (Schlegel, Finkbeiner & Davies 1998), making extinction in the host galaxy the most likely explanation. In order to estimate the extinction along the line of sight to GRB 030115 we fit the afterglow with an extinction model of the form . We have attempted to obtain the extinction at a given frequency based on the fitting models given by Pei (1993), relevant for differing dust to gas ratios and metallicities which are reflected in the MW, LMC and SMC. These fits result in unphysical parameters for the afterglow spectrum (namely , and , with MW-like extinction), this is true at all redshifts.
The precision of the above measurement could be compromised by several effects. The first is that while the afterglow is bright (and hence the errors small) we only obtain a truly simultaneous SED in three colors (J,H,K) while the R-band data must be extrapolated over a factor 2 in time. The afterglow does not appear to exhibit a “pure” power-law behaviour and this this extrapolation introduces a larger uncertainty into the spectral energy distribution that simply the photometric uncertainty associated with the measurement. As such deviations from a single power-law decline may naturally explain the poor fit obtained for the extinction laws described above). Furthermore, at later times (i.e. 24 hours) the errors in the individual photometrc points are large, and also contain a host contribution which further reduce their accuracy.
A possible physical explanation is that of dust destruction local to the GRB. Under many schemes (e.g., Waxman & Draine 2000; Fruchter, Krolik & Rhoads 2001) dust can be destroyed by the prompt X-ray/EUV emission over a distance of several hundred parsecs about the burst site. This dust destruction removes the small grain sizes, leaving the larger ones unaffected and will change the extinction law to one dominated by larger grains (e.g., Maiolino et al. 2000). The true extinction along our sight line to the GRB is then the composite of the dust local to the GRB environment and that at larger distances in the host galaxy (which in this case shows evidence of being dusty). The true extinction law may possible be very different from those which describe sources in the local Universe and this is the likely reason for the poor fit of these laws to our data. A final possibility is that the afterglow spectrum has some intrinsic curvature, most likely due to the cooling break being in the IR-band at the time of the observation; however the apparent color changes seen in the second epoch are not easily explained as the cooling break, especially since later data are not consistent with this steepened slope.
6.2. A dark burst caught?
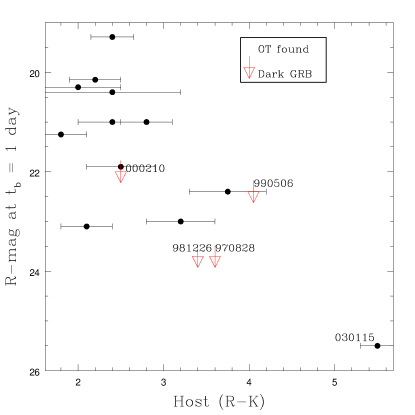
It is instructive to compare the colors of the host galaxy of GRB 030115 with those of the host galaxies of other GRBs, which typically exhibit blue colors (e.g., Fruchter et al. 1999). Fig. 10 (left) shows the R-magnitude of a selection of GRBs plotted against the RK color of their host galaxies. While this plot is limited by small number statistics, it can clearly be seen that of the GRBs seen in the R-band at =24 hours, GRB 030115 is the faintest, and also lies in the most reddened host galaxy. The best fit line is shown, however much power is provided to this fit by GRB 030115 and it is therefore not possible to conclusively demonstrate a real trend whereby dark (faint) GRBs lie in reddened host galaxies.
Fig. 10 (right) shows the colors of GRB afterglows, plotted against the colors of their host galaxies. We have plotted the effective power-law index across the broadest range of wavelengths available for an individual burst. This plot shows little evidence for any correlation between host color and afterglow color, however the extreme nature of GRB 030115 can be clearly seen since both afterglow and host galaxy are very red.
The magnitude of GRB 030115 at =24 hours is the faintest GRB ever detected in the optical at this epoch. The magnitude is deeper than the limits placed on many other “dark” GRBs (see Fig. 11). This implies that GRB 030115 lies in a region of parameter space which would have be consistent with a dark GRB.
7. Conclusions
We have reported the discovery of the afterglow of GRB 030115. Originating from a (photometrically determined) redshift of , the afterglow was the faintest seen in the R-band after 24 hours. The decay rate was faster than the mean of most GRBs with an average decay rate over the first 24 hours of . The faintness of the afterglow in the optical is therefore likely a function of both this rapid decline and its extremely red spectrum.
Comparison of both the afterglow and host galaxy with those observed for other GRBs implies that the latter is the most reddened of any GRB host galaxy for which an afterglow has been seen. This is in contrast to some previous cases where red afterglows have been observed to lie in blue galaxies (e.g. GRB 000418, Klose et al. 2001; Gorosabel et al. 2003). However none of these afterglows is as extreme as that of GRB 030115, which has a flux density below the upper limits set for the large majority of dark GRBs at similar epochs. It may therefore be that some of the dark GRBs so far observed evolved in similar ways to GRB 030115 and were simply missed due to the lack of early IR observations. IR-robotic observations (e.g., REM, Liverpool Telescope) may be very succesful at locating such afterglows in the future and will therefore provide valuable statistics on the number of GRBs occuring in obscured galaxies. In turn these GRB hosts offer a useful tool in characterising the nature of embedded star formation. Indeed moderate resolution spectroscopy of these sources at early times may be one of the best means of providing a detailed study of the environments of such galaxies, which are too optically faint for normal absorption line studies.
GRB 030115 also lies in a potentially significant overdensity of galaxies at . This association consists of a high ERO density, consisting of either dust enshrouded star formation or old, passive systems as well as bluer systems with active unobscured star formation. This association represents one of the richest associations found at .
However, further observations are necessary to confirm the existence of this cluster. Thus far, we have found low-redshift GRBs in field galaxies, however, we expect that as we study GRBs at higher redshifts, we should begin to find them, like GRB 030115, in clusters or in far richer regions of the Universe directly associated with star formation.
Acknowledgements
We thank the referee for an very constructive report which greatly enhanced this paper. Support for Proposal number GO 9405 was provided by NASA through a grant from the Space Telescope Science Institute, which is operated by the Association of Universities for Research in Astronomy. Incorporated under NASA contract NAS5-26555. This work was conducted in part via collaboration within the the Research and Training Network “Gamma-Ray Bursts: An Enigma and a Tool”, funded by the European Union under contract number HPRN-CT-2002-00294. AJL acknowledges the receipt of a PPARC studentship. JMCC acknowledges the receipt of a FPI doctoral fellowship from Spain’s Ministerio de Ciencia y Tecnologia. This work was supported by the Danish Natural Science Research Council (SNF) and partly based on observations made with the Nordic Optical Telescope, operated on the island of La Palma jointly by Denmark, Finland, Iceland, Norway, and Sweden, in the Spanish Observatorio del Roque de los Muchachos of the Instituto de Astrofisica de Canarias.


References
- Alard & Lupton (2000) Alard, C., Lupton, R., 2000, ApJ, 503, 325
- Anderson et al. (2000) Anderson, M.I., et al. 2000, A&A 364, L54
-
Barnard et al.
(2003) Barnard, V. E. et al. 2003, MNRAS 338,1 - Benítez (2000) Benítez, N. 2000, ApJ, 536, 571
- Berger et al. (2003) Berger, E., et al. 2003, Nature, 426, 154
- Berger et al. (2002) Berger, E., et al. 2002, ApJ, 581, 981
-
Berger et al.
(2003) Berger, E., Cowie, L.L., Kulkarni, S.R., Frail, D.A., Aussell, H., Barger, A.J., 2003, ApJ, 588,99 - Berger & Frail (2003) Berger, E., Frail, D.A., 2003, GCN circ. 1817
- Bersier et al. (2003) Bersier, D., et al., 2003, ApJ, 584, 43
- (10) Bertoldi, F., Frail, D. A., Berger, E., Menten, K. M., & Kulkarni, S. 2003, GCN circ. 1835
- Blake et al. (2003) Blake, C., Lamb, D. Q., Barentine, J., Dembicky, J., McCall, B., York, D. G., & McMillan, R. 2003, GRB Circular Network, 1808, 1
- Bloom, Frail, & Kulkarni (2003) Bloom, J. S., Frail, D. A., & Kulkarni, S. R. 2003, ApJ, 594, 674
- Bolzonella, Miralles, & Pelló (2000) Bolzonella, M., Miralles, J.-M., & Pelló, R. 2000, A&A, 363, 476
- Calzetti et al. (2000) Calzetti, D., Armus, L., Bohlin, R. C., Kinney, A. L., Koornneef, J., & Storchi-Bergmann, T. 2000, ApJ, 533, 682
- Castro et al. (2003) Castro, S., et al. 2003, ApJ, 586, 128
- Castro-Tirado et al. (1999) Castro-Tirado, A. J., et al. 1999, Science, 283, 2069
- Castro-Tirado et al. (2001) Castro-Tirado, A. J., et al. 2001, A&A, 370, 398
-
Castro-Tirado et al.
(2003) Castro-Tirado A.J., Gorosabel, J., Casabova, V., 2003, GCN circ. 1807 - Cavanagh et al. (2003) Cavanagh, B., Hirst, P., Jenness, T., Economou, F., Currie, M. J., Todd, S., & Ryder, S. D. 2003, ASP Conf. Ser. 295: Astronomical Data Analysis Software and Systems XII, 12, 237
- Chapman, Blain, Ivison, & Smail (2003) Chapman, S. C., Blain, A. W., Ivison, R. J., & Smail, I. R. 2003, Nature, 422, 695
- Chary, Becklin & Armus (2002) Chary, R., Becklin, E.E., Armus, L., 2003, ApJ, 566, 229
- (22) Christensen, L., Hjorth, J., Gorosabel, J., Vreeswijk, P., Fruchter, A., Sahu, K., & Petro, L. 2004, A&A, 413, 121
- Covino et al. (2003) Covino, S., et al. 2003, A&A, 404, L5
- Crew et al. (2003) Crew, G. B., et al. 2003, ApJ, 599, 387
- Daddi et al. (2000) Daddi, E., Cimatti, A., Pozzetti, L., Hoekstra, H., Röttgering, H. J. A., Renzini, A., Zamorani, G., & Mannucci, F. 2000, A&A, 361, 535
- Diercks et al. (1998) Diercks, A., et al., 1998, ApJ, 503, L105
- (27) Djorgovski, S. G., Frail, D. A., Kulkarni, S. R., Bloom, J. S., Odewahn, S. C., & Diercks, A. 2001, ApJ, 562, 654
- Dullighan et al. (2004) Dullighan, A., Ricker, G., Butler, N., & Vanderspek, R. 2004, AIP Conf. Proc. 727: Gamma-Ray Bursts: 30 Years of Discovery, 727, 467
- Elston, Rieke, & Rieke (1988) Elston, R., Rieke, G. H., & Rieke, M. J. 1988, ApJ, 331, L77
- Flaccomio, Garnavich, & Stanek (2003) Flaccomio, E., Garnavich, P., & Stanek, K. 2003, GCN circ. 1806
- (31) Fox, D. W., et al. 2003, Nature, 422, 284
- Fox (2002) Fox, D. W. 2002, GCN circ. 1564
- Frail & Berger (2003) Frail, D.A., Berger, E., 2003, GCN circ. 1827
- Frail, Kulkarni, Berger, & Wieringa (2003) Frail, D. A., Kulkarni, S. R., Berger, E., & Wieringa, M. H. 2003, AJ, 125, 2299
- Fruchter & Hook (2002) Fruchter, A. S. & Hook, R. N. 2002, PASP, 114, 144
- Fruchter, Krolik, & Rhoads (2001) Fruchter, A., Krolik, J. H., & Rhoads, J. E. 2001, ApJ, 563, 597
- (37) Fruchter, A. S., et al. 1999, ApJ, 519, L13
- Fynbo et al. (2001) Fynbo, J. U., et al. 2001, A&A, 369, 373
- Fynbo et al. (2002) Fynbo, J. P. U., et al. 2002, A&A, 388, 425
- (40) Fynbo, J. P. U., et al. 2003, A&A, 406, L63
- Galama et al. (1999) Galama, T. J., et al. 1999, A&AS, 138, 451
- Galama et al. (2000) Galama T., et al. 2000, ApJ, 536, 185
- Galama et al. (2000) Galama, T. J., et al. 2000, ApJ, 541, L45
- Galama et al. (2003) Galama, T.J., et al. 2003, ApJ, 587, 135
- Gladders & Hall (2002) Gladders, M., Hall, P., GCN circ. 1495
- Gorosabel et al. (2002) Gorosabel, J., et al. 2002, A&A, 384, 11
- Gorosabel et al. (2002) Gorosabel, J. et al. 2002, GCN circ. 1651
- Gorosabel et al. (2005) Gorosabel, J., et al. A&A, 437, 411
- (49) Gorosabel, J., et al. 2003a, A&A, 409, 123
- (50) Gorosabel, J., et al. 2003b, A&A, 400, 127
- Greiner et al. (2003) Greiner, J., et al. 2003, ApJ, 599, 1223
- (52) Groot, P. J., et al. 1998, ApJ, 493, L27
- Harrison et al. (2001) Harrison, F. A., et al. 2001, ApJ, 559, 123
- Hjorth et al. (2002) Hjorth J., et al. 2002, ApJ, 576, 113
- Hjorth et al. (2003) Hjorth, J., et al. 2003, Nature, 423, 847
- Hoge, Stevens, Moriarty-Schieven, & Tilanus (2003) Hoge, J. C., Stevens, J. A., Moriarty-Schieven, G., & Tilanus, R. P. J. 2003, GCN circ. 1832
- Hogg & Fruchter (1999) Hogg, D. W. & Fruchter, A. S. 1999, ApJ, 520, 54
- Holland et al. (2000) Holland, S., Björnsson, G., Hjorth, J., & Thomsen, B. 2000, A&A, 364, 467
- Holland et al. (2003) Holland, S.T., et al. 2003, AJ, 125, 2291
-
Kato et al.
(2003) Katoi D., et al 2003, GCN circ. 1830 -
Kawai et al.
(2003) Kawai N., et al 2003, GCN circ. 1816 - Kennicutt (1998) Kennicutt, R. C. 1998, ARA&A, 36, 189
- Klose et al. (2000) Klose, S., et al. 2000, ApJ, 545, 271
- (64) Klose, S., et al. 2003, ApJ, 592, 1025
- (65) Lamb, D., et al. 2003, astro-ph/0310414
- Lazzati, Covino, & Ghisellini (2002) Lazzati, D., Covino, S., & Ghisellini, G. 2002, MNRAS, 330, 583
- Le Floc’h et al. (2003) Le Floc’h, E., et al. 2003, A&A, 400, 499
-
Levan et al.
(2003) Levan, A.J., Merrill, M., Rol, E., Dell’Antonio, I., Rhoads, J., Fruchter, A.S., 2003, GCN circ. 1818 - Maiolino et al. (2001) Maiolino, R., Marconi, A., Salvati, M., Risaliti, G., Severgnini, P., Oliva, E., La Franca, F., & Vanzi, L. 2001, A&A, 365, 28
-
Masetti et al.
(2003) Masetti N., Palazzi, E., Pian, E., 2003a, GCN circ. 1811 -
Masetti et al.
(2003a) Masetti N., et al. 2003b, A&A, 404, 465 -
Masetti et al.
(2003) Masetti N., Palazzi, E., Pian, E., 2003b, GCN circ. 1823 - Matheson et al. (2003) Matheson, T., et al. 2003, ApJ, 582, 5
- Mészáros (2002) Mészáros, P. 2002, ARA&A, 40, 137
- Meurer, Heckman, & Calzetti (1999) Meurer, G. R., Heckman, T. M., & Calzetti, D. 1999, ApJ, 521, 64
- Miller & Scalo (1979) Miller, G. E. & Scalo, J. M. 1979, ApJS, 41, 513
- Moustakas et al. (2004) Moustakas, L. A., et al. 2004, ApJ, 600, L131
- Panaitescu & Kumar (2001) Panaitescu, A. & Kumar, P., 2001, ApJ, 554, 667
- Pei (1992) Pei, Y. C. 1992, ApJ, 395, 130
- Priddey et al. (2006) Priddey, R. S., Tanvir, N. R., Levan, A. J., Fruchter, A. S., Kouveliotou, C., Smith, I. A., & Wijers, R. A. M. J. 2006, MNRAS, 369, 1189
- Reichart et al. (1999) Reichart, D.E., et al. 1999, ApJ, 517, 692
- Rhoads & Fruchter (2001) Rhoads, J. E. & Fruchter, A. S. 2001, ApJ, 546, 117
- Rhoads (2001) Rhoads, J. E. 2001, ApJ, 557, 943
- Rol & Wijers (2003) Rol, E. & Wijers, R. 2003, GCN circ. 1864
- Sahu et al. (2000) Sahu, K. et al. 2000 ApJ, 540, 74
- Sari, Piran & Narayan (1998) Sari, R., Piran, T. & Narayan, R., 1998, ApJ, 497, L17
- Savaglio, Fall, & Fiore (2003) Savaglio, S., Fall, S. M., & Fiore, F. 2003, ApJ, 585, 638
- Schlegel, Finkbeiner, & Davis (1998) Schlegel, D. J., Finkbeiner, D. P., & Davis, M. 1998, ApJ, 500, 525
- Smail et al. (1999) Smail, I., Ivison, R. J., Kneib, J.-P., Cowie, L. L., Blain, A. W., Barger, A. J., Owen, F. N., & Morrison, G. 1999, MNRAS, 308, 1061
- Smail, Ivison, Blain, & Kneib (2002) Smail, I., Ivison, R. J., Blain, A. W., & Kneib, J.-P. 2002, MNRAS, 331, 495
- Somerville (2004) Somerville, R. S. 2004, ArXiv Astrophysics e-prints, astro-ph/0401570
- Stanek et al. (1999) Stanek, K. Z., Garnavich, P. M., Kaluzny, J., Pych, W., & Thompson, I. 1999, ApJ, 522, L39
-
Tanvir et al.
(2004) Tanvir, N. R. et al. 2004, MNRAS, 352, 1073 - (94) Taylor, G. B., Frail, D. A., Kulkarni, S. R., Shepherd, D. S., Feroci, M., & Frontera, F. 1998, ApJ, 502, L115
- Taylor et al. (2000) Taylor, G. B., Bloom, J. S., Frail, D. A., Kulkarni, S. R., Djorgovski, S. G., & Jacoby, B. A. 2000, ApJ, 537, L17
- Vrba, Luginbuhl & Henden (2003) Vrba F., Luginbuhl, C., Henden, A., 2003, GCN circ. 1822
- Vreeswijk et al. (1999) Vreeswijk, P.M., et al. 1999, ApJ, 523, 171
- Wang & Loeb (2000) Wang, X. & Loeb, A. 2000, ApJ, 535, 788
- Waxman & Draine (2000) Waxman, E. & Draine, B. T. 2000, ApJ, 537, 796
- Yost et al. (2002) Yost et al. 2002, ApJ, 577, 155
- Zeh, Klose, & Hartmann (2004) Zeh, A., Klose, S., & Hartmann, D. H. 2004, ApJ, 609, 952